
Here’s Apple again, the leading stock in the leading stock index.

The inverted hammer candle of 15 Feb didn’t turn out to be the top, despite reaching RSI over 90. Here we are now further up the parabolic curve, a curve that is unsustainable. The question is when it is going to break, because as the leading stock in the leading stock index, it’s likely to be important. On the chart above I’ve marked the long term rising upper resistance line that stretches back years but was broken early Feb 2012. At the end of yesterday RSI was at 85. I’m on the look out again for an intraday reversal and inverted daily hammer candle.
The Vix is still trying to make a rounded bottom. We still see some overbought/overbullish readings in equities, and some negative divergences. We also still see a solid uptrend, and no screaming sell.
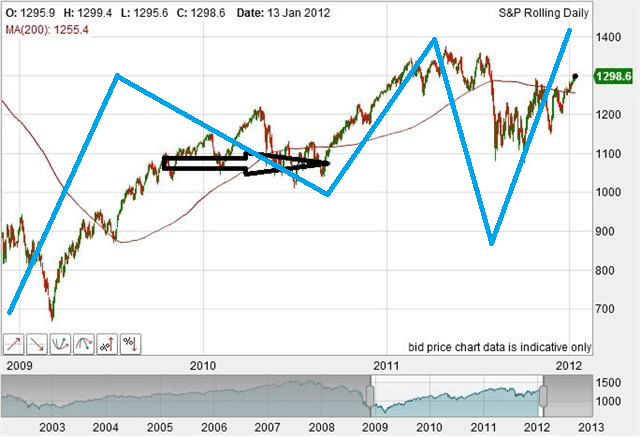
Turning to Citigroup US economic surprises, this index appears to have topped out at the start of 2012, but it tends to lead the market. I’ve highlighted the major recent trends in this index, and applied the same to the S&P500 chart.

Source: Bloomberg

Compare the strong move up in surprises from an extreme low to an extreme high in 2009 and 2011. Both advanced off the bottom a couple of months before stocks bottomed. Back in 2009, the surprises index then topped out at the high extreme around June-July 2009, and gradually fell away to neutral into Autumn/Fall 2010. Stocks tracked overall sideways in this period, as designated by the arrow, but it is notable that stocks made their high within this range about 9 months after economic surprises topped.
In short, assuming economic surprises have topped out and now fall away to neutral (as this is a mean reverting indicator) mirror action to 2009/10 would see stocks push higher into late 2012, before being dragged back.
Now bonds. The 10 year treasury yield is showing evidence of building a rounded bottom.

Source: Stockcharts
The treasury bond aggregate has potentially broken down beyond rising support.

Source: Chris Kimble
Treasury bonds are at a historic extreme high, and yields a historic extreme low. If we see a significant change of trend here, then it will fuel pro-risk.

I think Europe has not solve their problems, Grece goes out the euro, Portugal, Ireland, Spain and Italy have a default or a quit in their debts.
The risk is going up with the decission of ISDA about CDS
Don’t forget Japan and the BRICS. Apple, what a mystery. A parabolic stock reaching historic limits of capitalization but by PE and cash on hand seemingly under valued. I saw a 12 year old playing with the Samsung iPod display. He liked it, but I asked him what type of phone he had. He didn’t have one. He explained he Skyped using his iPod because it was free.
Hagen,
I think you’re right about Eurozone debt and default. Have the ISDA decided that the haircuts for Greek debt will trigger CDSs?
As I understand it, most of the CDSs have been issued by the commercial banks, so if any European country or countries default then not only will those banks have to write down their sovereign debt holdings (and they have been buying a lot more of them recently), but they will also have to pay out on the CDSs they have issued as insurance to other sovereign debt holders.
If this is true, then it is no wonder the financial authorities are so desperate to avoid any defaults.
The UK and US are just as venerable – over the past year, UK debt has been increasing by an average £5000 per minute (in spite of the so-called “cuts”), and US debt by a staggering $6Billion per day!
Regards,
Mark
Hi, John. Am from India. Have been reading your post, interesting topics and analysis. How can I use your dates and timing for Indian Nifty index ?
Regards
NCP
Hi NCP, my stock market models are universal, so the directions and turns etc should be applicable to the Nifty.