

Over the last 18 months, US equities rose on 80% multiple expansion and just 20% earnings, and they diverged from economic fundamentals.
 Source: Yardeni
Institutions were net sellers in this period whilst retail investors became the buyers, typically the ‘dumb money’ and a sign of a peak.

The carry trade ceased to be fuel for higher prices.
Source: John Kicklighter
Instead, retail investors went all-in on bullish equities allocations and then leveraged up in a major way, to propel equities higher.

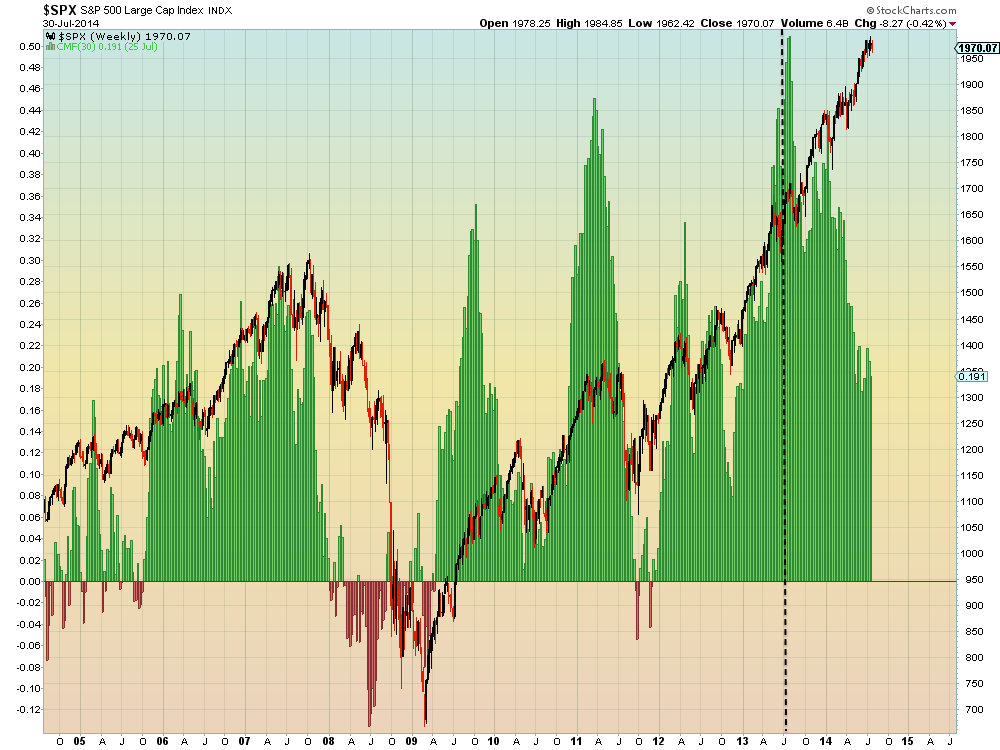
Source: Stockcharts
Source: D Short
 Source: Sentimentrader
We see a trend of distribution in this period, both in major accumulation days (just 1) versus major distribution days (12) and in Chaikin money flow, which suggests underlying building smart selling pressure.
 Source: Ponzi World
In short, the stock market mania of the last 18 months has been fuelled by the retail crowd and their credit facilities, not manipulated by the big institutions in some sort of cartel as some suggest.
The whole process can be explained by the rise into the solar maximum, driving people to speculate.
The process is mature and here in mid-2014 we see a range of indicators suggesting termination:
1. The best performing asset in 2014 is treasuries.
2. The best performing sectors in 2014 are utilities and healthcare, the defensives that typically outperform post market peak.
3. The hot speculative targets of Bitcoin, social media stocks and small caps all appear to have topped out, with Biotech a question mark but having made no progress since February.
4. Margin debt has also made no progress since February, which remains the peak.
5. Divergences have grown in breadth, sentiment and risk measures.
6. Volume on down days versus up days resembles previous peaks.
7. Sornette bubble end has flagged and extreme Skew continues to warn of a big move to the downside.
8. The smoothed solar maximum appears to have passed around Feb/March time.
9. Valuations have reached dizzy levels, with the median stock average valuation higher than in 2000 which was more concentrated in tech stocks:

Source: Hussman
Turning to the short term, yesterday was another record ultra low volume day. Also, $SPY remained in a 1 cent range for 18 minutes, almost dead, beating a Nov 2006 extreme of 10 minutes. Indices went nowhere overall, so we roll over to today. Geomagnetic disturbance is underway.
To sum up, my bottom line is this. Whatever research angles I collate always point to the same: a comprehensive multi-angled case for a bull market peak, and not just a peak some time soon, but the last gasps of a peak that has been in progress all year. We can argue over select indicators and doubt them individually, and no-one can avoid confirmation bias. But the breadth of the indicators and differentiation of the angles make for a multi-way, cross-referenced set that is surely something objective and compelling. The evidence just does not support a bull market continuation from here nor a parabolic blow-off top from here. The evidence says we should collapse any moment, not just into a correction, but into a devastating bear market with all that retail leverage and skewed allocations unwound in a very painful way.
Clearly price is all that ultimately counts, and therefore you should maintain a healthy doubt about my case until price proves it. But, rightly or wrongly, I still think this is it: the stock market mania began 18 months ago; risk peaked 31 Dec 2013; the solar max, margin debt, hot sectors and indices peaked Feb/Mar 2014; and the last phase of the top was July/Aug with the Sornette bubble peak, European indices peaks and US indices peaks. I believe the current ultra-low volume double tops / marginal higher highs on negative divergences in Dow, SP500, JNK and IBB will resolve to the downside, and the devastation be reaped in September and October.

John, thanks very much for all your exhaustive and detailed analysis. Does your data automatically include capital inflows from outside of the US? Martin Armstrong on his blog (http://armstrongeconomics.com/armstrong_economics_blog/) argues for higher prices on the grounds that the US Share Market is now about the last place left in the world for some safety and yield.
Please will you give us your thoughts on that. Thanks.
US is relatively stronger economically at the moment, but the flip side is it is one of the most expensive stock markets in the world by CAPE.
As mentioned before the lunar cycles on many levels are in the last phase; technically into November, but already showing weakness reflecting the coming turn.
The combination of John divergences (down) with the lunar cyles (up) could very well explain the low volume, low volatility, uninspired market this year.
The Uranus cycle (I know; something completely different) suggests trouble for the next four years and I calculated the midpoint for oct 12 2014.
Four years down in Uranus reflects the 4-something year lunar cycle. Is that coincidence?
So one scenario could certainly be that we have 6 or 7 weeks left for a crash like scenario in October.
Lastly; markets tend to set a top around the annual venus/Jupiter conjunction. This is not a precise timer, but over the years the correlation is remarkable. This conjunction was aug 18, suggesting we are now in a topping phase.
In short; I think John is right 😉
Armstrong has a panic cycle marked for week of Oct 13 (as of 8/19/14)and still showing is as of 8/26. Hmmm…
thanks, Andre. Always appreciate your posts.
thank you Andre
I see silver it talking to us this morning. Hope it doesn’t get beaten up for standing up.
I fail to see why all the fear surrounding gold and silver the past few weeks. Both look extremely positive to me.
I believe they are setting for a major upside move.
This one of the most bullish charts I have seen in recent memory
http://stockcharts.com/h-sc/ui?s=$SILVER&p=W&b=5&g=0&id=p79237381199
Allan,
A few things of note 1) If the markets correct hard, gold and silver stocks will go with it 2) Armstrong’s computers now projecting gold to $1000 eta Feb/Mar 2015. MA says gold won’t rise substantially until fall 2015 when SDC implodes 3) charts for all still in down trends and not oversold enough for even a Dec 2013 type bounce 4) See McC link
http://www.mcoscillator.com/learning_center/weekly_chart/fishing_around_for_a_gold_cycle_bottom/
Thanks John.
The DAX has strongly rejected its 50/200 DMA this morning and it would appear that we destined for a “golden cross”.
Don’t underestimate the cross as a strong bull/bearish signal. It has been 2 years since the 50 was under the 200 for any extended period and this will definitely be being watched by many martket participants.
The DAX is most asuredly leading the global trend and the tide is turning and becoming more bearish with passing time.
You can be proud John for standing your ground and having the courage of your convictions.
Cheers
Appreciated Allan
I see futures are down … Kind of oversold. Looking to go long SPX.
I’ve been long gold and silver miners since July 16th….a touch early but nothing new for me. EXK, MUX, GPL, LSG IAG
The story may provide levity: http://forexkong.com/2014/07/16/kong-buys-gold-and-silver-miners-galore/ as I question if “mining” is actually a part of our genetic makeup.
Scuze the link if it’s a bother.
I’m with ya on this one Kong. i’ve been accumulating Oz miners particularly for several months. Many miners are at valuations far under the bear market low in gold back in 01.
Anyone buying the PM miners in any quantity at these levels is going to be worth a fortune in 3-4 years.
It is a no brainer as far as I am concerned. i have been involved in markets in some capacity for over 30 years and I have NEVER seen a sector more despised and down trodden than PM’s miners have been the last 12 months.
Its unreal how beaten down….and how long this turn / in Pm’s has gone on.
Understanding The Fed’s masking of dollar devaluation, the naked shorting in the paper market, the divergence in physical etc…I guess it’s gone along with the rest of this “entirely cracked market” this past year so….to have survived and now look to jump on these lil miners? Fantastic.
why buy the miner when you can buy the metal?
Because the miners are much MORE leveraged than the metal? 🙂
This site has gained quite a following judging from information and comments from new posters. John, thank you seems inadequate. I realize I’m ‘over the hill’ as I could NEVER gather the the information you share with us on a daily basis. I mean I would not know how to even access all the sources you cite. While I have some time and space on this blog, I am excited to see Andre’s passion for his astronomical gravation work as well. Andre your motivation is also quite an inspiration.
In another vein, I wanted to thank the poster who reminded us of Carol Mull’s take on both McWhirter and Williams. I broke down and purchased “Sirius” software and
have been getting my money’s worth. (I’m not getting any money, etc. and this is not a ‘plug’.) I looked around and just felt it would serve my needs as opposed to the other programs that seemed to focus on short term trading ideas.
Sirius allows me to conduct exploratory research (test for evidence and consistency) based on the epistomology of astrology: finding a natal chart for the market, stocks, or commodities; along with testing other theories in the literature.
An idea that seems to have merit is
* finding the true natal chart for a trading instrument,
* placing the position of the planets at the ‘new moon’, ON THE NATAL CHART, and
* using Williams scoring method for assigning net value to determine direction.
Thank you for all your contributions.
Thank you eclectic
I luv luv luv these types of articles. There has been a plethora of super bullish articles hitting MSM in the last few weeks.
Believe me folks the big wants out and they are offloading onto the sheeple at every opportunity.
http://finance.yahoo.com/blogs/talking-numbers/new-study-provides-fresh-evidence-that-stocks-will-soar-this-year-205823921.html
Its not all one way though Allan: http://www.telegraph.co.uk/finance/markets/11059951/Markets-could-be-heading-for-scary-60pc-crash-warns-analyst.html
And according to the UK’s leading spreadbetting firm, 81% of Dow bets are short.
Thanks Mark. Tells me the contrarian bet is long.
I wholeheartedly agree with the above comments on PM mining shares, and have also been buying them. But in the short term we need to bear some facts in mind…
Retail spreadbetters (at the UK’s biggest firm) are:
– spot gold 95% long
– spot silver 100% long
-GDX 99% long
– JNUG 91% long
I think we’re looking at a weak period for these until Q2 2015. If so, that will mean more buying opportunities.
I wonder if that would be akin to waiting to pick up nickels in front of a steam roller? The big moves come when you least expect them… I’ve been “fortunate” twice at the secular lows – each time the crowd was expecting yet another “C leg” lower. Sometimes you just have to accumulate and wait patiently imo.
Long SPX 1991
Curious Duncan….via what instrument? And for what potencial price target?
Speadbet – dec contract.
Added long again. Looking for bears to hand control back to bulls in a couple of hours.
Target 2010 initially
Well played.
Stocks down and gold up seems to be finally modus operandi. There is huge amount of short stops in gold in 1320-1340 area, best scenario for gold is gap up on Monday, taking all these stops. My target for S&P in this move is at least 1800-1820 area.
According to Andrew Smithers http://blogs.ft.com/andrew-smithers/ the only group which has been buying stocks on net has been corporates buying-back their shares. Does your data include that group of buyers? Smithers doesn’t see a significant downturn in the stock market until those corporate buyers stop (they’re slowing their buybacks now, but are still net buyers). He points out that this is the source of the earnings growth we’ve been seeing as corporates borrow short term at near zero interest, allowing them not only to buyback their shares at very low cost, but also to boost dividend payouts to shareholders, making them more attractive to the public. At the same time, the reduced float ups EPS.
He points out that had they used that borrowed money to invest in plant and equipment, it would subtract from earnings, rather than adding to earnings growth. Most compensation for corporate leadership these days comes from bonuses which are based upon share price rises.
If we get a decent correction, those treasurers are likely to greatly step up their buying.
—Bob
as I said yesterday – TLT and the confidence indicator JNK:TLT
http://stockcharts.com/h-sc/ui?s=JNK&p=D&yr=0&mn=6&dy=16&id=p73886382909&a=357560080&r=1409235367670&cmd=print
this is the start of the reassertion of the secular bear that never went away…hold on to your myths and fantasies and your young children as you board the life boats…LOL
Crude oil has been range trading for the last 3 years. It’s approaching support and a weekly buy on DeMark. Inside day breakout plus another consolidation inside day breakout on the October contract.
Might serve as an imperfect hedge for those currently short US indices (like myself).
John, that Yardeni chart is gold. Thanks!
ignore todays tyx move at your peril! – the life boats are filling up. hurry now…
http://stockcharts.com/h-sc/ui?s=$TYX&p=W&st=2011-11-01&en=2014-08-28&id=p93251537240&a=352286267&r=1409238043388&cmd=print
In the context of Ukraine, a very
mild reaction so far.
Looking for a close at or above SPX2000 today.
the news will have nothing to do with it – selling will simply take -place as there are no liquidity factors left to fuel buyers. 5 sellers per 1 reluctant buyer….
Welldone John, the only divengence with you is that I mantain that a prior correction might be on the way in sep-oct´14 in the DJI, about 8-10%, before the large decline, at least to the end of 2015 or beg. 2016, hand with hand with the EURUSD parity, target circa 1:1, as commented months ago.
Only a geopolitical event could rush the decline process in the short-mid terms.
Regards
@apanalis
Imho John underestimated the probability that the U.S stock market might be sitting afloat, or staying within a tight range, for another 18-months, even if his analysis was flawless.
Look at the low volume of the stock market. From a bear perspective, it might mean no enough buying power. But from a bull perspective, it might mean nobody wants to sell high. Anyway, both are right.
the fact that no one has actually deleveraged during this whole OZ charade will force sellers into the market to first cover and then just to live…
Lots of second chances to short this market indeed.
I think second chances are rare, so I can’t help but conclude that we’re not ready to go down just yet.
http://stockcharts.com/h-sc/ui?s=HYG:TLT&p=D&yr=8&mn=3&dy=0&id=p75497479647&a=360644868&listNum=4
this is just another way of looking at the TYX chart…good luck to all who ignore this indelible market mark – lol
It’s weird to compare HYG with TLT. The former has holdings with “Average weighted life” of 4.23 yrs, while the latter 25+ yrs. They are quite different things.
Technically, I suggest you compare HYG with 5-year treasury notes. They are more comparable. But I guess you could get a very different chart.
this is why it is like TYX chart and why you should serious look at how they both correlate to market tops before deciding they are mismatched in the ratio
by the way, michael, you seem to miss the point of a RATIO in your comments…
Excellent chart!
divergence in nya and spx
http://stockcharts.com/h-sc/ui?s=$BPNYA&p=D&yr=0&mn=11&dy=0&id=t70964708876&a=361894905&r=1409245202900&cmd=print
shows the support Duncan is trying to trade but look at the divergences!
http://stockcharts.com/h-sc/ui?s=$SPX&p=D&yr=0&mn=11&dy=0&id=p02078185375&a=362736286&r=1409245681491&cmd=print
Very good 🙂 … and also happens to be the ‘old’ high.
ahhh but the Law of Matched Time says ITS OVER
http://stockcharts.com/h-sc/ui?s=$SPX&p=M&st=1991-03-01&en=2014-08-28&id=p80834704077&a=302646600&r=1409247647408&cmd=print
yes excellent charts TY
This week was less likely to see significant
downside with such low trading volumes.
Direction may become clearer next week,
it still appears upwards is the path of least resistance,
however appreciate that this can quickly change.
At the time of this post the SPX is barely unchanged,
I have remarked on the resilience in US markets
many times before, the bulls have controlled the summer.
all tops appear as not likely to occur within the readjusted kin of the non-experiential reality of the video game. that’s all this is folks. a video game…same with your politics, culture, news, art. A VIDEO GAME! Life is youtube to most and can be held in their hands. THIS IS NOT DIRECT EXPERIENCE and that is why the panic is baked in.
If you are saying significant corrections can
appear when the consensus is taking the opposite
side, then I agree.
John, thanks very much for all your exhaustive and detailed analysis.
So far the pattern has done a very good job at predicting the moves. It said the sell off to the 1904ish spx level was an abc correction to be followed by new highs.
Now the pattern says we get a wave 4 down followed by one more 5 legger up. When the next 5 legger up is compete, we should see some serious fireworks to the down side. Sometimes the last 5 legger up will end in a failure. Meaning it won’t extend to the price level we might expect a normal wave 5 to achieve. So the last leg up may or may not be as strong as normal. 2022 spx might be considered “normal” for the next, and what should be, the final 5th wave up.
Thanks again John.
thanks Marvin. what is your target for the wave 4 low?
look at Denaric’s charts – but I dont think that count is accurate or applicable here
I have not looked at Dan’s charts for a while, but the wave 4 is sometimes often drawn close to the wave 4 of previous degree ( which is 1984.71 in this case) and it often gets there in double dip fashion. So we have seen one dip to 90.46spx. If we get another to 1985ish area, then we might expect the “b” of 4 bounce to achieve a level near 2000 spx. If this bounce stops in the 2000spx area tomorrow, and then we see a rapid linear sell down to 1984-85 in a 5 leg move, we should buy it right there to catch the 5th wave back up. It is hard to say where the 5th wave will die out, especially when the wave 4 down may not even be complete yet. But if I had to just make a stab at it, 2023ish might be pretty close.
A wave 4 can do a single dip or it can do a double dip. It has already made one 15 point dip to 1990.46ish spx. It is possible that this 15 point dip was the entire wave 4. However, because it was so shallow, I would lean toward a double dip in this case. If it starts down for a second dip, then subtract about 15 points from the last high to get a close target. So if it popped up to 2000 and then started down, We might expect 2000 – 15 = 1985ish. And we know the second dip will be very sharp, probably unfolding as a 5 legger “C” wave. That low ( what ever it finally settles on should be bought for one more leg up. But since the final leg up can be a failure, we should buy it with only 1/2 a normal position and keep a loose, but running, stop below it. As crazy strong as this market has been, it may not fail, but better to be safe than sorry.
The pattern offers two possibilities after this top is in place. A drop of 400 to 600 points followed by another strong leg to new all time highs, OR a sell off that will likely drop below our 666 low of 2009. Based on all the evidence John has uncovered, I am leaning toward a sell off to 666 or lower to be drawn out over about 2 years in time. It should be a killing for the bears.
thanks Marvin
Appreciated
Still looking for that close at SPX2000 or above
S&P was not even able to close the gap. It looks fuel is spent..
http://stockcharts.com/h-sc/ui?s=$INDU&p=D&st=2014-01-01&en=today&id=t38558242310&a=349432988&r=1409246926310&cmd=print
Alexa, whilst PM stocks may repeat the past amd go with the broader market, that does not necessarily have to be the case.
Gold in recent weeks has shown strength on stock market weakness. I happen to believe that gold and silver may in fact be a huge beficiary of a market collapse as it was in the 87 crash.
As far as Mr Armstrong goes, he is good but not God and not perfect.
Gold stocks look bullish, they are leading, that is always a good sign. Both the charts below look very bullish to me.
PM’s and their stocks may be the biggest beneficiary of a broad market collapse here as investors scramble toward a safehaven and the only sector that has not been the subject of over speculation the last 2 years, in fact quite the opposite.
http://stockcharts.com/h-sc/ui?s=NUGT&p=W&b=5&g=0&id=p18120466082
http://stockcharts.com/h-sc/ui?s=GDX&p=W&b=5&g=0&id=p28881775635
http://stockcharts.com/h-sc/ui?s=XLY:TLT&p=D&yr=0&mn=6&dy=0&id=p21228663186&a=348013936&r=1409257162851&cmd=print
http://stockcharts.com/h-sc/ui?s=XLY:XLP&p=D&st=2010-12-19&en=2014-08-28&id=p03756905430&a=361891764&r=1409257337824&cmd=print
http://stockcharts.com/h-sc/ui?s=XLY:XLP&p=D&st=2013-09-13&en=2014-08-28&id=p03756905430&a=361891764&r=1409257337824&cmd=print
elvis your charts are awesome
http://stockcharts.com/h-sc/ui?s=$TRAN&p=D&st=2013-12-31&en=2014-08-28&id=p37370892452&a=301959649&r=1409258520591&cmd=print
this one is pretty interesting – bounce or die as a friend of mine says! lol
Looks like a parabolic move may be building here
if buying is combined with volume next week.
Some of the remaining bears risk being pulverised,
reversal possible but looking increasingly unlikely,
just in my view.
My indicators are showing higher in the short term. But the best way to describe the S&P is a clapped out car, running on little fuel, with three wheels, smoke coming out the engine and heading straight for the cliff!
Overnight strength in futures point to consolidation (triangle) possible in S&P before final and short burst and subsequent reversal next week.
On the other hand it can be fully retraced even before cash market starts so does not change overall wave pattern. S&P top in 2002-2008 range seems plausible. Good opportunity to accumulate long positions in gold at 1285 – 1290 range.
I hope so as it would suit me,
however the strength of this bull
has been continually underestimated.
It has not sense to compare economic indicator with price action… charts resulting in a wrong and distorted perspective.
I laugh when I read price are not driven by istitutional (we all knows everything is piloted by FED, dark pools and majors hedge funds controlled by big banks).
For the rest we all agree that this is a giant bubble that covers bonds and stocks Worldwide. Bond market or stocks will collapse. Or maybe both? It will depend on what will be the trigger, interest rates or geopolitical events.
A big bet: long commodities plus short (bond + equity).