
Here are some of the all-time records delivered in 2014:
1. Highest ever Wilshire 5000 market cap to GDP valuation for equities
2. Highest ever margin debt to GDP ratio and lowest ever net investor credit
3. Record extreme INVI bullish sentiment for equities
4. Record extreme bull-bear Rydex equity fund allocation
5. All-time low in junk bond yields
6. All-time low in the VXO volatility index (the original Vix)
7. Highest ever cluster of extreme Skew (tail-risk) readings in July
8. Highest ever Russell 2000 valuation by trailing p/e
9. Lowest ever Spanish bond yields
10. Lowest ever US quarterly GDP print that did not fall within a recession
And this week:
11. Lowest HSBC China services PMI since records began
12. Lowest ISE equity put/call ratio since records began
What I have been pondering is, what are the chances that we see not just a market crash but an all-time record market crash, given the elastic band is more stretched than ever?
Here are the biggest crashes in history, covering US, UK and Japan stock indices:
2011 August world indices
2010 May flash crash US
2008 Sep-Nov world indices
2001 Sep FTSE
2000 Mar-May Nasdaq
1990 Feb-Apr and Jul-Sep Nikkei
1987 October world indices
1929 Sep-Nov Dow
1907 Feb-Mar, Aug-Oct Dow
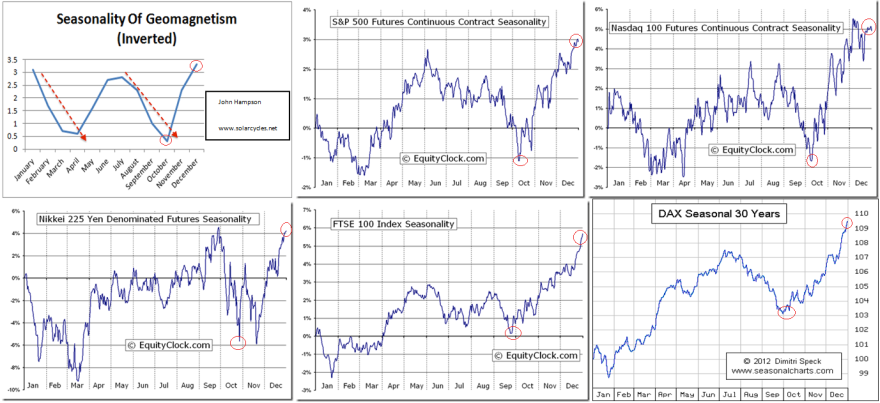
Draw them together and all the crashes happened in two windows in the year: Feb-May and July-November, with the latter period being the most dominant. This fits with the seasonal model of the stock markets, where geomagnetism influences collective optimism and pessimism. The two red dotted lines show the scenes of the crashes, both running from peak optimism to greatest pessimism.
 What also unites those historic market crashes is the preceding extremes in valuations, sentiment, leverage, allocations and complacency. The current US stock market set-up is a mirror in all those regards and global stock indices appear to have finally rolled over in July as we entered the most common window for market crashes. So it is fairly clear that we have a crash ‘set-up’ if not a crash.
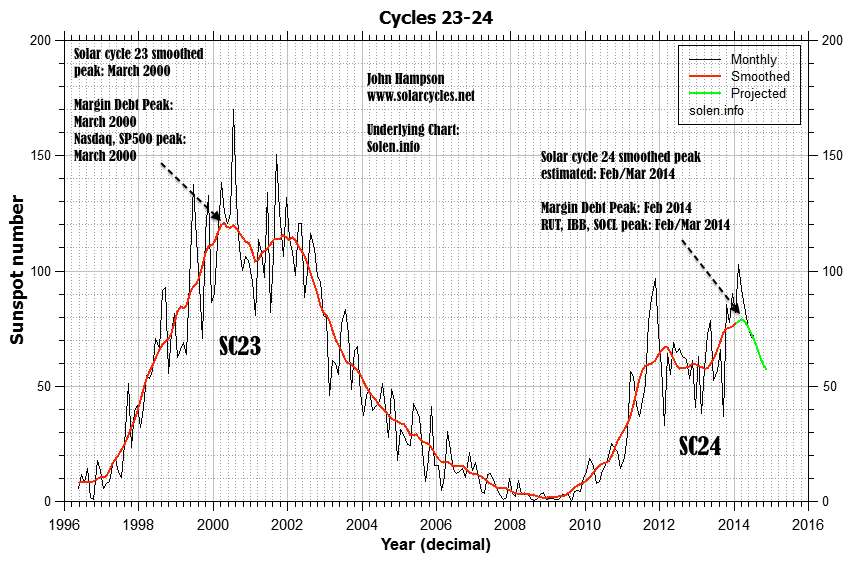
Additionally, those crashes of 1907, 1929, 1990 and 2000/1 took place in the waning of the solar maximum, with the sun first driving the speculative mania to achieve the extremes and then pulling the rug from underneath. Based on the latest solar data, we appear to be a similar position now, i.e. through the smoothed solar maximum.
To realise the biggest crash in history we would need to see the market halve in value in this window between now and November, which would mean the SP500 dropping to 1000 to August 2009 levels, i.e. the majority of the 5 year bull wiped out in a couple of months. That sounds utterly crazy, yes, but at the heart of a market crash is panic selling, whereby the selling reaches sufficient momentum to bring about a critical mass of forced redemptions and rapidly unwinds all the leverage. Sell levels trigger further sell levels and the process becomes unstoppable and out of control until exhausted. Given we are in many measures at the extreme of extremes, that process of exhaustion may cut deeper.
Amongst the historic crashes we see a cluster of big down days occurring on Mondays and Tuesdays (after weekend worrying) and close to new moons and full moons (at sentiment extremes). Also the waterfall selling typically erupted with the breaking of a notable technical support level following the passing through of a second chance peak (a failure high). I have argued that we have passed through the second chance peak as evidenced on RUT, IBB and SOCL and behind-the-scenes indicators for large caps. If I am wrong about that and large caps need to yet rally up again to a lower failure high then it would delay the initiation of the panic-selling. If however I am correct then the panic selling should be close at hand and we might then look to these possible dates for initiation, based on those historic patterns:
Mon 11 Aug, 1 day after full moon
Mon 25 Aug, new moon
To sum up, IF we were to experience the worst market devastation ever, then the set-up that we have would be pretty ideal for it, namely all-time extremes in valuation, sentiment, leverage, complacency, cross-asset valuation and allocations, the waning of the solar maximum, and the period of the year July-November. Initiation for waterfall selling could potentially trigger around one those August dates.
I am not peddling fear, I am just drawing together the common themes of historic crashes and pointing out how we fit in. We fit in well, so we need to consider the range of potential results. I am not predicting the worst crash in history, but I am predicting there will be a period of waterfall selling at some point to wash out the leverage and I see no compelling case for that episode to be mild and anomalous compared to the others. We are flirting with deflation and nominal values are therefore at greater risk. Therefore, considering the possibility of the worst ever crash does not seem inappropriate.
Would central bank reactive measures nip a crash in the bud more easily now? These crashes all happened quickly: between 1 day and 8 weeks. That doesn’t allow them to do much. Would circuit breakers and exchange closures alter things now? They may cap the devastation on any one day, but spread it out to the following days or weeks. Might any crash be restricted to the hot targets of RUT, IBB and SOCL? It could be worst there, but unwinding leverage should affect all assets. Could any crash and unwinding of leverage be postponed until 2015? I can’t rule it out, but it doesn’t fit with the patterns in those historical mirrors. We could look to the end of October 2014 as a marker for that: if hard falls have not erupted by then, the likelihood would transfer to such steep declines not occurring until the Feb-May 2015 window.
Turning to the near term, yesterday’s bounce was in line with indicators, and sufficiently contained to be no real threat to the bear case so far. I have no expectations for today but want to see the markets turn down again into the coming weekend’s full moon. If I am correct about our positioning post-second-chance then essentially we should see bears resume control quickly. Another two day’s rallying from here, clawing back much of the 31 July falls, would not be in keeping with that.

Interesting; thanks.
John, some analysts say markets need to synchronize to show a major reversal. Up till now we haven’t seen this. Europe, Dow and s&p all showing different timing in turns. My Gann timing points to November for the most significant synchronization of timing.
How do you look at this?
Neither of the last two major peaks saw all indices topping together, and I don’t have a case for markets peaking in November.
Great analysis as ever John.
Ty very much!
Something to keep an eye on:
http://www.marketwatch.com/story/weidmann-jockeying-to-replace-draghi-at-ecb-2014-08-04?dist=beforebell
Thanks, John, thus, your 1st target for the S&P is +-1000 and for the DJI +10K, about -0,618fib, but you expect a more significant plunge, below march´09 lows in a wedge pattern about 5K DJI?
And for the 1st decline do you expect it for oct-nov´14?
My 1st target for the DJI is the 200MMA, about 11-11.8K, like 1980-82 S&P pattern, but I consider other scenarios like after 1909-16-19 pattern, driving the DJI to -0,76 retracement , 7-8K near 2002 lows, even 2009 bottom.
The last scenario is the 5K with the wedg pattern.
Time will tell
Thanks
@apanalis
1000 S&P is not my target, it was to shows what is needed to be the worst crash in history. Generally I expect a period of waterfall declines between now and November, and drawing on the historical analogs, those declines should exceed 18%. Thereafter I expect a multi-month partial retrace of the falls.
Mine is a similar DJI structure 2007 and 2011, so i expect a fall roughly 8-10% this summer and retest prior highs, dont´t know if surpass them or not, but 17K is a great reference to be short with ETF (for me)
European mkts and Russell are leading this top process and regard EURUSD parity. My personal target is 1:1+- at the end 2015 beg ining 2016.
On the other hand, John, I remind reading you, abou the wedge pattern drawing a roughly target 5K DOW. is it correct? Time-frame, please?
Nothing is impossible, but I think is not time to, yet, in current 17-years-cycle, must wait +- to 2023 after a parabilic rising process to the historical climbing, more powerfull than 1923-29, similar to the 1720 crest, prelude to the end of Capitalism, similar to the end of mercantilism.
For this enviroment is necessary +-300 years cycle.
For a standard depression is about 90-100 years, but this is not the case, yet.
Regards.
@apanalis
While I can’t point to tangible statistics, my hunch is the change in how banks operate as market makers and their retreat from this role, will play a significant role in the crash scenario that John envisions. A liquidity “failure” will cause investors to panic when they see market depth is a mile wide and inch deep. This applies both to the bond and stock market, and the panic may very well start in the former.
If the market was run by graphs, charts, fundamentals, etc…then we would be crashing. Unfortunately, the market is run my human psychology, which includes greed, naivety, and plain old irrationality. Hence the expression, the market can remain irrational longer than you can remain solvent. If the market was run by the terminator robots, then we would have a steady freddy market flat for years with no bubbles, maybe gaining 2 percent every decade.
Nigel,
That’s why you’re at home here. Site is called solar cycles and is mainly about natural forces affecting human mood. Thank God the market is run by animal spirits; makes it predictable.
Cheers,
André
That’s a timely reminder Lord Nigel – one which everyone would do well to bear in mind! All markets are driven by players trying to take money from each other, by continually creating new ways of out-foxing the opposition. All of these indicators are created by the market – not the other way around.
The sun is showering us with energies, and the moon will be modulating them during the next 2/3 years, in ways that none of us have experienced before. This is a time to expect extremes. If historical extremes were never exceeded, then the Dow would still be under 5. If it were never “different this time”, then we’d still all be waking up in caves, and spending our days throwing sharpened sticks at warthogs!
What I find especially fascinating in this remarkably succinct analysis is the enormity of the extremes we’ve reached with little systemic awareness of the extremes. This mirrors the housing bubble in 2007 when liar loans and interest-only loans predominated, a clear extreme of risk, yet few saw anything amiss in the complete destruction of prudent lending standards and the massive incentivization of leveraged bets via fraud. In other words, the psychology of a set-up for “unexpected” collapse is near-ideal.
That said, I think it likely the open gap in the SPX at 1965-1970 will be filled and perhaps exceeded. I hope it runs back up to double-top at 1991 or even carves out a nominal new high, as that would make a very nice entry point.
Truly phenomenal analysis, John–thank you for sharing. I just forwarded to 3200 twitter followers.
Thanks all
It does seem as though these positive economic report headlines and profits are keeping folks all in as many believe in the recovery. It seems like not many people dig deeper to find out that companies buying their own stock at record levels at the same time insiders are selling at record levels. Just the type of setup market makers need to pull the rug out and leave retail as the bagholders once again…
Forwarding to many other followers could also have an impact this time around if enough people react to your news John. Algos do parse out info from tweets, posts, and MSM articles.
What should one do when cold hard dispassionate reason comes to seemingingly irrational conclusions, like 1000 on the S&P in short order? It reminds me of in the movie Patton, he says the German’s haven’t launched a winter offensive in a 1000 years, therefore I think they will do it. The battle of the bulge ensued. Quotes from memory. HMS Stalwart Dreadnaught, aka John Hampton. Great work John.
The range per Peutz’ crash cycle is for the top to be from two months before the lunar eclipse to one month afterwards most are right at it. Oct 8 is the next one. 1937 isn’t even listed on Puetz’ crash charts. However the Dow fell from 190.38 on Aug 14th, 1937 to 112.54 on Nov 23rd, 1937. Lunar eclipse, Nov 18th, 1937.
I must have been typing during your comment. I think my comment still adds to the discussion. Great minds and all that.
Interesting John. I’m an Astrologer. The Aug 25th date you mentioned has Mars conjunct Saturn in Scorpio, a war aspect, and is 1998 days from the March 6, 2009 low. That low, as we know, was 666 in the SP500. 1998 = 666 * 3..
Yellen gives her Jackson Hole speech on the 22nd, so there is a potential catalyst around that time period as well.
how will gold and gold stocks do if we have this crash ?
Million dollar question. Quite possible they will sell off also; as liquid assets they are likely to be used to meet obligations elsewhere.
yes quite possibly, although contrary to 2008, gold stocks are pretty much bombed out already and have not participated in the bull market over the past few years, so who knows ?
gold moves opposite interest rates as well as deflation…gold going up is contrary to demographics…
Hi John
If we are going to talk about crashes i want to remind readers that they often occur during what Steve Puetz called “crash windows”. They occur 6 days before to 3 days after a full moon within 6 weeks of a solar eclipse.
This year there will be a solar eclipse on my birthday 10/23/14. There will be a full moon on 10/8/14. Therefore the crash window would be 10/2/14 – 10/11/14.
Mastertiming (Gann) gives October 9,10,11 and 12. This is based on the most significant turns in US and European markets in the last 15 years. Usually clusters of dates so close have a special meaning. Funny how that coincides with your dates!
John,
Thanks for your analysis. You’re ongoing analysis has significantly added to my direction and encouraged my own independent study/modeling. Specifically, in the above piece: “Amongst the historic crashes we see a cluster of big down days occurring on Mondays and Tuesdays (after weekend worrying) and close to new moons and full moons (at sentiment extremes).” Separately, I still struggle with understanding geomagnetism (data to use/interpret/model), but I’m making progress. Thanks for all your help.
Dax is 9% lower from is high…nasdaq100? just 3%… Its not a general sell-off
I’m waiting manipulators to reverse its position (long ndx + short indu/spx).
Nasdaq is the easiest to guide for these guys
No crash yet but markets are now very shaky. Poland warns imminent direct Russian involvement on Ukraine. Looks like Putin had enough.
You would think learn a 100 years on.
http://www.bloomberg.com/news/2014-08-05/poland-warns-russian-troop-buildup-may-signal-invasion.html?cmpid=yhoo
Nice work John … even Buffet doesnt want to buy this market: http://www.thinkadvisor.com/2014/08/04/warren-buffetts-huge-pile-of-cash?utm_content=buffer0a69e&utm_medium=social&utm_source=twitter.com&utm_campaign=buffer
Still think we make a short term low this week, then onto new highs into later this month / early September.
Don’t forget…
http://time-price-research-astrofin.blogspot.com/2013/12/geocentric-and-heliocentric-bradley.html
Best also to look at a multi year bradley chart to get the intensity in sinusoidal change…10 year image…ones to 2020 exist out there to forecast amplitude…

Thanks for all the comments
End Of Days for US and EU and World Economy total economic crash predicted by Geneva by BBC UK 10:14am, monday July 21 2014 from london UK End Of Days for US and EU and World Economy total economic crash predicted by Geneva think tank headed by Arthur Swenson depression 20x worse than 1930s. A Think tank in Geneva tracked Dr Swenson. Stated World Economic downturn 20x’s worse than Great Depression to start in Fourth quarter of 2014. Peaking in 2015 and lasting till 2017. Money will have no value all basic sevices will be off, you will have to be prepaired to ride it out. Geneva think tank states comoditys will be the currency during this Depression the likes of the World has never scene. Arthur Swenson states the best things you can do to ready yourself and your family are.Buy all the Silver you can untill end of2014 to retain some wealth. Find a small home or peice of land in an unpopulated area if you can not buy a small home put a camper on the land and drill a well have a pump. Things you need a generator and fule to run the generator 6 hours a day for 2 or more years. Buy a ham radio (there will be no internet)buy 2 or more guns and cartriges 300 or more each. Stock pile canned/dried goods and everything else you would need. Put togeather a medical kit with antibiotics and a medical referance book plus instuments. (there will be no emergency rooms in operation)Also have packs of seeds to grow squash is easy to grow as is Swiss Chard and beets.Have a 4 wheel drive car and extra basic parts for it most importsnt a battery, and 2 100 liter drums of fule for the car incase you need to get out of the area your in.REMEMBER thoses who did not plan will attempt to steal from your and your family and group. If desperate they may even attempt to kill you trust no one outside your group. Over a million Americans Have Been Making ready to survive in isolated areas. They are stockpiling Supplies to last years. The 3 best spots to build a secrete refuge are Montana Vermont and Colorado. Anyone who fails to prepare is going to not weather the Economic crash. Predictions range from Other think tanks. 2012 to 2016. Genius DR. Swenson predicts April 2015 as the final collapse thats the date Americas debt interest will equal the GNP product but fast downturn will start Fourth quarter of 2014. Swenson states I started hoarding supplies last year and expect to have 10 years worth at My Vermont refuge.
Hi Will. I would like to follow up on this information. Any source info?
SPX has made 5 waves down as of Tuesday. It is right at the channel line support (decision point). Does it put in a small wave 2 up or does it head back to retest the top in a wave 5 of 5 which would push the next drop out into September or October.
http://danericselliottwaves.blogspot.com.au/2014/08/elliott-wave-update-5-august-2014.html
Lunar trends.
Looking just at the moon instead of looking at tides you can see some remarkable things. For this analysis I look at the average distance of the moon, so (apogee+perigee)/2.
This give 3 different trends:
1) yearly trend from the lowest to the highest reading or visa versa
2) multimonth cycles , 3 – 6 months
3) biweekly apo peri swings.
Beneath that we have the multi day tides.
In 2014 : the smallest distance of the year was between jan 30 and feb 12. This should give a yearly low in the market. And in February we did see markets starting a recovery. The highest reading this year is between November 3 and 15; suggesting a high in the market can be expected.
From roughly the end of march till mid august distance was decreasing, meaning downward force in the market. As the yearly trend towards November is still up, this down trend didn’t give a high until july as the highest absolute reading came july 28 (highest apogee). But then things collapsed as the multi month trend was down towards august and the highest apogee was set.
What does this mean ? August 10 the moon is at perigee and turning. During that turn, the multimonth trend turns. And from that moment on we have 3 trends up all marching towards november. The flip side is that in the whole of 2015 we won’t see a reading as high as in november, also suggesting a major turn is scheduled in november. This coincides with mastertiming as I have posted earlier.
I realize this is a contrarian view. But I think it is always wise to have an alternative agenda.
This week 2 strong cycles are down. The tides gave a low the 4th, but are fighting a strong down force. at best this produces a consolidating market.
Cheers,
André
thanks Andre. Interesting method. For 2014, I added apogee distance to next perigee distance (divided by 2) and perigee distance to next apogee distance (divided by 2). Least distance 1/30 – 2/12 (381655 km) and 8/10 – 8/24 (381709 km). Actual low was 2/5 and we may be making another important low in the 8/10-8/24 time frame. Greatest distance was 4/8 – 4/23 (387132.5) and 4/4 was a high. There is a higher high 11/27-12/12 (387203.5). Are you expecting that time frame to be a high? Noting also that min perigee: 1/1 (356921) and 8/10 (356896) and max apogee 1/16 (406536) and 7/28 (406568) If you’ve looked back to previous years, I wonder if you’d share results? tia
Peggy
I do expect the end of November time frame to produce a high. I use tides for short term sharpness. Combined with the analysis above I can asses whether the tides turn with the trend or against the trend. This makes a difference for what indicator I use for timing. Did you see the extreme apogee 7/28? That triggered the current correction.
Many non gravitational things impacting tides, so extracting gravity form tides is complicated. But the moon is just gravity.
I did a multi year analysis. End of 2002 we had an extreme reading in distance and in 2003 we had a major down trend. Same end of 2006; 2007 was a major turn year. On longer time frames you can see 4 years or longer lunar cycles.
I read that the current market is one of the longest bull markets in history, but the apogee/perigee analysis explains everything.
Looking forwards, 2014 really looks like a pivotal year with possibly a bearmarket into 2018 – if we can trust this analysis. Every Sunday I post an extended analysis.
What is really interesting is that I combine this apo/peri analysis with Gann timing using major turns in the last 15 years. This gann analysis identified July and November as the most significant months this year. This Sunday I’ll get into this a little deeper. I appreciate your interest in this matter.
Cheers,
André
Andre’,
I appreciate your comments on combining different approaches (as a confirmation or triangulation). Specifically your comments on Gann, who I am trying to get my arms around. But Gann has so many different approaches and aspects, is there one specific area of research that you are referring to in confirming your Lunar approach? e.g. Sq. of 9, or planetary cycles of repetition, or law of vibration, or… I realize that they can all be used to reinforce the other. Thanks in advance.
SJC
thank you Andre. Interesting that you mention a downtrend into 2018 – having just compared souljester’s excellent comparison of 2014 top to the 1966 top – if the fractal follows a similar day count:
50% down by July 2015
double top July 2017
lower high Dec 2017
LL December 2018**
Market then rallies to above the DT (if Jan 1973 = July 2021) and then crashes to and lower and final low June 2023 (12/1974)
SJC,
I have a little software tool called mastertiming. It’s a free download. All I did was analyze the most significant turns in the markets. Every turn gives future dates for possible turns. If dates from different turns point to the same month, week or day, this becomes significant. So this is basically a square of nine technique. But with this tool you don’t have to know a lot about Gann. I am impressed with how it works. For July almost all significant turns were confirmed by this timing.
Cheers,
André
Thanks Andre. This is certainly something worth perusing as it compliments other types of analysis. Keep up the great work.
Chris
hi Andre,
using your perigee/apogee method and looking at end of 2014 to end of 2015:
11/27-12/12/2014 HIGH
2/19-3/5/2015. LOW
5/26-6/10/2015 HIGH
9/28-10/11/2015 LOWEST LOW
However, min perigee is 9/28/2015 (LOW) and max apogee is 9/14/2015 (HIGH). 2nd least perigee is 2/19/2015. Would you expect a low there and then a rally to 9/14/2015 and the a short downtrend to 9/28/2015?
Peggy,
Right now I am focusing on micro timing techniques to be able to tell the exact hour of a turn on the turn days. And I’m almost done. Will post about this shortly.
I promise you next weekend I will show a more detailed forecast for what I believe will be the cycle structure towards the next major turn (jan 2018).
In my post on the new blog this morning I made a remark on the lunar cycle and how this is confirmed by McHugh. So I really think we are on to something.
Cheers,
André
hi Andre,
Not wanting to clutter the blog with this – thought about intraday tides – would you em me at mjmateer (gmail). tia
I would suggest that the DAX is possibly just days away from multiple high triple digit losses.
Expect global markets to follow.
With seven months under our belt in 2014, the average U.S. stock is down. Down, as in not up. The median total return of stocks in the Russell 3000 comes in at a 1.7% decline this year, according to Charlie Bilello, director of research at Pension Partners.
Natural target for Gold in this rally would be 1490-1520 zone as very thin trading was done there during Gold’s crash in April 2014
Ditto Bunell. I too believe that the intermediate cycle low for gold has been complete yesterday, and up she goes from here. There is gradual process of liquidity leaking from equity to commodities the past few weeks, and this confirms John’s theory that the correction (or crash???) is just around the corner. Very much the same observation during the 2008 crisis.
My only concern is that gold/miners might go down with equities when the crash is initiates to meet the margin calls. But it shall fly after that pullback imho.
Gold target for September-November in the range of 1400-1500 seems reasonable, and falls within the gold cyclical bull trend.
big rally coming over several days, abc
Many in the camp of a-b-c corrective rally now and indeed it seems plausible. But I believe that this market will provide most of surprises on downside. Playing corrective moves in bear cycle is for sophisticated traders only.
will erving, lol, bet your a right laugh to go drinking with
http://www.priceactionlab.com/Blog/2014/08/no-correlation-between-a-rare-large-weekly-loss-and-market-tops/