
Firstly, the definitions of a bear market (20% decline) and a recession (two consecutive quarters of negative growth) are arbitrary, but a line has to be drawn somewhere. Secondly, there is a lot of misinformation spread about this question, so let the evidence speak.
This chart shows US bear market and recessions. Mainly they occurred together but we can see a couple of recessions without stocks bears and a handful of stocks bears without recessions.

Source: Ritholz
The deep recessions always correlated with a stocks bear and the deep bear markets always went hand in hand with a recession.
You’ll hear a lot that recessions cause bear markets, but quarterly GDP prints at bull market peaks say otherwise.
US quarterly GDP growth at past major stock market peaks:
Q4 2007 4.4%
Q1 2000 6.18%
Q3 1987 6.08%
Q1 1973 11.91%
Q4 1968 9.84%
Leading indicators can help us identify the onset of recessions ahead of time. The way it works is the economy does not roll over all at once. Certain activities peak first and others lag (e.g. firing and hiring is one of the last processes). These leading indicator indices identify manufacturing new orders, money supply and interest rate spreads amongst those first to diverge.
In the chart above we can see that CB and ECRI leading indicators have recently diverged from one another. CB is fairly benign currently whereas ECRI has turned negative.

The complete list of differences isn’t published. However, there are two important things to note. First of all, both use the stock market as one of their leading indicators: further evidence that it isn’t the economy that leads the stock market but the other way round. Secondly, all they are doing is identifying the first dominos to fall in a recession, therefore they flag only when the economy and stock market are already flagging in certain ways. So useful, but not a stand alone predictor.
Related to leading indicators are recession models. They too try to pick out the leading variables and typically include the likes of real income, trade sales and industrial production. Once again they flag as these first parts of the economy roll over, so cannot be considered as ‘predictors’.

Next, you’ll hear a lot that tightening, either through oil prices or interest rates, are the typical causes of tipping the economy into recession. The two charts below appear to echo that.
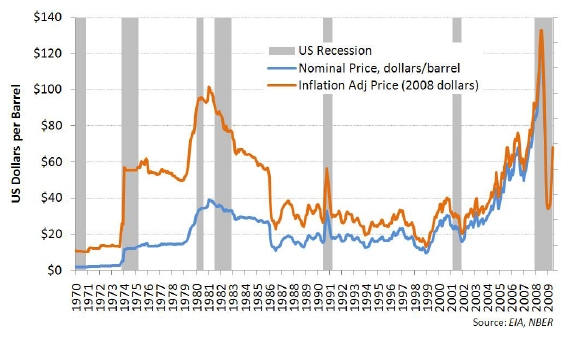
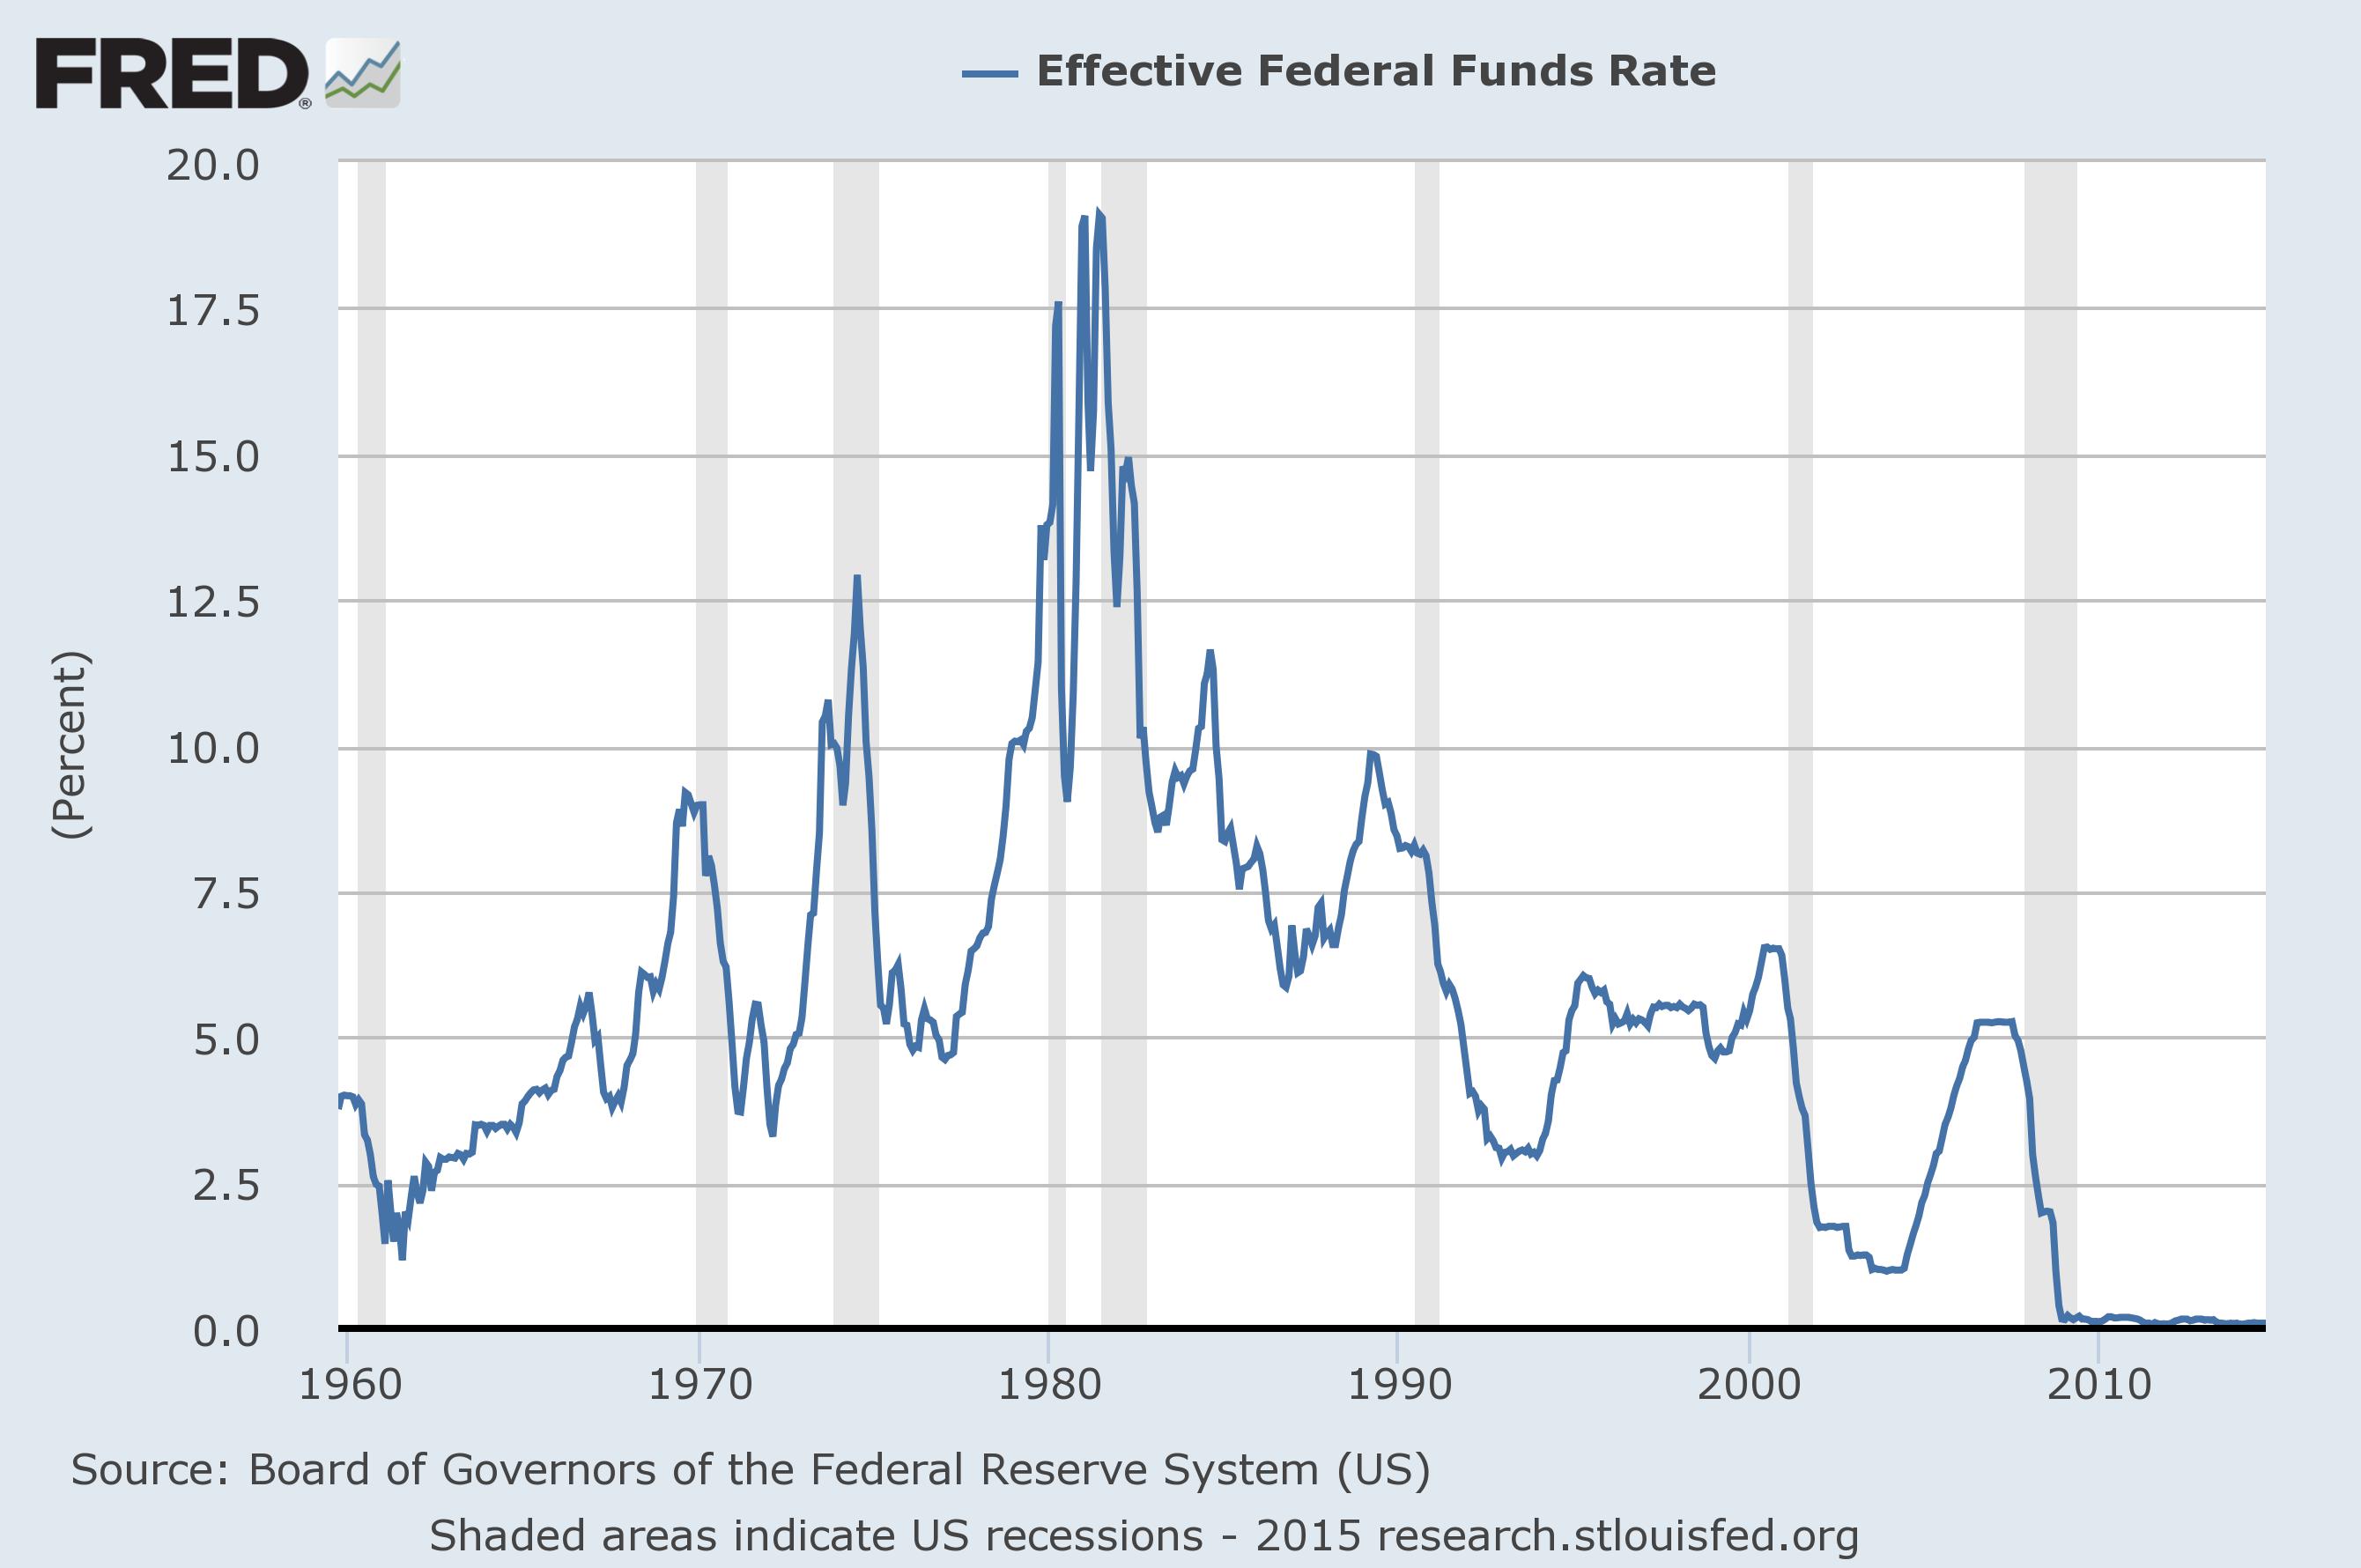
However, we see that further back in time crude wasn’t a major factor in recessions and Japan provides a useful example of recessions occurring despite ultra low rates.


Source: ETF Guide
Associated with the latter is the interest rate spread. The yield curve is perceived to be a reliable recession predictor: when it turns negative recession is looming.

The reasoning is that buyers would rather take up a 10 year bond at meagre rates because they have such little confidence in the economy ahead. If that is so then it is the market leading the economy again.
However, the Japan experience shows that we can have recessions without an inverted yield curve, and again looking further back in time at the US we can see the same occurred there too.

Below we can see the relationship between inflation (with oil prices being a key factor) and interest rates.

Source: Yellowstone Partners
And here the rise of deflation.

Accordingly, our current circumstances have more in common with the 1930s when low oil prices, low rates and non-inverted yield curves were in play and notably were not recession triggers.
The supposed ‘mistake of 1937’ alludes to the central bank tightening to early and bringing on a recession. This is part of the wider misinformation that central bank actions lead us into and out of recession. Once again the example of Japan in the 90s and 00s show us that despite QE and ultra low rates, both bear markets and recessions still took place. Now we see that repeating but on a global scale. The US may have ended QE but it continues in the UK, Europe and Japan, whilst ZIRP is the norm around the developed world and there have been many fresh cuts and easing measures in 2015. Despite all this the world is quietly slipping into recession. Below are the real indicators of China’s economy, notably diverging from the ‘official’ GDP.

And here we see US economic indicator surprises have stayed negative all year.
Negative leading indicators (ECRI) and negative coincident indicators (above). No surprise then the Fed left rates at zero. This is going to help with the myth debunking. If we are now in a bear market and tipping into a global recession, as I believe, then central bank ‘tightening’ can’t be fingered.
Moving on, high valuations are considered a bear market trigger. The chart below reveals this may be so, but with a notable outlier in 2000. Much like the charts of interest rates and crude oil above, if there is a relationship then it doesn’t tell us at what level (oil price, interest rate or equities valuation) or at what point in time the economy or stock market will tumble over. However, high levels in any of the three would represent notable flags that a reversal lies ahead.
 Similarly, high sentiment, allocations and leverage are flags for a stock market peak. But again they don’t tell us when or at what level the reversals will occur. They are warning signs that mania is taking place, but what causes that mania?
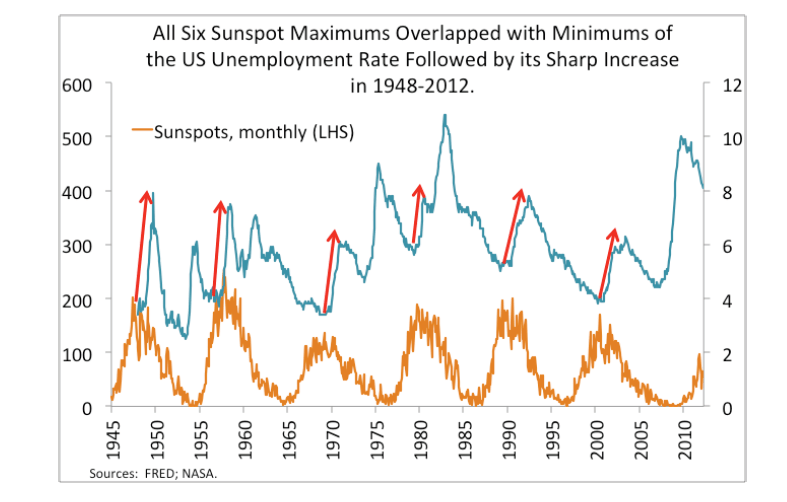
On the chart above are labelled what I consider the real predictors: solar cycles. They enable us to time the market peaks on a longer term view, with the major lows above equating to major peaks in commodities. Below we see that the influence extends to the economy with relations to unemployment and recessions.

But not all bear markets and recessions can be associated to sunspot peaks, which brings us to the other main cause: demographics.
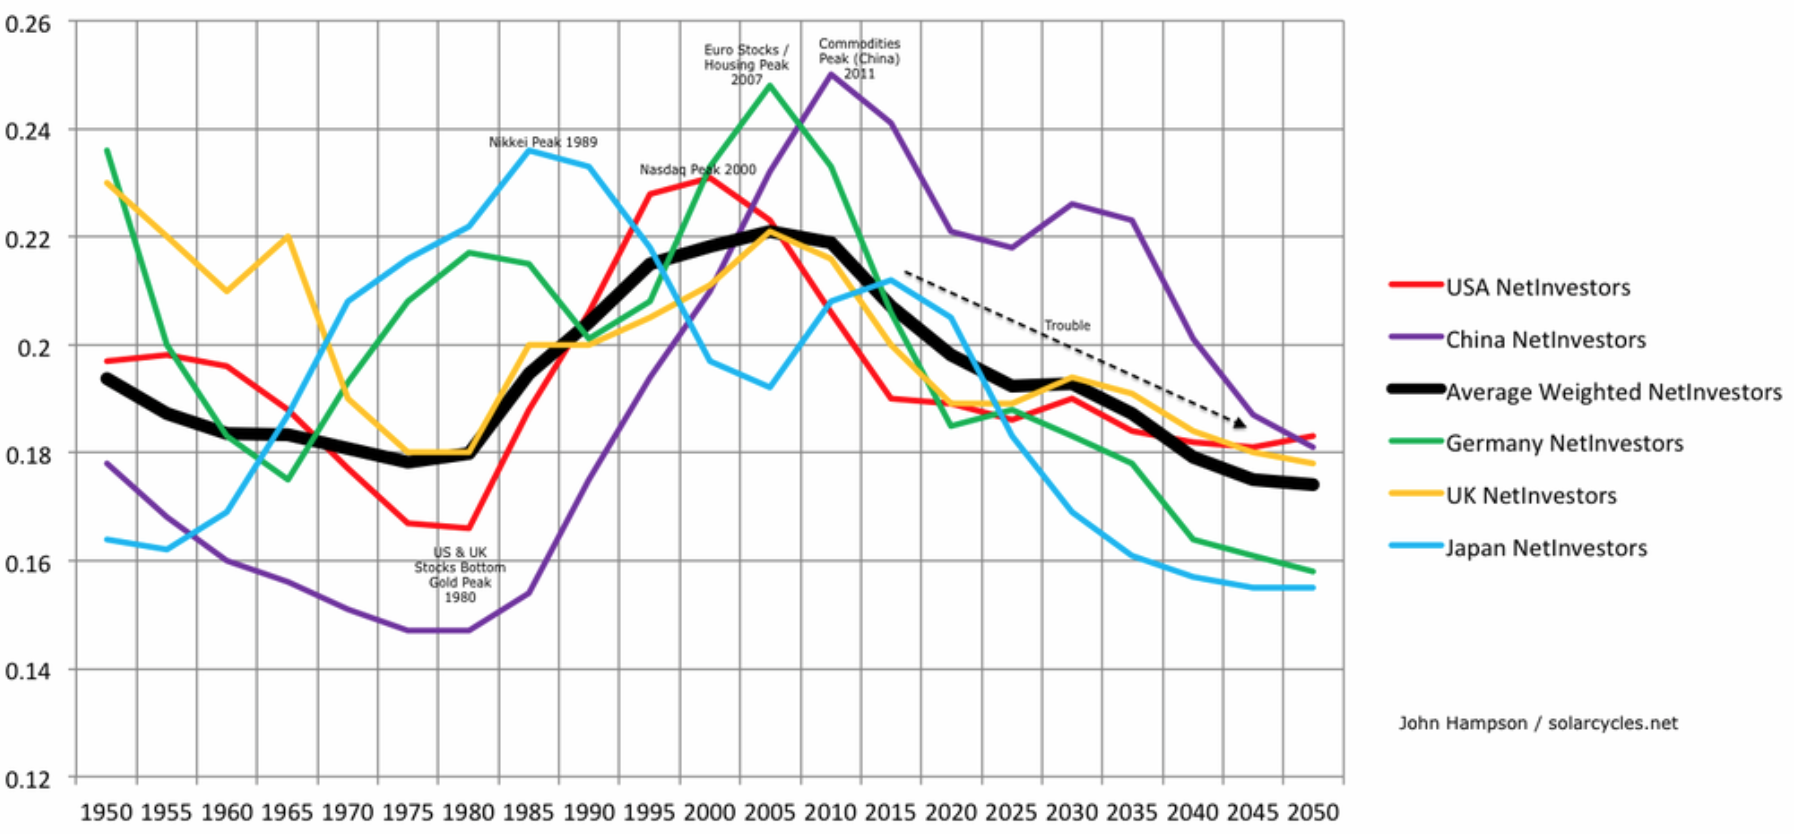
This is the overarching reason why the global economy is in trouble: the collective negative demographic trends in the major economies. Again, demographics influence both the markets and the economy, and as they are to a large degree set into the future we can predict what lies ahead. As the chart above shows, that would be ‘trouble’.
Demographics and solar cycles are related, with the latter influencing the former, and as we can identify their influence in tipping the market and economy over, we can likewise see how they bring about manias in both into demographic and solar peaks. Therefore into both types of peak, it is normal that oil prices may rise, unemployment may fall, stocks may boom and rates may be tightened.
The major peaks in 2000 and 2014/5 were solar. The major peaks in 2000, 2007 and 2011 were demographic. Perhaps we then we can see why 2000 was so outsized: it was both solar and demographic together.
To summarise, demographics and solar cycles are the main causes of bear markets and recessions. Within that, we can identify those indicators that lead in the economic downturn, which make up the leading indicator and recession probability model components. Notably, these include the stock market. The yield curve, interest rates and oil prices can also be useful such flags but there are circumstances when they don’t apply. Those circumstances are demographic, and that non-application is in play now, as it was in 90s Japan or 30s US. So, should we now be tipping into a bear and recession, that will help invalidate some of the misinformation spread.
There are no dead certs in the economy or markets. The best way to phrase it is that typically stocks bears and recessions occur together, normally the former leads into the latter, usually the cause is either demographic solar or both, and that often we see flags being raised by several of the following: valuations, sentiment, leverage, allocations, oil prices, inflation and interest rates.
Turning to the short term markets briefly to close, the recovery rally in stocks has been enough to neutralise several of those indicators that had turned excessively bearish. Gold has been able to make a higher low last week and the next confirmation would be a higher high. I expect stocks to break downwards again in due course and I maintain the bear kicked off in earnest in May, with the topping process having showed clearly as starting in 2014 at the solar max.

Your work is more than worthy of a PhD. Sharing it as you do deserves an OBE at least.
Very kind thanks Peter
I sincerely doubt if professors at Harvard Yale or London School of Economics could produce a better report.
Peter_ is wrong. This is WAAAAY BETTER than mere PhD but he’s right about the OBE!!
BRAVO!! SUPERB!!
Before Peter_ takes umbrage I’d like to correct myself. He’s right he did say it was MORE WORTHY than a PhD.
Sorry Peter_
Many thanks purvez
Reblogged this on Rajveer on Markets and commented:
A Must Read
Thanks
Truly fascinating information in this post, thanks John. (I pinched a couple of the charts).
History is our guide, but some will never discover the pieces of the jigsaw that are shared at this blog, I’m so glad my curiosity somehow brought me here.
Re this comment:
‘If we are now in a bear market and tipping into a global recession, as I believe, then central bank ‘tightening’ can’t be fingered.’
Are you saying that Janet Yellen was just trying to avoid being fingered in the future? Ahem. 😉
Ha! Thanks GM
Re short-term market action, I didn’t like the action on Friday much at all. I think the bulls held the line.
Valley’s weekly calls have been accurate, but pressure is mounting (to the downside). I have further funds to deploy, so a week with some recovery (maybe to that 2040 area) will not be a bad thing to add some more short ETFs.
I am tempted to short oil (via an ETF) on a bounce, rather than the stock market.
Enjoy the weekend everyone.
GM, I would be very careful shorting oil at this level. Saudi is cutting production, Iraq is starting to have trouble with increasing production and US of course is slashing production. We saw a huge short covering rally and now I suspect a stabilization phase that appears to be in place. This will bring ups an downs, but I believe it would be better to play the upside at these levels. I really doubt OPEC truly wants to see prices drop much more.
Good Luck!!!
You clearly get your *news* from sources (propaganda) in Amerika. Hence you are forming your view based on something other than facts.
Do tell us when you actually make a trade though, if ever.
haahhah Good One! I make trades every week. And I talk about some of them here. Read the Nat Gas posts. I report on OIL but have said I am not trading it unless it goes to the 20s. But go ahead and short oil at historical lows. No skin off my back. I mean I only work in the Electric Utiliy space and have direct contact with Energy on a daily basis, I just forecast Energy loads on a daily basis. But hey I am sure you can do better.
Again, Good Luck!!!
You sound very proud of your job, but despite that some of your statements display ignorance of the geopolitical tide changes.
Thanks for your concern, I’m a big boy, and I’ll never need advice from you.
Well at least we have gotten to your weakness. You fail to believe anyone but your own myopic view is the right path. You make personal attacks unprovoked on many people, not just me. You allow your emotions to get in the way of objective thought. Information comes from many sources and if you allow your personal bias to get in the way of objective logic, then this will lead to failures. I generally think you are a complete moron, but that makes no difference to me if you have a view on something, I evaluate that for what it is.
One final note, you have a great need to insult in a forum where you should be more polite. There really is no need for this activity on a site that is actually meant to provide ideas and help each other, which is all I tried to do on that post. Please note that their was zero personal attacks in my advice. You do not have to agree with the statement, but you do not have to attack either. As far as politeness on this site goes it is clear to me and probably most others that you have a real issue. You are consistently rude and most of the negative behavior on this site surrounds you. Mostly provoked by you, There is no need for it.
Some more advice would be.
1. Try to be less myopic
2. Try to be more polite
3. Try to not allow emotions cloud your objectiveness
Happy Trading!
Just because I hate BS merchants, JaFree (oil expert) thinks the following:
‘I would be very careful shorting oil at this level’
‘I believe it would be better to play the upside at these levels’
Oh, he also said:
‘I am not trading it unless it goes to the 20s’
Poor guy.
Case in point. You know absolutely nothing about my knowledge in this area yet mock. Very Myopic. Please read previous post.
I merely point out your contradictory statements.
I guess you are unable to explain how you form two opposing views.
It would be nice to see you try, but I suspect I will wait in vain.
GM, If you are able to point out contradictory statements than do it in an objective non-personal attack. We can disagree, make our points and even argue, but the personal attacks are not needed. I have yet to see you point out a single contradcitory comment though.
Would these (baseless) comments constitute ‘personal attacks’? You tell me…
‘You fail to believe anyone but your own myopic view is the right path’
‘You allow your emotions to get in the way of objective thought’
‘I generally think you are a complete moron’
I have a friend who would call you a piece of work. I find you amusing presently.
I’ve just re-read all of my comments to you today, none of them contain anything other than a criticism of your view and how you form them, which you choose to take personally.
But you clearly can’t handle any kind of debate or disagreement, you never address points made against yours, slippery chap that you are.
As for contradictory statements, yeah, sure, you can’t see them. I copied and pasted a classic. You can’t explain how you can hold two opposing views though can you?
Stop digging when you’re in a hole.
As I’ve mentioned before, if anyone posts a view here, they should expect scrutiny.
Just got back to the forum after a wished well weekend from you GM. Just a short quick answer for you, cuz I see no need to dwell on the past. YES it is personal attacks that you are best at. I have ZERO issue disscussing disagreements. That is your weakness not mine.
When you provide scrutiny, we can have a discussion. If all you do is rant, what is there to discuss.
I see technical downside risk remains until weekly charts revert (naturally) but once this correction completes (soon) it should be bull resumption via bigger wave 5 before the bull from 08/09 concludes. Then the complementary bear.
Bottom indications appear to be occurring suggesting $US going weaker will give some economic hope to help kick start wave 5.
eg http://barestbodkins.blogspot.co.za/
Peter_, I don’t expect another wave up after a year of topping.
But I’d be interested in seeing your wave count for 09 to the top you are expecting.
GM please, as such a well-read and more than well-versed exponent of this wondrous medium, you will know all about it. Let me point to a source that also has my respect, albeit just a peg or 2 below my respect for this esteemed site…
and it is the generously open-hearted source of Elliott translation. But please note that Elliott people can disagree like anyone else, but they give each other more elbow room because sooner or later each one has a a little whoopsie so to speak. Now my particular take is in line with the macro view (I think that should be enough to boggle you for while) but I reserve the right to disagree on short-term stuff now and then.
Kapow….
https://caldaro.wordpress.com/2015/09/19/weekend-update-518/
http://screencast.com/t/fLbTgrPYJq9
I don’t think 20% declines can be ignored, but if you think ‘5’ lies ahead, you must have a different view.
Thanks. I see he doesn’t count the 2010 decline.
We will see what transpires.
Remember that an impulse action (bull) cannot have wave 4 entering the price territory of wave 1. If you want to see the move to the ATH as completed then you must work it as an ABC corrective. I gave you the link to Elliott basics, if you look again you will see what I mean. Even if your eyes say no, you should rather go with the basic theory.
OK, sorry, the rules I am learning.
That’s interesting then.
I do consider this a cyclical bull within a secular bear, with the final plunge ahead.
So I think I’d be in the ABC camp, meaning I have to ignore the 2010 plunge.
If you desire the ABC then you must choose where is the ab. Please be prepared to be led nowhere but back to where you started.
Thank you John..Great work..
Thanks
Thanks for your input again John.
Ta
JH,
Personal apologies to my responses to GM’s unsavory behaviors. Just trying to help keep the site polite.
No apology necessary. That’s how I want the site to be too.
I as well. No place for snide, gratuitous remarks – speak your piece and be done with it.
Another great piece, John. Thanks –
Thanks Gary
Now back to your regularly scheduled programming:
http://charts.stocktwits.com/production/original_42802845.?1442516170
The week coming up (i.e., week after September OpEx), is the worst week of the year going back 25 years.
Don’t take this as a snide comment, but your link does not function.
Linked so: http://charts.stocktwits.com/production/original_42802845.?1442516170
But only if you highlight the entirety of it – then copy & paste to your URL locator bar
And jee, did so many years go by so quickly?
Thanks, Peter. I linked to this as I know Valley’s system anticipates an up week. Horses for courses…
No evil intent ascribed 🙂
Intended for GM, of course
John: Thanks for the great work and the informative market blog!
Here’s some input on the current earnings trends for S&P 500 Companies. The last time when net earnings were $94 (Q3-2013), S&P was below 1700! And, we now have a decelerating earnings and economic trend as well.
QUARTER Quarterly 12 month
END Operating Net Operating Net
ESTIMATES
9/30/2015 $28.88 $26.60 $107.57 $94.06
ACTUAL
6/30/2015 2063.11 $26.13 $22.82 $107.78 $93.43
03/31/2015 2067.89 $25.81 $21.81 $111.50 $99.25
12/31/2014 2058.90 $26.75 $22.83 $113.01 $102.31
09/30/2014 1972.29 $29.60 $27.47 $114.51 $105.96
06/30/2014 1960.23 $29.34 $27.14 $111.83 $103.12
03/31/2014 1872.34 $27.32 $24.87 $108.85 $100.85
12/31/2013 1848.36 $28.25 $26.48 $107.30 $100.20
09/30/2013 1681.55 $26.92 $24.63 $102.20 $94.37
06/30/2013 1606.28 $26.36 $24.87 $99.28 $90.95
03/31/2013 1569.19 $25.77 $24.22 $98.35 $87.70
12/31/2012 1426.19 $23.15 $20.65 $96.82 $86.51
This guy GM has 0% self-awareness and a strong ego. If this was a repetitive behavior/pattern on his part — I would ban him from the site (if it were my site).
Thank you all for the constructive input!
Peace.
Welcome to our latest American poster, he’s as welcome as the other ‘guys’.
I enjoyed your exclamation marks.
Thanks Nik
Well………………
Once again every one is a bear.
And once again i say there is no bear market until interest rates rise.
The topping process that John has called since Oct 2013 is on going.
But if you go short you will lose your cash.
Hello Bob.
Interesting comment.
Why do you think everyone is a bear?
Why do you think a bear market can’t begin until interest rates rise?
Thanks in advance.
Bob, if you are short you will likely fair far better than if you are long. This is one extremely bearish chart:
http://stockcharts.com/h-sc/ui?s=%24SPX&p=W&b=5&g=0&id=p62078009088
Outdid yourself John. I think your best article to date!
Thanks Allan
The definitions of bear markets and recessions are those journalists use. The official definition of a recession (at least in the USA) is given by the National Bureau of Economic Research, which is:
Q: The financial press often states the definition of a recession as two consecutive quarters of decline in real GDP. How does that relate to the NBER’s recession dating procedure?
A: Most of the recessions identified by our procedures do consist of two or more quarters of declining real GDP, but not all of them. In 2001, for example, the recession did not include two consecutive quarters of decline in real GDP. In the recession beginning in December 2007 and ending in June 2009, real GDP declined in the first, third, and fourth quarters of 2008 and in the first quarter of 2009. The committee places real Gross Domestic Income on an equal footing with real GDP; real GDI declined for six consecutive quarters in the recent recession.
Q: Why doesn’t the committee accept the two-quarter definition?
A: The committee’s procedure for identifying turning points differs from the two-quarter rule in a number of ways. First, we do not identify economic activity solely with real GDP and real GDI, but use a range of other indicators as well. Second, we place considerable emphasis on monthly indicators in arriving at a monthly chronology. Third, we consider the depth of the decline in economic activity. Recall that our definition includes the phrase, “a significant decline in activity.” Fourth, in examining the behavior of domestic production, we consider not only the conventional product-side GDP estimates, but also the conceptually equivalent income-side GDI estimates. The differences between these two sets of estimates were particularly evident in the recessions of 2001 and 2007-2009.
The committee’s musings make me yearn for a world like that created (briefly) in Hong Kong by one of my heroes:
https://en.wikipedia.org/wiki/John_James_Cowperthwaite
Laissez-faire s’il vous plait.
Wow, John! This post deserves to be read again and again. You really have the best information on the web and best commentary. Thanks you so much!
PALS this week:
Very favorable except for very unfavorable seasonals and puetz. Expect Monday to be down and then rebound sharply. Tuesday to Friday surprise rally.
Past this week would be ideal time for big sell off, post perigee and post full moon.
Valley,
Agree!!!
Cheers Valley
Valley,
Are you positioned through sep 25 weekly calls.
I have a small short and relatively long option trade. Planned to take off the short monday on weakness and keep the long.
Bill
No, I am long etf at this time. Weekly calls are too expensive at this time, but if Monday sells off may try to pick up 5 at the money QQQ calls exp. 9/25.
I picked up spy spread SPY 199/201 for 50 cents..will see ifcan exit near 90 cents.. a move to 200 will do it. If we dip to 193 might pick more ..hope we get a rally to 200 and then can do spread for oct 18th monthlies bear spread.
I am rather concerned by the absence of Nicholas. Do we need another leg up for him to come back?
I too am waiting patiently for Nicholas to give me the ‘go ahead’ for a short entry. Clearly he doesn’t feel the time is right yet. We have to give the ‘master’ time to work these things out.
But I have full faith that once we start we’ll have months (nay years) of downside to work with. Job and I are close pals as far as patience is concerned.
Fabulous post John. Several yrs ago when i was lead to your site u added an additional complexity to my understand of the texture of the mkts. Although your recent thesis has yet to work out, im rather conflict that it will happen although ive disagreed about your sunspot peak period. I worry that one day youll grow too popular and as such the value of your posts will be minimized by rules of economics, but until then Cheers John!
Effin gin… Confident not conflict 🙂
Many thanks Joseph
Peter_, /purvez/ any wavers out there,
After your wave 5 to new highs (c.2400 I recall), what do you expect then?
A mild bear, say 40% down, then a bull resumption?
What’s your view on this very long-term view from another well-thought-of Ewaver:
https://pugsma.wordpress.com/longer-term-sp-500-view/
He doesn’t envisage much of a pull back in the short-term, I’m thinking at least 50% decline.
I’m still trying to figure out the long-term, how long can a bull run once the bond bull bursts? In real terms will it be a bull at all.
What does EW tell us about the big picture themes that JH references here?
Thanks in advance.
Yours myopically
GM
😉
Personally I do not agree with Caldaro when he chooses a short 5th wave of a few months. There is no reasoning that yet convinces that wave 5 cannot sustain. The forces that created an extension of wave 3 were and still are supposedly beyond (our?) comprehension, but clearly they have brutish power. Probably unleashed by the enforced adoption of the freely available leverage that the Banksters made Clinton force upon the greedy, who are now the winners and thereby the rulers of the planet. As the FED show us by their bare naked impotence.
Morning Peter_.
Thanks for your responses.
I see evidence that the bubble has burst (via Jeff Snyder at Alhambra, and elsewhere), the Eurodollar complex has been in retreat for years.
I anticipate Clinton’s errors being rolled back by market forces in due course, certainly within the EZ, and that’ll be enough, but maybe elsewhere, driven by the sensible BIS and its committees.
The worm has turned.
GM thats 3 questions…
1. After the 5th expecting SPX to circa 1580, which is the popular take.
2. Pug is good but imo they got the count wrong at P3 – failed to see that many correlatives disagree.
3. TA tells nothing. You interpret within a bubble where the real world does not exist. Elliott is just another TA tool. Outside the bubble is called noise.
GM, the ultra short answer from my end is that there is no wave 5 up due. We completed wave b in May’15 and wave c will go below the 2009 low. How much below?
If it follows EW guidelines and reaches the previous 4th of one smaller degree then you are looking at a range of 335-215. Unbelievable, I know but never say never.
BTW Pugs SC-III is where I would place a SC-V.
My ‘faith’ in this count has only increased since reading John H. In particular this recent post clearly shows the generational headwinds of low Solar Cycles, Demographics and Limits of Credit being reached, none of which can be easily or quickly reversed. The last one has the capacity for causing the most terrifying mayhem.
Credit is endless in a ZIRP environment and less. As for the power of collective morality I would not believe it even if it invited me to dinner.
Sorry Peter_ your ‘collective morality’ reference evaded me again. Any chance of a more ‘simpler explanation’ keeping in mind my 2 brain cells please?
Specifically for Red Dog and any other Aussie compatriots, it appears as though the AUD Au price is gearing up for test of the all-time high this year.
Whether that comes with further AUD weakness OR as a result of a broader collapse in all currencies including the USD remains to be seen.
The USD does however look bearish to me as well so the Au price may be about to surge in true bull behaviour in ALL currencies.
http://stockcharts.com/h-sc/ui?s=%24GOLD%3A%24XAD&p=W&yr=5&mn=0&dy=0&id=p36614429310
Sorrynthat should read:
“Whether that comes with further AUDUSD weakness……..”
ie., the AUD could hold its current ground against the USD and both could collapse against the USD Au price OR the AUD could even gain ground against the USD(which I doubt).
Either way I think we are on the verge of a multi-currency surge in the Au price.
PS There is alot of chatter ATM about the collapse in COMEX deliverable. Many are coming out and saying it counts for nothing.
I however prefer to listen to those that have a record to stand against. I suggest the sceptics listen to what Kyle Bass has syas in a recent interview on the subject, wher he states that he visited the COMEX and asked some direct questions on the issue.
Not only the response he got surprised him, but the search he undertook for particular gold bars did as well. Needless to say……..
He walked away and asked for his gold to be delivered right there and then!
IMO the USD will fall to the mid 80 level this year as capital flees US stocks and bonds.
Gold will be the safe haven this time around and will surprise most as virtually 100% of investors expect the USD to be the safe haven.
That in itself ensures that the majority are WRONG:
http://stockcharts.com/h-sc/ui?s=%24USD&p=W&yr=5&mn=0&dy=0&id=p69689710765
Allan, I am trying my best to not post but you have gone to far. If stocks can make a high long term Inbetween point and an early low 2 point then why can’t gold make a low long term Inbetween point and an early high 1 point? I mean, come on, gold’s long term Inversion window isn’t even half over and you keep saying that gold must go higher. Why? Can’t there be two long term Inbetween points so that the long term 3 point becomes the low that turns the market back up in a big way.
How about American stocks long term 3 point being a new ATH that results in Gold’s second long term Inbetween point being the final low –or– its 2 point? You know that all this is possible too.
Richard, gone too far??….mate it’s only an opinion. I’m not holding a gun to your head expecting you to agree lol.
I never ever hold to any single intermediate or long term technical tool or system.
Furthermore,I think everyone needs to take a big step back and look long and hard at fundamentals as it is ultimately fundaMENTALS that drive markets. What it is that drives fundamentals is up to contention, however, liquidity is drying up rapidly and large cracks are appearing across all markets. Leverage is through the roof.
Bond traders I know are deserting the market, cracks are appearing in every single stock market in the world with both long term wedges and trend lines broken to the down side. Those wedges have been back tested and failed and are now breaking back down. The USD has broken down from a smaller wedge. Aussie gold stocks which have a solid history of leading the Au price in USD terms are breaking higher amd yet you and the likes of Martin A want me to ignore things that have in the past sent very strong messages?
I’ll stick with what I know and what history has shown…….thanks anyway 😉
Cheers
To clarify:
“back tested and failed”………..to break back above. ie, Break confirmed.
Hell Allan, you’ve gone too far now, relying on all that history nonsense.
Sort yourself out.
http://stockcharts.com/h-sc/ui?s=FAS&p=D&yr=1&mn=3&dy=19&id=p29805597965&a=375189174&r=1442699932955&cmd=print
Hi GM
You sound like a sophisticated member of this forum , so I wont bore you with fundamentals….a rise it interest rates means a stronger $, an uncompetitive US, etc.
I refer to the low interest rate acting as a “crutch” to the market .And while the FED stands behind this crutch, investors feel secure. And Europe and Japan have done the same.
Low interest rates are not a true economic situation. How can you lend somebody money and get no return ?.This has created an artificial euphoria .It has also made John’s beautiful graphs not work… for neatly two years.
So until the Fed steps back with a change , the market goes sideways / up.
So many people expected an increase this week, they sold in desperation.
The buyers will be back next week.
regards
Bob
Hello Bob.
Thanks for the reply.
I don’t agree with your reasoning for many reasons.
The US dollar has been on the rise for over a year, and yet interest rates haven’t moved.
Bond yields are mostly edging lower still (the market sets the rate, not the Fed).
The strong USD is already hurting the global economy in many ways, including sucking petro-dollar re-investment into US markets.
The euphoria was created by the solar maximum, and that is now fading.
The Fed is impotent and irrelevant, they never manage to stop a downturn.
The buyers may be back next week, we shall see, short-term is always a tough call.
Regards.
If the time factor of the false economy (called the stock market) leading the “real economy” by six months is still in effect then it seems unlikely to me that there is any fear that the “real economy” is going to top out six months, or sooner, from now. If that is correct then stocks are still in a bull market and the ATH is not yet in.
Hello,
A BULL, or should I rather say … a rose among the thorns.
Re gold; wish I had GM’s confidence. I think a case can be made that long term fundamentals haven’t changed since 2008; leading up to 2011. Technically, the move down from the highs in August of 2011 were deceptive. At the time it looked like a 3 wave correction not a five impulse down. Some are still saying that it’s a five wave sequence but I can’t agree with that conclusion; based on the five minute charts at the time.
For all you Gold Bugs out there note the rarity of India having droughts two years back-to-back and what it means for a country with the equal population of China’s 1.3 billion people:
http://www.business-standard.com/article/markets/drought-dents-india-gold-demand-but-prices-still-appealing-115091100220_1.html
For Western Gold Bugs who are mindlessly relying on Asia to power a bull market in Gold:
http://www.business-standard.com/article/reuters/slow-asian-demand-despite-multi-year-low-gold-prices-115073100570_1.html
Richard, do you know that c. 2,700 tonnes of gold are traded in London every day, via XAU?
Every day.
The price of *gold* will never change due to retail investors in Asia or the West. The London XAU trading dwarfs everything else, Comex included. The price will rise when investors move away from stocks and bonds and into *gold*. The price will rise again (in a hurry) when investors (try to) move from *gold* to physical gold.
But if you have some evidence to prove otherwise (not some media spin, actual evidence), please share it, I’d be very interested indeed.
Allan should be seeing this potential: American stocks crashed to a Delta low long term 2 point (but not from an early high 1 point but a high Inbetween point; early low 2 point, meaning the trend is still up to a new ATH) and Gold also crashing to a Delta low long term 2 point (potentially a late low point, meaning a bigger crash than the recent American stock crash because of Gold’s 1 point being a high AND AN EARLY HIGH all resulting in a crash of Gold to a very deep and late low 2 point that will be one for the history books more so than the recent stock crash to a similar Delta low long term 2 point).
Note: As per my prior posts neither of these Delta long term 2 points being lows is what I predicted. I predicted stocks 2 point being the ATH that would see the market crash after wards instead of an early 2 as the low that is part of an early crash before the ATH that really crashes the stock market –and– I predicted that Gold’s 1 point would be a low instead of a high that I now think, as of this weekend, that it is going to be. This is one of the problems of using Delta and why so many have lost generations of inherited wealth trying to use, solely, as their mere “wave” count (waves being lessor than cycles).
In other words, for Allan’s sake, American stocks crashed to a Delta long term 2 point and Gold is also going to crash to its Delta long term 2 point BUT CRASH MUCH GREATER. (I am actually expecting Gold to make a very rare second low Inbetween point so that its 2 point is a high and its 3 point will be the final low that turns the market back up in a very big way (for Ellioticians this means the potential for a Descending Diagonal Triangle or Falling Wedge which always means the end of the larger Correction Wave before the larger Impulse Waves reassert themselves)).
Energy Stocks and many third world economies/currencies bottoming and turning back up in a bull market?:
http://www.bloomberg.com/news/articles/2015-09-20/oil-speculators-most-bullish-in-two-months-as-opec-calls-for-80?cmpid=yhoo
Meh, out of my shorts, 1% loss.
Really tricky trading only a UK ETF within UK market hours.
Lack of a plunge on Friday and valley’s PALS for the week lead me to believe there is one leg up. Also, on FTSE I see only 4 waves up from August low.
So, looking for a higher entry price towards the end of the week.
GM, any particular reason you are using ETFs rather than Spread betting, particularly if these are swing trades?
couldn’t have happened to a nicer guy…..
Huh?! Andy. Are you REALLY wishing ILL on someone here? Is that what your comment is supposed to mean?
Please answer before I say anything more. Thx.
Placed a preliminary short on Dow at 16410. Will add on any further rises. We should be heading to the recent lows now through rest of september and october. First target is 16125 area followed by 15800.
This is a very simple question: Is it time to “buy the dips” of Copper, Crude, AND American stocks?
Richard I, what time frame are you referring to? I’d only be able to answer on the third one in any case, if at all.
I am looking for the ATH in American stocks to occur in January (Yearly Outside Reversal) and then will come the Solar Cycle’s crash in 2016.
Richard I, it would appear that Peter_ has answered your questions here:
http://barestbodkins.blogspot.co.uk/
I am not convinced yet that the correction is over, but I have cash waiting for panic. My two favorite panic buys that I believe have value are FFIV and CELG. High growth value. CELG may get destroyed for purely being a biotech, but they are making money and I would make the arguement that they have value even at this point. FFIV is an incredible company with an incredible product. They are also very volitile. A panic drop from here would be good. Under 100 would be amazing. Crude (WTI) seems to be stabilizing to me. Demand continues to rise production is starting to fall. I still will not play this space, because I prefer the more predictable Nat Gas space as a trade mechanism and long term (1-3 years) play. US is drowning in Nat Gas and I suspect it will couple to the world market prices in that time frame, which should bring about a $4-5 per BTU price. I watch oil as a proxy for Nat Gas. The BTU content ratios are tied to all Energy uses. Coal is so cheap right now the demand is increasing. Japan is buying coal over Nat Gas for instance. I am not a player in coal either, but there has been a renewed interest in coal across the world that cannot be ignored. What I have not discussed is Uranium. I have been buying CCJ on the way down and I am still in the red, but I expect Uranium to prices to increase as Nuke plants in Japan start turning up. This is a fairly risky play. If Helion proves they can control fusion in the next 1-2 years, it could be a disrupter. More on Uranium later.
JaFree, a great post with lots of interesting info. You seem to be defining the correction as being downwards i.e. a panic sell followed by higher highs.
My take is that we’ve flipped sides. The trend is down and the ‘correction’ is upwards i.e. any sell will not be a panic but a serious acceleration of the trend.
Purvez, I try to position myself for multiple outcomes. Part of the reason I am so cash full right now is that my personal opinion is that times like right now are the absolute most difficult to judge. Since technicals do not drive my investment, I do not try to nail the high or the low. I sell into rises and buy into drops. Right about now is where I would normally start buying lightly in individual stocks with value. Markets correct, but value can be found and individual stocks can be undervalued way before market crashes. So I just try to use the technicals to be a little smarter about entries and exits. The big question for all of us now is Bull vs Bear. I do not think the answer has been given by the markets yet. If we see a new low between now and Nov, I will accept the bear. If we only revisit the recent drop, Bull may resume. My experience is that the Aug. drop was fairly violent and I actually expect the bear if forced to choose. However, I will be putting money back into an S&P ETF in my 401k if we revisit the Aug low. Just a 20% stab of my current cash in that account. That will be my insurance buy. Then I will wait some more to see what happens. If in fact we go into bear, I will be traunching in the funds until completely done all the way down. That was my strategy in the 2000 and 2009 bears. I missed the final capitulation in 2009 because I ran out of cash. There was plenty of panic in multiple areas of those bears but the 2009 capitulation panic was outrageuos and I missed it entirely. If we, the bears, are correct on this cycle, I expect several more panic moments. When that happens, a value stock can drop fast in a panic and rebound nearly as fast to a more reasonable level. I will continue to watch closely.
Ah good JaFree. You are clearly in control of the situation here. Very pleased to hear that. Wish you all Luck with your trades.
Hello Richard.
I struggle to understand how your mind arrives at these comments.
If you look at a chart of copper it is in a crystal clear bear market.
If you were going to buy the dip (on a trade), surely you might have done so in the middle of August, but why would you do so now, just as the downtrend has re-started?
Do you look at charts and consider what is happening out there with financing and activity? It’s all going down, and has been for a couple of years, in the real world.
Mystery to me how you don’t see it.
A major shift to longs is occurring by the Large Specs in the Grains:
http://www.agrimoney.com/news/hedge-funds-after-us-corn-downgrade-end-bearish-turn-on-ags–8791.html
This is my attempt at contributing some EW based info here.
From the Thurs 17th Sept high to Friday’s 18th Sept low looks more like a double zig zag on the 5 minute chart rather than 5 waves down. That in turn suggests that we are still inside a corrective wave (w4 or whatever). If that’s the case then we should be heading back above Thur 17 Sept high.
How that fits in to the overall corrective wave from Aug 24 low is currently difficult to outline.
Main take away from this is that we are still not out of this choppy back and forth action. Given the wide range of this action it is necessary to be wary of taking either direction in a big way yet.
Sorry I should have said that my counts refer to the DJIA and INCLUDE out of hours action.
Driving Elliott fractals into intraday in order to determine a bigger picture is most inadvisable. Especially in such choppy water. Do you do a lot of bungie jumping in your spare time?
Peter_ my preference is for hang gliding.
Aah Peter_ I would disagree with you for the first time. It all depends on the timescales.
EW fractals work at the 5m & 1h intervals just as well. I’m living proof of that. I’ve been making a more than decent living for the last 4 years using EW and 5m/1h time frames. It requires being glued to a screen and counting waves ad nauseum (an awful life style I would not wish on my enemy)…but the rewards are worth it.
I have a very specific question that I have posed here before with no answer. It is currency related and I am not that close to currency, but I have watched several actions that seem to be red flags. Japan, China, Euro all still seem to be increasing money supply. While I see this as destructive overall, the one that really made my eybrows rise and the real question I would like answered is :
Why did the Swiss decouple from the Euro?
GM, I see you as one that may have some answers here with your currency knowledge.
JaFree, if you want to understand currency then I would strongly urge you to frequent the Al Hambra blog here and try understanding J Snider. He is the most prolific poster there AND the most DENSE to understand but well worth the effort.
http://www.alhambrapartners.com/commentaryanalysis/
Purvez, Thanks, I am not really interested in currency. I have my topics that I follow and I prefer to concentrate my efforts there. I really just wanted to know a specific answer and I have asked in several places, and no one seems to answer why the Swiss decoupled from the Euro? It is a mystery to me and I am just curious. I generally consider the Swiss to be quite proficient at banking and it just seemed to be a radical move considering their long term support of the Euro. I have stated in the past how the currency markets seem to be getting wonky and this is one reason I have said that. So I like to ask those that follow these market.
Jeff Snyder has identified a likely reason why, as Purvez has already highlighted but it’ll mean you need to go to his blog, search for related posts, then read them.
Hi JaFree
Firstly, the Swiss franc is guilt .It does not lose its value. Everybody wants francs.
It was pegged to the euro to keep Swiss industry competitive.
BUT..
….to keep the exchange rate constant, the Swiss Central Bank was forced to print more and more francs. Until this portfolio of paper money equaled 80% of GNP.
And then EEC said they would introduce quantitative easing.That would make the Euro weaker and the Swiss would have print more francs to maintain the rate
.A never ending circle. So they unpegged and accepted the consequences .
Hope this makes sense.
JaFree, J Snider’s take on currency ‘in brief’ (and based on my VERY LIMITED UNDERSTANDING of his detailed posts) is that the world and it’s G’mother are short the *Dollar*. Those asterisks are supposed to mean the ‘issuing of USD denominated debt’ rather than the USD currency.
So when the USD (the currency) started to rise those ‘shorting’ the *Dollar* were in deep trouble. Since the Swiss had pegged their currency to the Euro they too were inadvertently shorting the *Dollar*, which was not their intention. Since those ‘clever financial’ folks were shorting the *Dollar* via the CHF to give a degree of safety they were effectively dragging the CHF down the drain too.
SOOO the Swiss in their inimitable and inscrutable style (until the last moment) decided to give up on the peg.
Apparently the recent Yuan devaluation is another example of the same thing happening, but, between their ‘outwardly’ manipulated currency peg AND their inwardly defined economy which had also shorted the *Dollar*.
PLEASE PLEASE take this as a very poor second hand description of my understanding of the situation and do your own research via the Al Hambra site.
I did say at the open that it would be ‘brief’ and believe me by J Snider’s standard’s it is brief….but I do apologise for it’s length here.
HA Bob Collett got to it first AND DID A BETTER JOB!! Thx BOB.
Bob, Thanks, That was my logic to define the reason as well, but it was such a destructive move, that I had to wonder if there were some deeper fundementals that I was missing. I thought the currency watchers here might have been able to provide an executive summary.
Thanks purvez, actually that was the detail I was after. Not too long and I appreciate the effort. I figured it was related to the Euro decision to increase money supply, but I see how they could have got themselves into trouble and had to back out quick. Of course saving themselves at the expense of others, which is what I would expect from those crafty bankers. Thanks to everyone for providing their take.
Much as I hate to disgree with purvez, but the bit that doesn’t get explained by the ECB QE affecting the SNB was the *dollar* impact on Swiss banks. Sorry p!
JaFree, to discuss money supply without grasping that IT ALL comes from banks, not CBs, means you simply are viewing something other than reality.
But to gain the insight, one has to do the reading, it’s deep stuff.
Your choice, but I always do the reading.
GM, I’ll have to do some more reading about the ECB QE effect because that has not quite registered within my 2 brain cells.
No apology necessary, I learn more from disagreement (polite and graciously accepted) than from everyone on my point of view.
Just a snippet….
http://www.alhambrapartners.com/2015/04/16/swiss-dollars-in-february/
JaFree, you said it was ‘such a destructive move’. From who’s side were you referring. Surely it was the RIGHT move for the Swiss or do you have an alternative view on the move?
Don’t hold your breathe for a reply p.
Purvez, It was destructive on the many in the currency trade markets. Whenever you disrupt a long standing link it is going to be destructive. If you hedge and leverage on something that you expect to be the same and then it changes, then you get blindsided. It is disruptive for those that don’t know and most likely beneficial to those that do know (ie the Swiss). My feeling was it was a lack of confidence in the Euro, but no matter how you slice it, I agree with GM it is deep stuff, and not something I would like to spend time on, which is why I went to the experts. I appreciate the responses.
JaFree, the currency markets are the MOST sophisticated of them all. Made worse by political / CB involvment which (as you say) can change things in an instance.
I don’t doubt that there were those who ‘knew’ and those who successfully guessed. The difference in reality is rather minute at the coal face.
One day I hope to be able to grow up and dabble in this market….but it may be well after I’m dead and buried. LOL.
But why not use google?
http://www.economist.com/blogs/economist-explains/2015/01/economist-explains-13
There are hundreds of google links on this subject. Sadly you’ve picked one of many that time has proven to be fallacious.
The Economist’s views are the basic mainstream narrative (because of the Euro).
Anyone interested should look at the CHF/USD and the CHF/EUR chart, you will quickly realise that the the Economist’s explanation is trite (and wrong).
And read Jeff Snyder too, but not compulsory.
That is why I wanted to get the views from this group. I was checking if there was some non-standard views. I too question everything I read in the media. I look for confirmations from various sources.
Nat Gas (UNG): Added to long position this morning on weakness. I expect prices to snap back to at least the base $12.50 to $12.75. I hesitated in fear I would miss the next market leg down an use some cash on panic buys, but I think I have a little time and I still have plenty cash. I guess we will find out.
Hi JaFree
You are correct. It was a very destructive move.So much so ,that you and I both think there is another motive. Time will tell. In the mean time, BUY Swiss francs. They will maintain their value better than Gold.
regards
bob
Agreed Bob, Where will the currency wars end? Not expecting an answer of course, cuz I suspect it is a great big question for even the best of the best.
Hi GM
You have insulted 2 members in a short space of time
Why be insulting in your replies.?
Richard asked a perfectly good question.
Can he buy the dips?
And your suggestion to purvez to do some more reading is like telling Tiger Woods to read a few golf books to improve.
Did you see Andy’s earlier post? LOL
Your friend
Bob
Neither of my replies you highlight was insulting.
To clarify, purvez has done the reading, my comment re money supply and reading wad directed to the poster who asked a question, then replied when pointed in the right direction of some reading material ‘I am not really interested in currency.’
What’s that all about then?
Your stock explanation of the Swiss move re ECB QE is the mainstream view, Jeff SNyder advances a view I think is more coherent.
I think you arrived at your view from reading a mainstream source.
I think your view is wrong.
Have I just insulted you too?
BTW, Tiger Woods, a poor example don’t you think, poor guy is lost in a million swing thoughts.
Hi GM
You are correct
My view is mainstream..It makes sense to me.!!!
And NO , you have not insulted me.
And I now see my comments are wrong.
“Mystry to me how you dont see it?”
“”Your choice , but I always do the reading”
Thats not insulting, thats arrogance.
Did you go to public school?
Your friend
Bob
‘Thats not insulting, thats arrogance.
Did you go to public school?’
Another great example of hypocrisy, thanks for highlighting your many, many qualities.
You are not my friend, but I think you and Jafree would do very well together, discussing currencies perhaps?
Should anyone deem that someone has insulted me kindly let it be. I will take any umbrage or not as I may choose and that I would claim as my prerogative, not?
🙂 🙂 Not as vague as your normal missives Peter_. Are you trying to say something?
Peter, you should write the Federal Reserve press releases…
Gary, I appreciate your humour and I hope as does Peter_. He seems to have a very wicked sense of one!!
Perv, now would I do that? If you find it undecipherable then could be. Tea time at the C side, pass the cake please.
John Li, I too am concerned by Nic’s absence. Should we round up a search party?
Based upon PALS:
Sold my SPX at open for small gain, bought it back at early afternoon lows. Also bought a SPX Call option that exp. 9/25. Will remain in both of these trades until Friday which should be at or near 2020.
2020 on ES futures, or 201 on the SPY.
Valley,
I did OEX 885/890 spread for 30 cents
I try to share my thoughts and ideas here, but that does include highlighting some comments that are plain wrong, hopefully this helps everyone to learn that much of what you read on the internets is plain old BS.
Sorry Bob Collett, but you wrote the following:
‘And then EEC said they would introduce quantitative easing.That would make the Euro weaker and the Swiss would have print more francs to maintain the rate
.A never ending circle. So they unpegged and accepted the consequences .
Hope this makes sense.’
The ECB introduced QE in March 2015.
At the time the EURUSD was at around 1.06, today it is at 1.12. (That is a stronger Euro).
Similarly, the Euro has appreciated against the (mighty) Swiss franc since the peg was broken (despite QE).
So, Bob, you’re flat wrong.
Also, I doubt you would be able to explain why the Euro has appreciated?
I would, but not here.
GM, I think most of us do the reading for the most part, or we would not be here. But in an infinite world of infinite knowledge, I like to find resources for areas that I am not well read. Nobody, and this part may surpise you, NOT even you, can know it all. The best value is those that can summarize and simplify a complex topic. And I fully agree it is sometimes hard to do that.
I do thank you for your opinion even if it is impossible to be delivered politely. I do find it interesting that the Euro has gained ground on the Franc. I did not realize that.
Just know that most all explanations in economics are gray and it is mostly opinions. We have yours in brief, but claiming Bob is flat out wrong is probably part of the arrogance/insulting issue you fail to see. I do not think anyone can make that determination unless you are the the Swiss officials that made the policy change.
I was pointing out that he was wrong about the Euro weakening, a sign of almost infinite stupidity and ignorance.
You asked a question, and couldn’t be bothered to visit another blog to do some reading, because ‘I am not really interested in currency’. As I mentioned before, you are a piece of work.
I have created an ‘ignore’ list, it just isn’t worth the effort to engage with people like you two, so you’re both at the top of it.
GM – the previous poster is right, you are full of hot air…a profitable trader you most certainly are not.
Jon, if you’d been here for more than 5 minutes, you’d know I’m not a trader at all, more a long-term planner.
You seem a nice *guy*, must be dozens of you lurking out there, with nothing to add but snipe?
You have my pity.
GM, Trust me when I say this, you are a very likable character. In the way you like a Tasmanian Devil, They make you laugh as they grumble and growl. You even forgive them when they bite you. Because you just cannot get enough of the humor of their poor behavior. Then watching others try to interact and laugh some more as they get bit. Your a hoot. Thanks for the information even if you growled and grumbled the entire way through it.
‘But in an infinite world of infinite knowledge’
LOL @ ‘infinite’.
The only thing infinite is his amusing faux-pas. A gift that keeps giving.
‘know that most all explanations in economics are gray and it is mostly opinions’
Mostly.
Hahahaahah The gift that keeps giving. “Mostly” I couldn’t have expected less. Thanks GM, I’m not done yet, I have more for you if you are interested. I know I am interested.
Valley,
are you not doing spreads..I was planning to get in with 199/201 for 30 cents.
No, just a 195.50 call that expires 9/25.
How exactly do you make this spreads?
Please?
9/21 7:06 pm Spiral update 9/25 low and another run to a top 9/29 or 10/1. Sean expects 2072 on 9/29 or 10/1
What is the Spiral and what is this low you are expecting?
Amazing.
GM, I thought you were ignoring. Or is the temptation that difficult for you to growl and grummble.
Spiral is the electro-magnetic flow around the Earth. http://www.ustream.tv/channel/7442-analytics
That is inline what I think too.. does Sean have a target for 25/9?
Hi John, I’m presuming that you are responding to Peggy’s post and in particular to the 2072 target.
Please may I ask how i.e. on what basis do you see that as a target?
My reason for asking is that today’s drop was not part of my EW count and right now I’m completely in the dark about ANY EW count…which is my main source of ‘forward guidance’.
Up until today’s drop I was expecting the markets to ‘chug’ higher albeit in a very choppy manner. Today has me flummoxed so any guidance from yourself, and anyone else who reads this too, would be very helpful.
Thanks in advance.
Sean of 7442 expects today (9/22) to be the low. I think it could push out to 9/25. price targets 1919, 1894 to 1899,
Sean expects today to be the low and back up to 2060-72 either 9/30 or 10/9. Then the big drop to a 10/28 low.
Interesting… I was looking at 10/28 because it is the FOMC date. Coincidence?
Peggy, are you following Sean, or do you have a different model?
I follow Sean but he is mostly focused on teaching the macro. I posted here at the high on 9/17 that it was “close enough” for me and I reversed my position (as I did again today).
Tonight (9/22) the new pulse begins. It is an in sync (with the background rotation) pulse – the first half (expansion phase) is “where the action is”. 9/22 to 9/30
Dryness growing in many diverse places pointing towards the Grains rallying/crashing up to a high Delta medium 2 point:
http://www.agrimoney.com/marketreport/pm-markets-grain-futures-rally-on-improved-us-export-signs–3304.html
Dryness trending towards Drought in Russia and Ukraine:
http://www.agrimoney.com/news/russia-ukraine-poised-for-more-dryness-stoking-wheat-worries–8794.html
Richard, are you still playing Sugar and Food Commodities? Last I saw you backed out of sugar. Completely or just temporarily?
The one commodity that has done quite well of late is rough rice. Unfortunately, the only way to play this is in the futures market, unless someone has another idea.
It was reported today that dryness in one of the two largest producing areas of India for Sugar Cane is so bad the Farmers are feeding the cane to their cattle instead of harvesting it for human consumption. This is why Rough Rice has been rallying since early this year.
I took profits on my longs and went short and just took profits on the short trade yesterday. I am still long Soybeans though slightly under water but I am thinking of adding to that position. Note that the distant months of Soybean futures are not breaking to new daily closing lows even though today’s excuse for November making a new low close is that Brazilian farmers are expected to plant more due to today’s new all time low of the Real versus the Dollar. Truth is that Brazil’s largest producing state has dryness that is delaying planting.
I haven’t posted this fact before but strong El Ninos are often followed by strong La Nina’s that produce drought in the Americas. The last strong La Nina produced a 30% fall in Brazilian soybean production.
It was Corn’s and Wheat’s Delta intermediate 3s that brought in their medium 1s and long term 5s and a Super Long Term point and I think that Soybean’s intermediate 5 is bringing in its medium 1, long term 5, and a Super Long Term point.
I am looking to go long Sugar again. Instead of its Delta intermediate 3 bringing in its long term 3 and a Super Long Term point I am looking for its intermediate 6.
ADM is down -2.6% today, so I still don’t see how you can play this.
Compare a six month daily chart of November 2015 futures to the November 2016 futures. Not only is the 2016 at higher prices but in recent days it did not even get close to a new low daily close like the 2015 did. Better yet, draw Trend Lines and compare.
I neither work for or advise ADM. Strong El Ninos often give rise to strong La Nina’s and the last strong La Nina caused a 30% decline in Brazilian soybean production.
Richard, Just know two things that may wrinkle your planning. This El Nino continues to be downgraded in latest model runs. Probably closer to ’57-58 years. There is not a strong link that a strong El Nino brings a strong La Nina. Check out this web link to see for yourself.
http://www.cpc.ncep.noaa.gov/products/analysis_monitoring/ensostuff/ensoyears.shtml
My sources of long term forecasting have not really predicted a La Nina yet, but it is certianly a possibility. I still expect the typical El Nino weather event changes for this El Nino, but it may not be as intense as initially expected.
Thanks for your commodities review.
Valley,
looks like we should have been more patient and as PALS dictated waited for tuesday EOD to enter the trade.
Bill
Valley’s short term trade scenario could still play out. The only issue I have is that he used Sep 25 Fri as a full moon date leading him to buy 4CDs prior on Mon Sep 21, which is a tad too early but would be okay if it was a big down day and instead it turned out to be a surprising up green day. However, the full moon actually happens over the weekend on Sep 27 Sun and 4CDs prior would imply buying it on a Wed Sep 23 low (or possibly even today after a 30+ point sell off).
The only reason I can see for using the date of Friday is that it is the last TD prior to Sep27 and sell-offs typically occur starting ON the day of full moon, and thus implies Mon Sep 28 could potentially be a gap down day and too late to exit if one waits over the weekend.
Anyways, my initial forecast about two months ago outlined three potential periods for weakness in Sep. Sep 11-14, Sep 21-23, and Sep 28-30. The mid-Sep period turned out to be an up period (not shocking IMHO due to the Shemitah doomsday hype all over the Internet) and surprisingly yesterday Sep 21 also turned out to be a slightly up day too when it should/could have sold off hard.
Mercury retrograde is presently in full effect from Sep 17 to Oct 9 and thus big, rapid swings both ways typically occur with a bearish weight during the first half and a bullish weight during the latter half, although it does not have to happen like this and can be more negative right up to near the end of the phase. The last three instances of Mercury retrograde occurred May 19 – Jun 11, 2015, Jan 21 – Feb 11, 2015 and Oct 4 – 25, 2014. You can do your own research as to what transpired during these three week periods.
Also Sep 16 to 30 is a negative lunar phase for equities and thus best case is for stocks to trade sideways and SPX would be capped off at around 2000 in the best case scenario for bulls until then.
True, Bill. I am not out anything cause I did some day trade of position to avoid losses. But that said, trading psychology is key to success and following system less stress and probably equally as profitable than trying to improve on it.
Since the 5/20 high 2134.72, the Elliottwave count is 1 2 (1) (2) then a collapse to 1867.01 (3). Bullish forces rallied around 68% 2020 completing (4) the decline is resuming and the low thus far today is 1939.75. Wave (5) or 3 should be below 1867.01. What specific happenings overnight in Europe or Asia to cause this sharp decline is unclear. The trend remains down.
libadvsor, please do you have count of the waves since last Thursday’s 2020 top? That’s the bit I’m struggling with as I still can’t count a clean 5 down from there. Just lots of multiple 3s.
Thanks in advance.
Perv: SPX from 2021.5 has 3rd leg down (open gap in 1st & 3rd) with 3rd unconfirmed as complete at 1929.1 and presently short covering 14h45 EST
Whats the problem there?
I have a teeny tiny request please. I would like to request posters who make comments and are then questioned or requested for further information by other participants to respond to those questions/requests.
For example I asked John today about how he had arrived at a 2072ish target but got no response.
Equally libadvsor provided some information and I requested clarification but no response either. I see that Peter_ has responded to that particular query so I will look at that in a moment.
The whole point of participating here is to have a flow of to/fro info so that we can all learn from each others thought processes.
Thanks in advance.
Thanks Peter_, the reason I’m struggling is my ‘bias’ is currently for an ‘UP’ wave and hence today’s down wave didn’t jive with my count.
Also I’m still seeing perhaps a double zigzag W down and another double zigzag Y down today….so I’m still struggling to see your 3rd down.
I always start with the daily chart and drill down the ticks only as far as of any further interest. My take was/is the turn down commenced 16th pre-FED with a nudge on the upper boundary of the triangle which posed a false break the next day which confirmed with the traverse to nudge the lower boundary the following day and the test of that the day after and here we are on the follow through, Its a textbook move. So the B has good form and this is the commence of the C. I expect 5 legs to target 1820ish. Which I will continue to work freely with for only as long as it behaves within the days parameters.
PS – My 3rd down describes the 3-leg move down = down/up/down.
HI Purvez- From 2020, I have 1 to 1953 2 1979.64 followed by I ii iii and we appear to be doing a ‘iv’ wave triangle which when completed will make new lows below 1929.22 completing wave 3.
Besides the VW situation, the following article may be what is beginning to leak out and spook the DAX and other European markets. Japan is closed until Thursday.
http://z3news.com/w/indications-major-financial-event-germany-imminent/
Err…the website slogan is “END-TIME NEWS BEFORE IT HAPPENS”
Yea I get that and all regarding end of times and bible prophecy and stuff. What got my attention was the timeline of events that have occurred at DB which are facts that can’t be argued with.
MN, thanks for sharing that. Yes the next ‘panic’ is going to come from the financial sector….again. Although the ‘housing market’ got blamed the last time it was really the SUB PRIME LENDING by the financial sector that brought it all down.
I’ve got a healthy enough short set up (for me any way) if anything quick does transpire.
Comments on CNBC indicate emerging market problems appear to be today’s catalyst. Retired Fed board member Fisher believes Yellen’s stance has confused markets and indicates her fears of a weakening economy. He believes the economy is strong and thus rates should have been raised a notch. Apparently, the Volkswagens mis-deeds is a factor. Does not make sense.
Technically, the 100 day moving average (S&P) is fast moving to break through the 200 day ma which confirms a furthering o the bear market. Monthly, the MACD and RSI indicates price declines has a distance to go.
window still open through the end of the month
Are you still refering to the Puetz crash window?
ja
Some possible targets for today’s down wave. If it equals the down wave from Thurs 18 Sept high to yesterday 21st Sept low then the target on the DJIA IS 15976. Which incidentally is very close to the bottom of the previous failed triangle’s base.
At 61.8% in length it would target 16200ish and at 76.4% it would target 16120.
Let’s see what the market really does.
SPX hit a low of about 1955 on Sep 18 down 65 points from the peak shortly after FOMC and VIX hit 24. Today SPX hit an even lower low of 1930 yet VIX cannot even reclaim the prior high of 24. That tells you all you need to know about the short term future …
Very good observation Steve T. However there may be a small degree down yet to complete.
Yes, but the implications are that 1900 will likely be a strong support level that holds (at least for the first bounce).
Oh absolutely. I wasn’t thinking of going anywhere NEAR 1900. 1910 at a stretch.
I find VIX too sluggish and mysterious to be of any immediate use.
The following was meant to be posted as a stand alone comment but somehow got posted as a response earlier. Sorry about that:
=====================
I have a teeny tiny request please. I would like to request posters who make comments and are then questioned or requested for further information by other participants to respond to those questions/requests.
For example I asked John today about how he had arrived at a 2072ish target but got no response.
Equally libadvsor provided some information and I requested clarification but no response either. I see that Peter_ has responded to that particular query so I will look at that in a moment.
The whole point of participating here is to have a flow of to/fro info so that we can all learn from each others thought processes.
Thanks in advance.
Leuthold Group: Stocks ignored alarm of widening credit spreads last 12mos. August sell-off closed big divergence.
https://research.stlouisfed.org/fred2/series/BAMLC0A0CM
Have we been having fun?
Hi geno, nice to hear from you. I hate roller coasters in real life but financial ones are great fun.
Have you got a count at the hourly or lower level for the S&P since the Thurs 17th high that I could consider please?
This evening’s bad economic news out of China caused DOW futures to drop over 100 pts. but hardly moved Copper or Crude. So, now, the question is has all the bad Chinese economic news been factored into the price of Copper and Crude and does that mean that it soon will be for American stocks too? Hmmm, anybody know?
Are you thinking of revising your 1/2016 ATH stock market call?
Honestly, I think we can rally from here, though not ATH.
No, last night neither Copper, Crude, nor Soybeans sold off with the bad news out of China like they normally would have done. This indicates that they are at major Bear Market lows and it is only up from here. This morning not only are all these Commodities up but so is American stock futures like the DOW.
Peter_, I’ve seen your latest SPX daily chart. Are you able to provide a more detailed view of what’s happened since the red B on the 17th Sept, please?
The decline from there looks like 2 double zigzags to me rather than a single big impulse wave for your ‘C’.
Thx in advance.
Did u see reply yesterday – in the thread..
What tick rate are you on for your counting?
So now there is a perfect channel with 2 gaps. Should we not all go long here? You should be telling me all about it.
Peter_, that is my stance. I’m going long here. However I’m still trying to understand whether you are expecting a 5th wave down or are accepting that we are still in the midst of the ‘B’ (in your case or the 4 in mine)?
Today’s out of hours action has already taken the up wave from the end of ‘3’ into the price territory of 1.
This is all too confusing for my 2 brain cells. I’m going to retire and contemplate on my navel for a while.
It can bounce from the lower channel boundary like futures suggest, it can close the gaps but 2000 is a tough nut. Regardless the C wave got a long way down to go.
Yes Peter_ I did. Sorry for not acknowledging earlier but right now I’m not on ‘home soil’ but on ‘birth soil’. So a bit disorientated AND distracted.
I’m usually at the 5m level but the hourly one would still give me enough info.
Anyway, at the time of writing, I’m long with a very tight stop on the DJIA. (Stupid time to take a position….it’s just gone 2 minutes past opening bell!! – did I say I was distracted?)
Got that, and figure its the SPX futures chart. The thread travels down the screen almost as fast.
For Deltoids here is a very rare and difficult call: As of yesterday, in the past several weeks, all the major Grains have made a Super Long Term low “wave” point and, of course, are turning back up in major Bull Markets. I also think that Copper and Crude have also made recent Super Long Term low “wave” points too. All of these low Super Long Term “wave” points is going to translate into American broad stock market buying as “a rising tide raises all boats” which means that the DOW’s long term 2 point is a low –and early– and that means that the odds are high that the 3 point will be a new ATH.
It’s not a difficult call for you Richard, you have made the same call (with different reasoning) every couple of months over the past year. Always been wrong so far, but good luck with the latest effort.
Yeah, I thought “what if” August sell off was the September sell off just off set one month early. Complex bottom that persists on SPX gives pause tho’ as it is more consistent with further weakness. Your Grains idea could be enhanced by Jupiter’s entry into Virgo which is sign pertaining to Grains and Agriculture. According to the theory Jupiter is the planet of “increase”. So at least there will be more Ag attention next 12 months.
Peter_ and purvez, thanks for your EQ long-term thoughts.
A few thoughts of mine:
I see the markets move in 16-17 year cycles, and the current bear cycle began back in 2000, so I think a major decline lies ahead into 2017. But another marginal new high in the new year is possible, maybe even a blow-off to 2400ish. Tough call.
I then agree with Pug & Martin Armstrong, we will enter a bull cycle for stocks through to 2034ish, but it’ll be a *nominal* bull only, in real terms, zero gains and losses. Will we ever hit sub 600 on the S&P, I doubt it, due to currency devaluations.
I’d like to request from JH please a post with some thoughts on the longer-term, as I believe solar cycles are getting weaker and weaker, maybe into a mini ice-age, as demographic pressures reach a potential tipping point. 2020 Olympics in Japan makes me think about their finances, and how that could be a pivotal issue.
Peter_, re your comment:
‘Credit is endless in a ZIRP environment and less. As for the power of collective morality I would not believe it even if it invited me to dinner.’
Credit isn’t endless, and the BIS/FSB are already turning the screw on banks’ balance sheets, quite openly, and bear in mind the CBs sit on the board of the BIS, so they all know what is coming down the road, and they are doing the steering, as best they can, given the whims and desires of people and their feeble political leaders. Banks create credit, not the CBs.
As for collective morality, that died a long while ago, if it ever existed at all, and Oliver Stone succinctly identifies the threat the lack of ANY morality poses for the world in the decades ahead.
EW, rather than EQ of course.
Guessing deleveraging is given as a failed objective and risk-laden. So it does not happen. The entire safe return path for the systemic risk needs an ingredient that the ZIRP fails to provide. You gotta make it even easier then, not? Methinks this is an area where wise men should fear to tread in case the truth is too hard to bear.
Well….then it’s a good thing that the intrepid FED are not wise. Good for the ‘banksters’ anyway.
Thinking about it I could take up a FED position. With my 2 cells limitation I would be a prime candidate. I could happily ‘nod away’ at everything put in front of me.
Aaah the life that would be.
Peter_, deleveraging has happened and is happening, via bank balance sheets mainly.
Total debt has only risen due to sovereign debts rising in the past 10 years.
Let’s review after the end of the next recession which is underway.
I bet debts will have been destroyed and some will have been snapped up CBs.
Either way, the debt super-cycle is on its last legs, having dwarfed the real productive economy long ago.
I will do an ultra long term post at some point yes
Thanks. I’m 48, so 35 years should suffice!!
GM, totally off topic but what is ‘magical’ about 83? I would have thought 17 years latest would have been more to your liking, no?
purvez, just an estimate of my longevity, nothing more.
It would coincide with 2x 17 years cycles from 2016, but that’s an after-thought.
GM, I’ve read that the first person to reach 1000 years (yes a thousand) is alive today and in his late forties to early fifties. That’s what the Biotech revolution is offering!!
So I would be very wary of ‘short changing’ yourself here. 🙂
Only if I could move to a nearby planet would that interest me p.
This planet is FUBAR.
Purvez, I’m buying the dip today.
Aah good we seem to be on the same track for the moment.
How can it be a B? No buzz?
http://barestbodkins.blogspot.co.za/
Peter_, I believe that we will have another trip to the top of the channel (based on the way it is currently behaving at the base of the channel). THAT would then be your ‘B’ before we head down to your ‘C’ side.
Ugh you’ve me doing it too. LOL.
Expecting runwaway move up in gold, especially after it breaks 1150 to the upside.
USD should tank and drag US equities lower.
I will not cover shorts before SPX 1570-1590. Stops at last week’s Fed high
Should take a look at NEM down here in the 15’s
Thanks, Chien-Jen. Might you consider overlaying interest rate spreads on your graph? May give a purer representation of what’s occurring in bond markets as opposed to govies.
https://research.stlouisfed.org/fred2/series/BAMLC0A0CM
https://research.stlouisfed.org/fred2/series/BAMLH0A0HYM2
Interesting!
Thanks – wish the data went back further but it is what it is.
https://research.stlouisfed.org/fred2/series/BAMLH0A0HYM2
Chien-Jen, what about overlaying the Japanese yen as indicative of the carry trade? May not have much meaning past a certain point in history, I realize.
Question for Valley: does how well this week’s signal work give any indication to how well the next signal performs?
Assume for the moment the positive signal for this week does not work well and you have a negative signal for next week. Does that negative signal take on even more negativity so to speak given what occurred this week? Or is there “no memory” from week to week with the system?
Yes, Gary that is correct. A positive week that goes negative is more of a set up for the following negative week to be down more than normal. Not every time though so I trade same lot size all of the time and only add leverage intraday on certain days based upon intraday seasonals (intradayseasonals.com).
Great question, like the answer too.
this ?
http://stockcharts.com/h-sc/ui?s=%24XJY%3A%24XEU&p=D&st=1998-01-01&en=1949-01-01&id=p24294347655
http://stockcharts.com/h-sc/ui?s=%24XJY%3A%24USD&p=D&st=1998-01-01&en=1949-01-01&id=p33546671511
Oil & Nat Gas Update:
Oil has consolidated and is in position to break up or down. My preference would be down to retest recent lows and hold befoe beginning the longer term up back to the $60-70 range in 2017. My belief is it will break up, but it is not a strong belief. I am not buying oil, but if I were I would wait for the retest of the low and start buying if it held. The main damage is done in oil and OPEC will start working the price up now that the US has already decelerated production and still is. Demand remains healthy.
Nat Gas (UNG) This is a tough week to judge. Injections reported tomorrow will most likely be strong around 100 Bcf. Prices are already dragging the low side, so any downside will not stay there long. Production has been fairly robust and demand is going to soften from fall cooler weather. I am holding my trading longs for the most part, but I may sell the last purchase from Monday today for a small profit. I have not decided yet. I will see where the day goes.
I am holding my nose and holding the 25% short term trading long on Nat Gas from Monday.
If you had only one trade for this crash, what would be the best bet?
Long agri
Long gold
Short biotech
Short China
Any others?
I’ve gone biggest on this one:
John H, on the technicals alone you are 110% correct. However I have a relative within the Biotech field (basically a nerd) and what he tells me about the ‘breakthroughs’ coming through I suspect this thing could change course AT ANY MOMENT and head higher.
With Biotech you need a very TIGHT leash or a very DEEP understanding of the technology. Hence my aversion to it. Also it all depends on the individual company. The sector could go down but the individual companies could soar. So pick your sows carefully!!
Just to emphasise what I’m saying about Biotech. My relative is ranked 3rd in his field in the world. You wouldn’t guess from looking at him though!! Totally unassuming and the nicest guy you could ever hope to meet.
Agreed Purvez, A very tricky sector on an individual basis. Being value oriented, I stick with companies that actually are making profit and that rules out a bunch of Biotech companies for me. As a sector, I think it is time for a wash out of companies that have been valued to artificially high prices on very little basis. I see this sector as similar to the Dot Com Bomb. I haven’t a clue which companies those are, but I am convinced that others do. For me my Biotech play is long CELG, hopefully on a panic down day. I have made good money on CELG and missed some of their top, looking to get back in at a good price and we are close. $90-100 as a target, but if we get a panic drop hopefully better.
Thanks JH. You might know that “the big short” is now an all-star cast movie next year. Wondering what our big trade will be. Your graph makes sense….
John Li, good question.
I’d go for long on short-maturity USTs.
Hypothetically.
From an academic standpoint, I am most confident on short China, but due to high borrow costs and high put premiums, even though the market is down August, China bears have lost.
Volatility VXX
Japan has a 2 day catch up later. Doubt that they will pleased. Unlikely to turn this thing around, quite the opposite I would expect and the moon gonna bleed too.
Difficulty in navigating word press. For Purves:
count from 2020 is 5 wave move to 1953,45 for (1) (2) 1979.64 followed by I ii iii 1929 now doing a 4th wave triangle. Breaking 1929 to new lows will complete wave (3)
Thx libadvsor. Don’t know when you finally managed to get this posted but the triangle from 1929 is bust because the ‘c’ wave went above the ‘a’ wave end…. unless you are suggesting an expanding triangle.
Also on the smaller time frames (5m / 1h) the (1) down to 1953 looks very much like a double zigzag. Of course as EW wavers that’s just semantics until one or the other is proven otherwise.
Thanks very much for your response. Very much appreciated.
from 1929.22 ‘a’ up 1949.52 ‘b’ down 1932,57 ‘c’ up 1945.37 ‘d’ 1936.37 expecting ‘e’ up a bit before the move to wave ‘v’. This is for purvez
Thx libadvsor. Whilst your count is very valid, but for the ‘a’ to be so large (particularly as an expanded flat) and the rest to be so small makes the triangle quite a bit lop sided. As R N Elliott would say….doesn’t ‘look’ right. Still it is within the rules. Let’s see if we get the ‘v’ down move.
Very much appreciate your continued responses.
libadvsor, we DID get the v down!! Well done and thx. Now let’s see how far up we can go.
GM: Thanks for responses, pause to assimilate…
deleveraging has happened and is happening, via bank balance sheets mainly.
….Total debt has only risen due to sovereign debts rising in the past 10 years.
A year ago Russ Koesterich wrote of the US situation: during the period of so-called “deleveraging,” non-financial debt has increased by roughly $9 trillion. Six years ago, non-financial debt was around 227% of GDP. Today, it’s at a record 250%
Hope you right that this ongoing Great Recession can be made to change course to reverse this before you reach 83? So far the medicine does not work and the patient lingers with ineffective treatment and my confidence in the powers that be follows the results they obtain.
Morning Peter_,
Yes, I know in the current cycle global debt has reached all-time highs, but that is only c.70% of the picture. Banks are deleveraging their balance sheets, the big boys. That’s shadow debt vanishing. Meanwhile govts are filling the void. That picture to be exacerbated by the incipient recession.
No, I’m not sure it will be reversed, the world will go to the limit on this, I am reading more and more thought pieces on QE-funded fiscal policies, AKA Corbyn’s ‘People’s QE’.
I wholeheartedly agree with M Armstrong here, it’s governments/socialism gone mad, but still running the asylum. Will we reach Mad Max?
I ask questions about the longer-term as I am trying to work out the sequence for markets and currencies and the timescale involved. When will the markets wake up to (for example) Japan’s 100% printing, and the UK’s trade deficits, and eventually the US’s trade/budget issues.
Off topic, but a bolthole from the madness for retirement does occupy my mind frequently. Somewhere I could start a little farm in the warm.
http://www.financialsense.com/contributors/doug-short/brace-yourself-our-latest-look-student-debt
A trillion here, a trillion there, pretty soon you’re talking serious money.
Keep an eye on the yen, says Peter Brandt and I agree:
this?
stockcharts.com/h-sc/ui?s=%24XJY%3A%24XEU&p=D&st=1998-01-01&en=1949-01-01&id=p81271410851
stockcharts.com/h-sc/ui?s=%24XJY%3A%24XEU&p=D&st=1998-01-01&en=1949-01-01&id=p64944039323
stockcharts.com/h-sc/ui?s=%24XJY%3A%24USD&p=D&st=1998-01-01&en=1949-01-01&id=p53189848371
stockcharts.com/h-sc/ui?s=%24XJY%3A%24USD&p=D&st=1998-01-01&en=1949-01-01&id=p08689144031
I’m thinking vs equity indices
Today’s future’s break below yesterday’s lows now shows what is transpiring in the DJIA, at least. This is turning out to be an Ending Diagonal. Expected target low would be around 16050 or just lower. Once that completes I would expect the index to recover all the way back to intra-day high on Thurs 17 Sept or just over.
The count on the ‘bigger picture’ would be:
‘A’ from Aug 24 low to Aug 27 high.
‘B’ is this current meandering wave (a flat) from Aug 27 high which in itself consists of an ‘abc’.
‘C’ will be the wave that goes from wherever this one ends to a corrective high. One possible way of arriving at a target for C would be to take the height from Aug 24 low to Aug 27 high and add that to wherever this one ends.
Now let’s see what the market really gives us.
Perv man I would really like see what you try to say. Use of caps really throws my mind. Charts are everything. Sure we always see what the markets give us – thats a signal for I really not sure at all bout any of this.
Peter_ yes your final bit is absolutely correct. It’s my basis for trading the markets. I have no ‘firm ideas’. That way I can change at a moments notice and I often do.
Yes charts are everything but I can’t seem to find a way of posting from the ones that my trading service provides. What service are you using?
SPX (not futres) my take is the C in the Primary 4 correction is afoot as my chart.
Expecting 5 sub waves and there are 3 gaps already. If sub 5 = sub 1 then 1880 presents at the full channel boundary.
So I expect the 5th to take a Fib ratio with the 1st.
What ratio do you think?
None because the equal legs abc has a momentary tale, speak
Here’s an attempt to connect to a chart that I’ve created and then uploaded to a hosting site. Let’s see if it works:
http://postimg.org/image/9hfoay5vl/
Ha, it worked. Now Peter_ you are hopefully both better informed and in a better position to ‘shoot me down’.
Got that, thanks, well done, good stuff.
The answer will soon arrive, but my take is it should be same count as SPX
It just appears more eager to collapse.
I use Jing. You use it to capture a screenshot (your chart) and then post the chart in a library. When you do this, it puts the URL of the posted screenshot onto your clipboard which you can then paste into a comment. Readers reading your comment can click on the link and your chart will come up for them.
You can download Jing for free: https://www.techsmith.com/jing.html
I can understand ALL of that. Praise indeed. Many thanks…..but I reserve the right to change my mind. 🙂
Thx pimaCanyon, I’ve seen Jing being used here before but thought it was a charting service. Anyway if what I’ve found works then I’ll continue using that as it isn’t asking me to have logins and registrations etc.
September 17 is a big retrace! Struggle to see how it will reach that but only way to know is wait and see. I’ve taken a gamble long at 16030 with a stop at 15995. No target but trail the stop. Pure gamble this. Nothing in the charts tells me to place this trade or not to. Just got a feeling we will have a pop very soon.
Good trading of late krish, hope that continues for ya!
CAT cuts 2015 guidance, in case anyone is not aware.
Some brutal falls in the MCX today.
This is a core stock I am watching to buy back in. If it falls enough to provide a 5% dividend, I will evaluate if it is time to start slowly buying in. There is some concern about their dividend, but I am skeptical they will reduce the dividend. It is not there yet, but I am watching closely now. This is a very well ran company and this is just another sign of economic trouble, but they will manage the slow time well as they usually do.
Next target 15800 for dow. I reckon it will bounce and touch 16125 before falling all the way to 15800. After that its possibly new lows. Watching for signs of overbearishness as that signals the next significant bounce. Took profits on my 16410 short at 16125 as per target in my previous post.
Following on from my earlier post about the DJIA being in an Ending Diagonal and my link (first successful) to a local chart would appear that the ED is done.
However as of 18:57 BST my 5 minute count is suggesting a further LOWER down at least.
At that time I’ll evaluate whether the ED is complete or not.
OK scratch that. At 19:54 BST I’m back to thinking there is no further LOWER down than today’s intra-day low.
I’m expecting a pull back around now but not expecting it to go to a new low.
Please can I have some feed back about whether any of these ramblings are of any use to anyone? I recognise that my trading style means lots of intra day change of ‘mind’. But when you are following 5 minute charts then that’s the ‘game’ you have to play.
I’m happy to stop posting all this nonsense here if it’s of no use to anyone. I will NOT BE OFFENDED. Just relieved!!
Posted a comparison of takes, just comparing sharing. I see this move as key to the bigger things on many takes. http://barestbodkins.blogspot.co.za/
Very nice of you, Purvez, to ask. For me, since I don’t trade in such short time frames it’s not useful but neither does it bother me. I leave it to the other short-term traders on the blog.
Peter_, yes I’ve been considering whether the ‘Ending Diagonal’ may well be a ‘Leading Diagonal’? I’m fairly certain it’s a Diagonal….just at this moment can’t work out which one it is.
Certainly it could be a Leading Diagonal (rather than a a,b/a,b etc or even a 1/2, 1/2) in which I would still expect a deep retrace but NOT go above the Thur 17 Sept intra day high. The retrace would have to be at a MINIMUM 61.8% but probably nearer 76.4%
Now let’s see what the market really gives us.
Purvez, I am similar to Gary, I do not use it, but I absolutely find it interesting to watch.
Gary, appreciate your feed back. I plan to scale back on all this rhetoric and see whether anyone notices.
Most of the EW passes me by, but I enjoy reading your thought processes nevertheless.
Boom! Over bearish bounce has arrived/FED just pumped loads of cash into futures! Short at 16445. Aiming for 15800 with this one.
Krish, any stop loss point?
Not at the moment. I’ve made around 750 points recently trading Dow so can’t withstand a bit of a loss. Will see the market action and then manually close if I think it’s not working out. I think this is a short term pop and should reverse next week so let’s see how it goes.
Great trading Krish congrats. The DJIA futures just retraced 50% from the 17th Sept high to yesterday’s low at around 16470ish. On the 5m chart it looks like w-i just completed. IF that’s the case then a retrace of around 50% of the bounce from yesterday’s lows would bring it back to 16250.
You are really doing well Krish. Wish you continued success.
Krish, I’m having to change my mind about w-i having ended. I think we will have another high (can’t tell it’s target) before w-ii down will begin.
IF it turns out that way you may want to step aside from your short now or at least hedge.
Closed that short at break even. Dow recovered after the drop and don’t want to hold over the weekend. I am bearish so will just find another shorting opportunity next week. Hopefully futures won’t open down 300 points Sunday evening as that will be annoying!
puetz window still open through 9/30
and don’t forget something mentioned by others here
armstrongs top is 10/1
Screen broken – no need to shout
The message content is as vulgar as its delivery
squeeze me?
probably a good place for a bounce in the indexes
but biowrecks might not
Oil continues to consolidate and should break up or down soon. Nat Gas (UNG) took the big injection numbers well. I think Nat Gas continues to scrape the bottom until something motivates an upside. I expect spikes on any news that indicates lower production and/or higher demand. This is not the season for high demand, but any cold weather reports could create a spike upwards.
El Nino and Natural Gas:
http://finance.yahoo.com/news/el-ni-o-could-turn-154927927.html
Thanks Richard, The US should be warmer in the North and much much colder in the South, with a significant chance of cold along the East Coast. I expect a normal Nat Gas Demand year, but will not discount the possibility of less than normal. What is great about Nat Gas is how it likes to spike on a weather event that was not predicted. I feel pretty comfortable we are in and around the lows and expect spikes along the way.
Best example of disconnect between Media and to a lesser extent the market, is that the El Nino continues to get weaker on every run and it may even fail to be the 3rd strongest as the better media reporters have reported. Time will tell. I am still expecting the typical weather patterns due to an El Nino.
Valley,
Are you exiting your long now or waiting till friday .
Bill
PALS is unusually positive Friday.
Thanks … I went long around 1914/15 and exited longs around 1935 .. I have some longs from yesterday waiting to bail out tomorrow ..now big confusion do we wait till monday to get better price.. I am thinking if its strong friday bail out 75 percent long EOD friday and rest for monday. How does next week look for PALS.
I dont want to place short untill we see 1975/80
Bill
No idea what the markets will do next here.
But look at gold and its miners today.
Money appears to be moving.
Jafree
US oil prod is falling off faster than most realise. In the short term people will take this as bullish, although not for too long because peak to trough is prob going to be -1.1MMbpdoe in a world oversupplied by 3+ (currently).
J
Agreed, US production is falling fast. Also Saudi has backed down to their normal expected output instead of their puffed up unachievable comments. Iraq is not growing their production as fast as expected and Iran will be coming on line. With all that uncertianty, I choose to stay out of oil, but I do believe we are near the bottom and will get back to the $60-70 in 2017. Saudi plan is working and US tight oil (fracked oil) is getting slaughtered. If all these suppy uncertianties do not find a balance point and a trade war ensues, we may very well see a down turn. Interesting times in Oil for sure. I will continue to watch and not trade this area.
“Strong” El Ninos (drought in Asia) are usually followed by “strong” La Ninas (drought in the Americas):
http://eldoradocountyweather.com/climate/world-maps/world-drought-risk.html
You told us the exact same thing yesterday.
Or was it the day before?
Or both?
Richard, Did you get an extra cup of coffe this morning?
Similar response to the last time you posted this article.
This El Nino continues to be downgraded in latest model runs. Probably closer to ’57-58 years. There is not a strong link that a strong El Nino brings a strong La Nina. Check out this web link to see for yourself.
http://www.cpc.ncep.noaa.gov/products/analysis_monitoring/ensostuff/ensoyears.shtml
My sources of long term forecasting have not really predicted a La Nina yet, but it is certianly a possibility. I still expect the typical El Nino weather event changes for this El Nino, but it may not be as intense as initially expected.
This weekend’s Full Moon will be a Super Moon that is Eclipsed. Doesn’t that mean a major bottom to be followed by a significant Bull Market to new ATHs?
Is it possible that it will negate or turn the October geo-magnetism turbulence from the usual sell off to a buy up?
I am surprised that no one has been talking about this weekend’s Super Moon and what they expect the stock market after effects to be.
Valley, would you have any perspective on this Super Moon that Richard I is mentioning, please?
Your positive PALS for Friday call jives with my EW call for a corrective up wave.
I love it when a plan comes together!! 🙂
A “Super Moon” is the brightest Moon of the Year. This year’s Super Moon will also be an eclipse. In addition to that fact, due to the 18.6 Lunar Declination Cycle, from an Earth Centric point of view, for three years, the Moon is going to rise and set near the Equator. I question if all of this is going to cause an October geo-magnetism “inversion” so that stocks don’t “crash lower” but “crash higher”.
I think that research into how that 18.6 year Lunar Declination Cycle effects Geo-Magnetism needs to be done.
Thx Richard I, for the details. My question to Valley was meant to enquire what the effect on the markets would be.
I believe we are going to have a down-thrust starting early on next week. Cash SPX from 2134.72 has an impulsive count 1 2 (1) (2) (3) (4) and (5) 3 is in process. 100 day moving average is crossing over 200 ma. A big decline is imho about to be unleashed. Some folks of analytical merit I follow see a low on 10/20. Two others of great repute see ‘a’ low October 19th. My view of monthly charts including MACD, RSI and Stochastics sees extended declines for another year or two.
This might balance some bullish/turnaround views seen here.
Who bribed her? Sure the committee has changed its position en masse because of all the great progress being made since last comedy show. Was it dehydration or a tweak of conscience?
Peter_ my take is that since a no rate hike tanked the market, she is now testing to see whether talk of rate hike will bolster the market. Since the market is up today, she’s going to take that as ‘the sign’.
Unfortunately the poor idiots are going to get wrong footed when they DO raise because the market will tank then.
They should read Valley’s PALS.
Will someone give the microphone back to Draghi so normality can resume?
Caldaro tells us that SPX 1953 is important.
http://www.huffingtonpost.com/entry/janet-yellen-medical-speech_56047a21e4b00310edfabda4
Worth watching the video.
This woman is weak, she is uncertain, she is panicking.
She realises she’s going to be the fall gal.
She is an old woman, how apt for what lies ahead for the dollar, weak and approaching death.
Amazing, but maybe I just have a vivid imagination.
A defining moment, along with The Draghi incident, panicked by a woman throwing confetti. Listen closely, you can hear the revolution beginning.
Yellen has always looked vulnerable as a person to me, unlike her smarmy predecessor Brainkranky. Feel sorry for her but even sorrier that it didn’t happen to Brainkranky.
purvez, I have no doubt what so ever, that Heli-Ben will get his place in history as the largest contributer this truly unprecedented time in Balance Sheet history. Yellen was dealt a bad hand.
Yes JaFree, a double whammy for the male c%$”@nists sadly. I personally would sleep more soundly if the entire civil service was run by women. THEN I’d like to see how the male politicos behaved.
Purvez, i agree. perhaps the ropes and street lamps will still find him
GM, Any chance we could get an executive summary on how the Euro becomes the next world currency. I know you posted a link and I chose to not read it, because even if I did, I may not come to the same conclusion as you, so I was hoping we could get a summary of your ideas on this area. Simplification of the complex is ok.
JaFree, I’m bemused by your request to GM. As I said in a previous post, the currency markets are the most sophisticated. To request a ‘simplification’/’executive summary’ is somewhat naive.
My experience of ‘generalisation’ of an extremely complex topic leads to just …. MISUNDERSTANDING.
purvez, I will have to disagree in part, my view is that if you really understand a topic, you can summerize and simplify. The part we agree on is that a simplification can lead to misunderstanding. However, that should not stop a person from an overview. Otherwise we as a people would never be able to explain science to people not educated in science. A great example for today is work in fusion. Helion and Lockheed Martin are able to present their ideas in a manner that does not fully explain the technology, but they are able to explain the overall approach to the solution in an understandable form and it does not get much more complicated than fusion.
I think GM has his idea well worked out from his studies and all I was curious about was his general overall viewpoint on how we go from today to the Euro being the next world currency.
Specie, whilst I agree with your sentiment, I don’t want to wish ‘ill’ on his family. They’ve suffered enough already!!
Waves invert all the time as anyone who knows Delta can attest too. Cycles seldom ever invert but when they do the moves can be incredible. If the October cycle of Geo-Magnetism is inverting then the “crash” up could be one for the history books and a complete surprise for many on this site.
Currently; is Father Sun WEAK and Mother Moon STRONG??? Does this mean an October Geo-Magnetic INVERSION???
The recent past shows strong correlations to rallies up to New Moons. Is this October’s New Moon going to be a rally that dwarfs the rallies up to the New Moons of the past several years?
And what does it mean if stocks bottom four days –before– a Full Moon instead of the usual four days –after– a Full Moon?
Could it be that the recent stampede at Mecca is a sign that the October Geo-Magnetism is going to cause a rare Inversion in stocks?
Richard I, me thinks thou’st trying to convince thyself too hard.
I don’t understand what “inversion” is, but I agree with you that stocks can rally in October. In fact, many people are predicting it, eg. JPM.
But to clarify, I think JH is right that any rally is a second chance, and not all-time highs.
Anyway, the sun is stronger today, not weaker, which is why stocks can rally in the short run, which is contrary to what you are saying.
http://sidc.oma.be/silso/
Sunspots back to 158.
Do we need to make regular subscriptions in order to find the answers? If so, pass.
If you are asking me about JPM, the link is below.
http://www.zerohedge.com/news/2015-09-24/bears-beware-jpms-head-quant-just-flipped-bullish-technical-buying-begins
Hi Richard,
I am with you on this one. I think we will go up hard until 29-30 September. 😉
Cheers,
W
Peter_ I’m not sure what it is ‘exactly’ that you are looking for. (your track record precedes you!!) but if you want to know about extra terrestrial stuff ‘at no cost’ then this is one site that I would heartily recommend.
http://www.suspicious0bservers.org/
Thanks old chap. For your kindness I will leave you a mini ice age in my will.
Thanks for your generosity Peter_. I don’t know how old you are but I suspect the mini ice age will be of no use to me.
The Biotech ‘prophecy’ of living a 1,000 years (if within late 40s early 50s now) passed me by some time ago.
I’m content with my lot.
No, no!! wait a second Peter_. I’ll accept the mini ice age. Maybe I’ll be cryogenic-ally preserved there. To wake up a 1,000 years later would be quite something!!
Perhaps I shouldn’t be wishing for ‘interesting times’. But I’m both a dreamer and an optimist at heart. Bring it ON!!
specie, good call on the bio-wrecks. Not participating in morning rally.
Ja Free, thank you.
Purvez, i’m glad you are recommending suspicious observers to others
the guy deserves as many followers as he can get
really eye opening stuff happening all around us
and you can’t depend on NASA or any other government sources
they all have their own agenda
Market wise, looking to short spx later this afternoon, pretty big
Specie, if the market goes above this morning’s Futures’ high then shorting will be ok. Otherwise be careful out there. I think we are still in w-iv of w1 of this upward correction.
short ES from the Battle of Midway
Specie, are you in the USA? Are you planning to go to their conferences in Pittsburgh or Phoenix? They sound like something definitely worth doing. Wish I was anywhere near enough to go.
I do hope they record it and sell the recordings.
Hi Purvez, Yes, I am in Michigan. I can’t make it but i’m like you, hoping much of it will be available via video or audio
Specie, my in-laws live in Michigan (West Bloomfield). What is this “Battle of Midway” that you’re referring to?
Valley,
How are the PALS for next week.
Post Perigee: very bearish
Post Full Moon: very bearish
Based upon these two aspects alone, I will be in cash at least until Wednesday of next week.
Valley, I concur … lunar phase is negative until end of Sep. Also Perigee this Sun Sep 27 will be the closest distance for this year which usually mark extremes. The other aspect that I am tracking is Mercury retrograde (Sep 17 to Oct 9) and Sep 28 will be exactly the midway point of that cycle and could potentially mark a significant bottom Sep 28/29 if a deep selloff happens early next week.
Yellen this, Yellen that. IMHO too much time is spent analyzing her every breath. She’s the chairman of a group that decides by consensus. She’s speaking for the group, not for herself. Not only that, but IMO the Fed is the tail where many (most?) think it’s the dog.
The markets will do what they’re gonna do regardless of what the Fed does, even though they will likely get the blame (for a crash) or congrats (for another big rally.
pC, I agree entirely.
But there was symbolism in her *funny turn*.
Added a quick 3x short FTSE position from the car at 3pm today, feeling speculative due to the full moon perhaps.
Gosh, this market sure is spooked!!. This last hour sell off is more vicious than I was expecting. Back to not knowing what the next ‘count’ is for the moment. Things will sort themselves out eventually.
Hopefully Krish is taking profits at this level as is anyone else who was short from this morning. Good trades people. Congrats.
Well it looks like ol’ Peter_ may well be right. From yesterday’s low to today’s high remained a 3 waver (i.e. a correction). From today’s high to today’s low is also a 3 waver. (AT time of writing).
So we have an ‘abc’ up and another ‘abc’ down. However I’m not convinced that we are done here. I think we will have ANOTHER ‘abc’ up from here BUT not above the 17 Sept high.
So as I said. Ol’ Peter_ was right. This is just a correction and it WAS a LEADING diagonal (not an ending one).
Of course we’ll have to wait to see what the market really brings forth.
The C=0.62A @ SPX 1855 and although I prefer 1820 this will be a lower low and if the C has acceptable form then its long from there. But as we know there are other possibilities, always other possibilities, like Sherlock taught us.
Peter_ in my books the ‘upward’ correction has not finished. Even if it stays below the 17 Sept high it will retrace till at least 61.8% (16580) or 76.4% (16715)
That’s what I’m ‘expecting’. Let’s see what I get.
SPX retraced 62% with abc, DOW is in step. Why expect so much more than typical when no atypical causative to do so? And then why be so adamant? Your message comes across haud dubie without any supportive explanation.
NB: The Fib is not a lower low against SPX 1834.19 on that hourly tick, so 1820 appears to be required or count goes into wave 3 of P5 on a corrective form wave 2 at the turn. Not?
didn’t think the dow would bounce 450 off the lows yesterday
while the biowrecks are now down almost 6% today
Where is our ‘don’t worry’ post by Nic?
Maybe he’ll send a postcard?
Hope you’re ok Nic.
LMAO!!…..Martin Armstrong. The man who told everyone back in 2000 to NOT buy gold until it crashed under $200, which he said, was a dead cert, continues to bash gold this time around and tell everyone, yet again, when they SHOULD BE BUYING, that gold is going to crash under $1k.
This is the same man that told everyone back in 2011 that gold would hit $5k by 2015 and in 2012 said that interest rates would rise from 2013.
And folks quote him like he is a some genius forecaster!
Just read it Allan.
Sent him an email actually, simply because he is wrong in saying gold is moving with all other commodities, when it has been rising against them since 2006.
http://www.screencast.com/users/Gary_UK/folders/Jing/media/bafc3d83-e4db-455b-9c82-6359086ad3f4
He’s got some sort of weird bias against the *promoters*, but he’s as bad as they are with his errors.
I didn’t see the sub-$1,000 call in the post.
Poor guy, I’m with him on the big govt bust and rough cycle that lies ahead, but he shoots himself in the foot sometimes re gold.
Gm, mate I have tried to debate him but he flatout refuses to egage me. What about the quote below from two days ago in response to golds performance during markets collapses in which he states that Japanese that bought gold in response to deflation were wrong!!……REALLY…Use the link below to look a 30 year chart of gold in JPY.
“If you disagree, then keep buying for the wrong reason just as the Japanese did for more than 20 years. This is the outcome we face, so stop the nonsense”
http://goldprice.org/spot-gold.html
And props to JH – I’m sure he did very well this week.
it’s been a long time coming, and to his credit, he never wavered in the face of the naysayers. Well done…
Hear, hear, hope so too.
Plenty of yeasayers agree.
‘in truth, we’re doomed’.
You do march to your own drummer, GM.
Hi gary im next door to w bloomfield
Sp futures at 1942
Some people i post with refer to years or battles when discussing the spx
Battle of hastings ie 1066 was a real battleground for the spx years ago
Ah, got you. Worried about Boehner’s resignation. May be much more negative than people recognize.
John H., ref going big IBB. Fantastic, way to go!
American stocks are “climbing a wall of worry”.
New post is out
John, oil historically not good indicator IMO because plastics and other petroleum derived products increased after the mid 60’s. Good article recapping the previously stated here. Though to be PhD worthy, we would have to move beyond causation by observation to algorithmic and data sets. I honestly do see that being the next phase vis-à-vis the community.
Thanks. Maybe we can collaborate. How are you getting on with yours?