
The Dow and SP500 are combined flat for the year and the 7 month price range has resulted in bollinger bands that are the closest in 20 years. Behind the scenes we see evidence of a major peak in equities, making the range a likely topping process.
 Source: Hussman
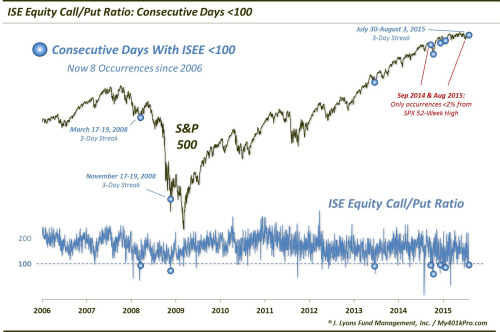
Source: Dana Lyons

Source: Yardeni
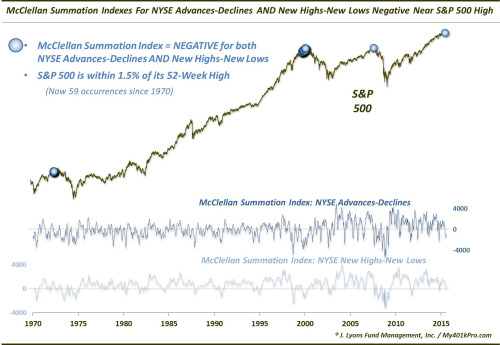
Yet we are also seeing signs of a significant bottom.

Data source: Rob Hannah

Source: Dana Lyons

Source: Fat-Pitch
These bottoming signals have formed less than 5% from the highs. So are they a springboard for a break upwards out of the price range before stocks top out? It’s one possibility.
Note that previous incidences of the topping indicators gave rise to at least a 15% sell off, whether it be more like 2011, 2010, 2007 or 2000 in nature. Meanwhile, the bottoming indicators often formed at bear market pauses, at selling exhaustion points. Has a bear market begun then? It’s another possibility, but the shallowness so far of the selling is odd.
What’s also confusing is that some indicators have washed out at this point whereas others remain at contrarian levels, such as Vix. Plus note that some indicators have produced a clustering of extremes for 12 months now, stuck at levels from which mean reversion would have historically fairly swiftly occurred. All told, it’s more history in the making and makes it difficult to call the outcome with high confidence.
Buybacks peaked out in Q1 2014, IPOs in Q3 2014. Data shows that money flows into equities have been flat in this cyclical bull, in line with demographic predictions. Without new buying sources, the bull has been fuelled by buybacks and existing participants leveraging up. With buybacks decreasing, the bull (if still in progress) is reliant on continued increases in leverage.
As things stand right now, stocks may need to move higher to neutralise those bottoming indicators. Therefore I can’t rule out the possibility of a final move higher, an overthrow, before a true rollover. However, stocks are also overdue a deep and sharp correction and the clustering of indicators, both top and bottom, within such a tight price range, could also produce a swift move lower, before a partial retrace upwards. It may be that fuel has been exhausted and certain indicators are therefore not as contrarian as they may be perceived. In short, right now I’m watching and waiting to see which we way we break before attacking again.

Unparalleled objectivity. Immensely appreciated.
Thanks Peter
What Peter_ said!
This is not a good sign
http://www.news.com.au/finance/business/anz-plans-capital-raising/story-e6frfkur-1227472091159
Thanks John. I think the only buyers of last resort are central planners and corporates.
Nicolas, have you seen this:
http://rightsideofthechart.com/biotech-wreck-pending-video/
Is Nic still buying AAPL?
Poor Nic – he gets no love
Not true Gary, I’m eagerly waiting for him to tell me when he’s going short. Given that I missed out on his astute ‘long’ calls I’m hoping to ride his coat tails to the down side when he sees it. All I was doing was providing info for him.
I’m just amazed at how conspicuously absent he is when his stocks tank 15+%
I do think he will get it right when he shorts, and prove to be the best trader of us all.
Maybe
The MOST positive thing I can see fir shorts is the historic high levels of complacency whilst the SPX moves just above several key technical levels and the DOW is leading the way down.
As I said last week the DOW is being weighed down by the strong USD due to the large multi-national weighting.
Strong USD looks set to continue, my fundamental view, over the next 2 years, here’s a chartist view:
https://www.tradingview.com/chart/DX1!/AhO7sbGW-USD-Bearish-Bat-Buildout-to-117-Here-s-How-It-Went-Last-Time/
It is for that reason alone that the Fed will NOT raise rates. It has nothing to do with unemployment numbers and everything to do with DOW profits.
Back in the 90’s the the global economy was a different beast amd the USD strength was not such an obstacle to US multi-nationals. Not so this time around.
It goes without saying that tomorrow’s NFP number will be hugely important:
http://www.bloomberg.com/news/articles/2015-08-05/wall-street-says-yellen-poised-to-end-long-run-of-zero-rates
Gary,
NFP does not matter. My guess is that the big Boyz were leaked the info hence the large tick sells we saw.
I’ve been trying to think of ‘what causes’ may exist for the ‘bottoming signals’ appearing so near the top? I would like to offer the following hypothesis.
Contrary to popular belief most ‘Fund Managers’ have not blindly gone along with the big ramp up. Most have known the ‘madness’ of where the market was being driven but due to ‘performance ratings’/’bonuses’/’job security’ were riding the market upwards. Most of these guys have therefore had their finger on the ‘exit’ button for a very very long time and are extremely twitchy.
Hence the slightest whiff of a down trend starting has these guys rushing towards the exits to beat the crowd. Since they are the ones who monitor the markets very closely they are therefore the ones to act quickly too. This has resulted in us getting these ‘bottoming signals’ so much earlier than normal.
So it is really the length and strength of this ‘bull’ market that has increased the expectations of the Fund Managers towards a reversal and hence their desire to get out before everyone else.
The possible behaviour I’m describing would account for ALL 3 bottoming signals arriving early.
Any thoughts/comments on my hypothesis?
Purvez, I agree 100% – I think the “professionals” are still scarred from the GFC and sensitive to large draw downs. That and perhaps the hedge fund industry becoming more institutionalized and not so focused on big returns as middlin’ returns with low volatility.
and that’s why Lazlo is saying this time it really is different:
http://www.bloomberg.com/news/articles/2015-08-05/birinyi-says-you-can-toss-out-the-old-tools-for-calling-s-p-500
Gary, I take it you are suggesting that we continue upwards?
My personal take is that if despite the bottoming signals the market doesn’t get off the floor as expected, then these guys are going to go into full blown panic mode and want to off load everything.
I respect Lazlo.
But he’s not always right, of course and my thesis is the final correction in this ongoing correction (sector by sector, stock by stock) will be the large cap indexes giving way.
I don’t think they escape the damage that’s occurring, unlike Lazlo.
Gary, that’s a great way of putting it. I suspect that the coming bounce will probably see the S&P make a new high but not the DJIA and once both fall below their respective current lows is when the panic will set in.
Plausible, thanks
This looks dangerous. Oversold yes on many parameters, but pattern wise….very ominous looking.
http://stockcharts.com/h-sc/ui?s=%24INDU&p=W&b=5&g=0&id=p52825430726
Allan, just looking at the charts (smaller time frame) I believe we will ramp back up towards 18,000 on the DJIA before a sizable down towards 17000. That sort of ties in with your ‘oversold’ comment and the ‘ominous’ one too.
Mate the problem is that for the last three years everyne all but expects the bounce. At some oint it doesn’t happen and that will lead to a huge reality check.
The issue with the DOW atm is that it hasn’t been in this position for a very long time, not to mentin that the Trannies began this decline after leading all the way up from 2009.
Things are changing.
JH,
Thank you for the excellent points.
I am more convinced on the bear case than the bull case. Since the graphs are hard to read, I can’t really understand what is going on, even when I zoom in.
I understand put/call ratio, but other than the 2 dots in 2008, I do not think the other dots suggest a great buying opportunity. This is because markets post-2009 have gone up, and I could throw a dart and look right. (Again, I cannot zoom in, and basing this on my old eyes.) The other issue is that we don’t even see one other solar cycle — i.e. what happened in 2000, and as we know, even fitting the last 3 solar cycles is insufficient sometimes. Another data source, CBOE Equity Put/Call, did hit a high of 1.4 in early July, but that was under the 1.6 last October, and moreover, 1 month has passed since the high point. Finally, it appears that we have a data issue on the VIX yesterday because it only occurred for one tick (I checked the minute data.), but the VIX low was 10.88. If you choose to believe that data point, it suggests complacency.
Can you explain what is SP500 capitulative breath?
For the third chart, I can’t read what the text is, but not all the lows are yellow highlighted. Are the cycle lows without yellow highlights times where the model has failed?
Please realize I am very biased, and my opinion should be averaged with Nicholas.
John, Capitulative Breadth (CBI) is a proprietary indicator created by Jason Goepfert at SentimentTrader.com
He’s never explained what goes into the indicator – but there may be some information on it by googling it.
Thanks Gary. I can’t find more information but I will keep trying.
Not sure if it is the same thing, but for indicators such as the CNN Fear/Greed indicator, I fully expect it to be stuck at 0 if we indeed have a solar max crash, because it is not calibrated based on 2000 or before.
http://money.cnn.com/data/fear-and-greed/
And even this indicator is not showing 0 yet, like it did last year.
Gary, my Google search turned up Capitulative Breadth to belong to Rob Hannah (as John H attributes) of ‘Quantifiable Edges’ dot com. I’ll look up Jason Goepfert and see what turns up. However Rob Hannah has provided a fair amount of detail of his version.
Just Google Capitulative Breadth Indicator.
My bad – I often get the two mixed up.
I see what is going on. The CBI counts the number of stocks in the SP100 that are in capitulation. And I agree if you look at Gold, Energy, Basic Materials, we have seen a lot of blood on the street. It does not subtract stocks that are super ripping, such as NFLX. Therefore, it is a one sided view. And I certainly agree that gold miners at least are in capitulation.
To the extent that one is trading the SP100 (or perhaps the Dow), it does suggest a bounce indeed. The Dow actually held up nicely in 2000, so I won’t be surprised.
The question remains if biotech and small caps which are not measured in the CBI can possibly correct while the large caps hold up? Must the market fall together?
Thanks John. That makes sense. There are around 16 stocks which are energy or materials which could then account for most of the CBI high reading.
XLE +1.45% right now — showing CBI is working, because it is that sector that is in capitulation.
IBB -3.89% right now.
JH said “Has a bear market begun then? It’s another possibility, but the shallowness so far of the selling is odd.”
On why CBI is reached so quickly, I suggest that the difference is hedge funds account for more of the market than in the past solar cycles. Therefore, the “odd” dispersion behavior vs previous cycles, where mutual funds don’t short.
I recall XLE:XLF in 2008 (i.e. real stuff vs paper stuff), and now it is GDX:IBB. If hedge funds are long one and short the other, the unwinding might cause negative beta moves unlike the pre-hedge fund driven markets.
Purvez – I have a couple of weekly charts posted waiting for JH to give permission. Should post later.
Best to you and everyone else. Make some money!
Hehehe geno, the drips are getting more consistent and bigger. Soon a torrent will develop!!
This is the fourth week out of the last five that the DOW has traded under the 50wma. The last time it traded under it was back in October last year for 2 weeks and complacency levels plummeted.
This week complacency levels are up near record highs.
even John Li is starting to troll now;)
J
Huh J?
I just realized how rude I sound re-reading it. I was just giving honest feedback since no one else commented on the graphs. Not calling it a bad chart on the data, but just hard to read the pixels.
Here’s a monthly chart for the SPX with my key intermediate term indicators at the bottom. As you can see, they paint a very bleak picture.

If the indices fail to bounce with tomorrows employment report that will mark a significant paradigm shift for the markets as it will indicate that news, regardless in the past whether it was bullish or bearish, drove the upside, is no longer a momentum driver for the upside.
I responded to posts on the “Update” thread.
8/6 12:23 Price targets for the larger wave at 2052, 2036, 2016. Singularity low 8/9. Expecting a bounce next week and another low end of the week.
Question for Slater9:
You’ve mentioned that the computers tend to retrace to .886 of a move before reversing. Have you got any experience of them overshooting by it’s inverse .114 before reversing, please?
Thx in advance.
yes..see 2007 top in INDU
Thanks slater9. Something similar happened in the DJIA at the recent bottom where it overshot before turning, hence my question.
Lunar Tuner:
Phase: bullish
Declination: bullish
Distance: not bearish
Seasonals: bearish until Friday close
Planets: bearish until 8/15 VIC
Summary: I got stuck in a long trade this morning in US equities, down 1%. Since next week is bullish tuner and VIC may have already factored into market going to stay long into next week. Reasoning is that market is being pushed down today prior to the national debates between Trump and his opponents. 100 million people will be watching. Then tomorrow all day Fox et al will be playing debate footage. While the market rallies in the background. As the market will be rising viewers will be able to relax and focus on the political debate. This happened during the first republican debates in 2011, big sell of on volume day of debate, large rally peaking 4 trading days after debate.
Valley, please may I ask what made you want to take a ‘long’ trade today?
I was only intending to be long into open, since it opened down and tuner is now on the positive side (especially starting next Monday) I figured may as well remain so.
Valley, this almost sounds like you believe there is a wizard orchestrating the behavior of market participants, a concept I really have a difficult time with.
And do you really want to rest your case on “it happened once before like this so it’ll happen again”?
Touche’, Gary. Maybe just grasping at straws. Feel a bit better after seeing Geno’s fib chart.
Didn’t mean to come off as rude, Valley. I just couldn’t conceive that investors would take the debate that seriously at this stage of the proceedings.
Valley – I was lucky enough to sell my calls yesterday. I bought up some more calls today. I’m bullish with. May get another dip tomorrow that I’ll buy.
Sorry John Li: I was referring ot this comment when you were talking about Nicotrollas:
“I do think he will get it right when he shorts, and prove to be the best trader of us all.”
I realised my comment appeared much lower down thepage…..:)
J
It is really my sentiment though…It is like my wife asking me to open a jar. I use all my might and loosen it, and then she opens it easily and takes the credit.
Bears like me have been wrong for so long that the writing is in the wall — no, in the sky! It would be so easy for Nicolas to come now, short and win, and take all the glory. And honestly, I would totally do that if I were him — it is on the silver platter.
He may have to start calling him Nicoless if Apple dips below 100.
Stcking out like dogs “….” that these indices are going to bounce off the employment report tomorrow.
I bought today because the SP-500 dipped into a perfect correction box. the wave retraced .786 of the move up, the second leg of the correction traveled 1.382 x the first leg, the right side of the vertical “time box” is a perfect 1:1 time ratio of the move up.
that’s why I bought, doesn’t mean it’s right!
10m chart
Nice call geno! Still struggling how you next take it up to 2400 though. I can see the S&P achieving another marginal ATH whilst the DJIA doesn’t.
Purvez – I posted the weekly and a daily chart higher in the thread (was awaiting moderation). If this was a 4th wave triangle we should get a nice pop out of it. We’ll see. Check the annotations on the weekly chart considering BB Width and retracement statistics.
Let me know if you have any questions after reviewing those charts.
geno, I’ve seen those and now understand where you are coming from. My only comments are that 2 & 4 look way too small in comparison to their respective 1 & 3. Although in every other respect they match the rules.
Let’s see what the market actually gives us.
In the near term I’m expecting a bounce too (not as large as your suggestion) but now I feel that there is a real possibility we first sell off towards 17200 on the DJIA before that bounce materialises.
G’Luck with your trades.
geno0010, you have a totally different count from my own EW count. 😉 I say that tomorrow, the point that you have marked as C right now, will turn out to be wave 3 of 3 down. Wave 5 of 3 down will turn out to be a minimum of 2044. 😉 Therefore I guess that Peggy is right in her predictions. 😉
Greetings,
Wouter (from The Netherlands)
It is 01:00 overhere (kinda tired), therefore I am sorry for writing your name the wrong way! 😉
looks correct to me, the name that is.
The indicators don’t really support my triangle theory, but we have moved the weekly indicators from overbought to neutral while maintaining price support. Therefore I need to remain bullish at this time. Dropping to 2040 or even 1980 doesn’t change the fact that the longer term charts are still bullish imo.
Hey geno0010 (I got it correct this time, haha, awake now),
I respect that, but try to see alternatives, only thing I want to tell you. 😉 I see the bullish scenario, why? Everybody is seeing it. Now try to read between the lines, what else can you see? Just saying. 😉
Cheers,
W
8/6 19:45 7442 Spiral Market BIOS cycle top is in – forecasting a price target of 1953, 1907 and then finally 1862.
Thank you Peggy for all the sharing! 🙂
Greetings,
W
Hi Peggy,
Listening to Sean he is talking about bottom August 13 or is it stil August 9?
Thanks in advance
after this incoming low, there’s a bounce to 8/12 midday and then down again.
Peggy, thanks for all updates.
Is there a price target for sep 12?
just the ones I’ve already posted.
9/12 is not necessarily a low
Wasn’t Sean looking for a move higher from 8.13 to 9.12? Or has that changed. Thanks.
yes in general a move higher from 8/9 to 9/11. The problem with 9/11 is that it is a max Expansion that does not get all the way to 45*. The market becomes more volatile. Looking at the octets, I’d look for a high on 9/8
Garry, I would think LB accepts a
large cap correction possibility, his call
is longer term, at least that was my take.
I think that’s right – a 10-15% correction may be perfectly acceptable to Lazlo.
geno0010, you stated “the right side of the vertical “time box” is a perfect 1:1 time ratio of the move up.”
I am just trying to understand the two boxes that you drew. Could you provide more clarity or color as to how and why you chose to begin each box at such starting time and price points?
Also, in above quote you stated [vertical] “time box” … did you intend to mean horizontal? Or did you merely flip the horizontal time box, making it vertical, in order to get a sense of potential price movement?
Anything you can add would be greatly appreciated. Thanks!
Steve – the box that is stretched horizontally is PRICE retracement and extension Fibs, retracement of the move up from 2060 and wave extensions from the first leg down. There was a cluster of four fibs within that box – so that area gives the most support.
The box that is stretched vertically is the TIME fibs. We usually don’t expect a correction wave to extend past the 1:1 ratio, so that time box begins at .50 the duration of the move up from 2060 out to 1 x the duration of the move.
Hope that helps clarify.
I drew up this chart to help explain – Gives the best risk/reward setups for EW when you use fib price AND time
The following data doesn’t shock me one little bit. I remember saying late last year on here that BHP’s Ag production would plummet along with global Ag production.
In respect to Australia, “you ain’t seen nothing yet”…….
Now with global supply declining and demand increasing one needs to ask the question……”how in hell do prices decline”??…….to wit I say look no further than one banks massive explosion in PM positions since January!
http://srsroccoreport.com/big-production-declines-in-world-largest-silver-producers/big-production-declines-in-world-largest-silver-producers/
No doubt somebody will tell me it’s all in my imagination. Hmmmmm if it looks like a pig,smells like a pig and squeals like a pig…chances are it’s a pig!
no, no, No, NO!! Allan you are hearing the squealing of CBs……oh wait a minute. That’s what a pig is these days!!
No physical truncheons necessary. Financial ones are FAR more effective and they don’t leave any ‘visible’ scars.
Is global demand for silver likely to increase Allan?
Not in a recession surely?
And not in the long run, given the bursting of the biggest debt bubble the world has ever seen, and a reset to levels of activity much lower.
I feel sorry for those that see it all coming who have positioned in silver, they’ll wish they’d gone for gold when we’re out the other side.
GM silver is the poor mans gold and Indians are buying by the handful because of recent restrictions on gold imports.
Don’t you worry your head one little bit about Ag. Deflation will smash global production whilst invesment demand will rise with gold. Once the upside momentum takes over the price will, take care of itself.
oink oink Allan 🙂
J
Hey people, any one who trades needs to look at this one:
http://rightsideofthechart.com/view-real-time-market-internals-any-index-sector-etf/
This market is schizophrenic!! The job numbers came out just now and on the ‘face of it’ they are good. SOOOOO!! The market can’t decide to rally or tank.!!
93,770,000 people have left the work force and those are supposed to be good numbers / it’s the worse number in 34 or 38 years
P you are looking at it all wrong. There were 215,000 jobs ADDED and the unemployment rate held steady at a seven year LOW of 5.3% as per the WSJ.
We’ll have all those 93m people in jobs in a matter of 36 years at this ‘amazing’ rate of jobs growth. Stay positive.
Rome wasn’t built in a day or something like that.
Mr. Commodity, gold, and silver bear here is surprised. Silver is mainly a by product of other mining. It seems logical that miners would stop or slow unprofitable and marginal operations due to low prices. However, they were investing 150 billion a year in new CAPEX for mining in the 2008 to 2012 time frame vs 5 billion a year in the 90’s. So they are under extreme pressure to produce to get money to meet the huge debt they have taken on. Farmers have borrowed heavily to clear land, buy land, and equipment ($250,000 air conditioned GPS tractors) so they are under debt pressure as well.
In addition, how could silver prices go down with more demand. It probably cannot. However, silver has an anomaly. A very large % of demand is investment/speculative. Industrial demand has grown very little this century. So, speculative demand has to really expand and industrial remain strong or supply could easily exceed demand even with lesser production.
geno are you adding more here (Aug 7 2015 14:35 – S&P20177) or waiting for more downside?
Sorry geno, adding more ‘LONGS’ is what I meant to say.
Hahaha!! S&P 20177!! That’s both a wet dream and a nightmare. Sorry folks 2077 is the reality. Wake up time.
Yup, I’m adding today.
Odds still say to be long – If I lose at least I know I stuck to my system.
Will add more on a new low and with a 208.71 buy stop.
JH,
Thank you for pointing out the CBI. While it convinced me that some oversold sectors and even the Dow might rally, I has also convinced me that we are past the real peak. That is, the today’s timing is closer to 5/2008 where XLE:XLF diverged, and the equivalent 10/2007 peak occurred mid last year as you said. The nominal price highs that we got must have been due to buying of equities from Japan, and then the implicit govt support from China. The significance would be that a drop now might be closer to the waterfall, even though a second chance is hardly measurable, because the sentiment has already shifted.
A potential seven days down straight for the DOW, when was the last time that ccurred?
Sets up a very interesting Monday if we do!
Not sure the last time, but It occurred 10/1937 too. Interesting, because low interest rate QE analog.
my Sep calls are back in the money, at least for now lol.
Have a good weekend all!
J
Pork bellies? 😉
Voltaire,VOLTAIRE, hope you see this .. Back in June You sent me some charts and some of your comments on your work..Well we are now in 08/07/15 and 18/08/15 is near..Please share any comments you have now.Thanks ..
See full response as new post.
Thank you …Nick
Voltaire, please will you include a web address to view the post. Thx.
Well, the path the market takes to go from point A to point B can never be predicted or understood even if the price targets of A and B get hit. In other words this market does its best at confounding both bulls and bears so that they can never get full value. Folks who shorted at the Jul 31 top expecting a potential retest of the Jul 27 low would have been confounded by the unexpected early morning rise on Aug 5. And vice versa, the folks that went long at the lows of Aug 3 or 4 would have been quite surprised by the Aug 5 sudden reversal after an intraday breakout of the downtrend line.
In all likelihood the bottom “should” have been in by Aug 5 at the latest because that coincided with the end of a negative lunar cycle. But on both Aug 3 and 4, the market kept making these intraday rallies after each decline that somehow delayed the low to coincide with most likely a Aug 6 or 7 weekly low.
As deathly as the market looks yesterday and today to end the week, I will go on record to state that the chart is presently following a familiar bullish pattern. That is if you start from the May 20/21 top and the double bottom of Jun 8 and 15, and then to the Jun 22 top and the double bottom of Jun 29 and Jul 7 (forming a lower low), and then connect the Jul 20 top and now the potential double bottom of Jul 27 and Aug 7 … you get the formation of a potential inverted head and shoulders pattern, that is, if the low of Jul 27 holds either today or Mon Aug 10.
If this is indeed the case then be prepared for a strong 60 point rally measured from today’s low to possibly test the neckline top again. And I will also go on record again to state that such a rise will also likely occur in about one week by Aug 14 or 17. And if that scenario were to play out then I also think the rally either fails at/near the 2130 neckline (SPX) or breaks it by just a bit and then fail for a false breakout. And then expect a rather ugly mini collapse during the week of Aug 24-28 that could even begin starting Aug 20 or 21.
This will be the preliminary “shockwave tremor” that is prelude to a much steeper decline to occur later in mid-Sep onwards. Again the day to day path the market takes can never be predicted accurately and maybe the current low occurs on Aug 10 to scare/fake everyone silly before a late day stunning reversal rally. Much like how the confounding up and down action that occurred Jun29 to Jul 9 confused both bulls and bears. GLTA!
‘Again the day to day path the market takes can never be predicted accurately’
There’s this chap called valley seems to have a certain knack in that regard.
Enjoy the weekend folks, I shall be mostly golfing.
Valley has made some fantastic weekly calls but even his day to day executions cannot be predicted, otherwise the Aug 5 high would have been “predicted” beforehand, no? And he went long early Thursday whereas the market proceeded to head lower in the afternoon and also today.
Anyways, I blame it on all the bots and algo’s that run rampant creating this frenzied unpredictability intraday and short term daily time scales. It seems prices always test the extremes before big reversals occur more often than not now.
You can only make educated guesses, but if you can set your trades up with the least possible amount of risk, and most possible reward, you’ll do just fine. Nasdaq 100 R/R ratio right here is great.
Current Price – 4510
Risk (SL) – 4344
Reward (TP) – 5050
Risk 166 pts
reward 540 pts
166/540= .3074 – anything under .50 is good in my book.
Correct, Steve T. I have to use intuition to optimize the Lunar Tuner. It has built in a bunch of weak but consistent effectors that like JH’s Lunar Edge advantage stack odds in favor either bullish or bearish. That said, it only works most effectively if you are willing to buy at lows and sell at highs. Human nature prefers opposite. Today for example “could” be a temporary sell off, the ideal time to be long. Or it “could” be a start of a larger decline. I am betting that it is a temporary sell off. Conversely, after next week I won’t be long…regardless of price because the consistent effectors are aligned against it.
Steve – Check out nasdaq today
I’m betting heavily that we head higher next week
We’re talking 5050 by the beginning of Sept.
I’ve just updated my ‘ongoing’ expanding diagonal on the DJIA chart and either given myself some serious depression (most likely) or we are on our way down BIG time. (Please note that the chart was last updated to last night (Thurs 6 Aug’15) so today’s action would have brought it to the blue line.
https://www.tradingview.com/x/4KbVmYyy/
If my ALT count is correct and I sincerely hope it is then we are finally rid of this ‘BULL s%^t’ otherwise we’ve still got a very long way to go before it all ends.
The thing NOT working in the ALT favour is the action since Alt 5. It should have been swift and severe to the down side but it hasn’t been. UGH & Double UGH!!
Who knows?
You need to refresh the page more often to see new posts.
geno, is your ‘refresh page’ comment for me? I’m not following what you mean if it is.
Nice chart, Purvez! Thanks for sharing it. Looks like price could either rise to resistance, fall to support, or continue sideways?
Purvez – Right back up to where i bought yesterday. Would like SPY to close above 207.60
JH – Is there any way to time stamp these posts?
If you view this page via an iphone 4 then the time stamps show up.
Gracias Purvez – got the close I wanted, let’s see if it carries over into next week! Have a nice weekend.
Yes, the refresh comment was for you. I guess I’m used to message boards where people are online all day. Maybe you guys have other things to tend to during the day. No problem for me.
Good call Geno! I am with you on the long side. Next week is shaping up to be very bullish. Shortazilla will be defeated by Megalong.
Steve T., there are plenty of traders who have made lots of money trading the SM. There are many more who have lost lots of money trading the SM.
There are plenty of card players who make lots of money playing in Vegas.
There are many more who have lost lots of money playing in Vegas.
What differentiates is the understanding of odds and practice; based upon a particular set up what are the odds of a winning in the money or a losing out of the money, and then playing lots of hands until experienced.
If after reading “Lunar Edge” with its 80% gain new moon, 20% full moon over decades doesn’t suggest there might be odds stacking methods in the SM…
The Lunar Edge does work and is in sync. Read Lunatic trader website where he documents gains in lunar favorable and lunar unfavorable days. Almost all of gains are full moon plus four to new moon plus four, especially the last year of data.
To argue market is random and untradable is imho not accurate. If you want a good guide read Stock Traders Almanac in which Hirsch and Son show the persistent seasonal patterns in the market going back to early last century. Combining seasonals and lunar edge gives you back drop for decision. Price is trigger. If price is at support and favorable days coming (like today) buy. If price is at resistance and unfavorable days coming (like last week) sell.
Valley, I do believe in lunar edge and acknowledge it has credible merit. My comment on SM unpredictability refers primarily to ultra short term time frames specifically intraday. If you review the intraday action it is almost like you are playing against some ultra rich aggro poker player with absolutely no regard for money who is trying to win every hand against you whether by having the best hand or by sheer aggression and bluffing you into folding numerous times.
Longer time frames obviously improves probability and predictability significantly. But it still does not guarantee you in realizing successful and correct analysis every time, because the path the SM takes to get from point A to B can be different every time even though it ends up getting there as initially thought.
In an earlier post I stated that Aug 24-28 will likely be an ugly down period. But I have absolutely no idea exactly how it leads up to that starting period or what it even does in the early part of that week. Maybe Aug 24 it does something crazy like open gap up 30 points and then suddenly reverses and tanks or maybe it ends prior week weak or neutral and then on Aug 24 it opens gap down big.
Unfortunately for (most of) us it matters which path it takes unless you can stomach big drawdowns or have unlimited funds.
Thanks for that clarification. I agree that on an intraday basis the market appears to be random, especially on a minute to minute basis with price moving up and down .25 points either direction. What may be the creme de la creme of trading is finding intraday price predictors that work day after day. I am presently working on this as a refinement of the Lunar Tuner.
So far the most interesting is “intraday seasonals.com” where a colleague of the famous trader Larry Williams (oscillator) has mapped out every 15 minutes of a typical 24 hour futures trading week doing on a minute basis what the Almanac does on daily basis. The chart is free and based upon a decade or so of data.
If you go to investing.com and print a daily 15 minute chart of ES futures (sp500) and place moon rise and sets, high and low tides, planet rising and setting you may find out that daily price moves are effected energetically. One common effect is that if you only go long from moon rise to moon set, and short moon set to moon rise you will greatly increase your odds based upon 30 days of data that I have been studying. Maximum price up moves occur from moon rise plus 5 hours, and maximum price weakness occurs during the 6 hours before moon rise.
valley this is excellent information especially about moonrise and moonset. The effect is definitely noticeable, even on the occasions when there is an inversion. Very grateful to you for pointing this out.
This point may be controversial.
The equity markets are supposed to be a place for companies to raise long-term finance to grow their business. Owners of said equities are interested in earning a small slice of the growth of that company, generally via increasing dividends, which will drag the share price higher along the way.
Today’s markets ARE nothing but a casino, and these days computer programmes and a few day traders push the prices around with zero thought for fundamental prospects for the company’s future.
The developed world economy is bloated (and blighted) by financialisation, a symptom of the rot in the real economy, and the erosion of truly free markets.
I look forward to the day it all collapses in a heap, and we can start again. However, on that day, traders will lose pretty much everything, as your brokers either go bust, or the Fed bails the whole system and the dollar collapses.
so what’s a trader/investor to do in the meantime? I too believe the collapse will come. But when? This year? Next year? 2020, or 2050?
Accumulate physical gold, and it’ll all be done by 2035 latest.
GM, markets are a far cry from when I began investing.i admit I am a dinosaur when it comes to my investing credentials and approach.
The days of analysing a companys prospects based upon basic fundamentals and not some forward doscount mumbo jumbo on what may or MAY NOT happen, are long gone.
New acounting principles make it all but impossible to understand if a company is really making money because they can just cook up whatever they like.
Earnings season is complete joke. I have asked the same question before. When was the last time that earnings didn’t exceed consensus?
It never was a dead cert. There always was a degree of uncertainty involved in investing, but now more than at anytime in history this is the greatest ponzi come casino on the planet.
geno0010, which message boards do you guys post on?
Just found a new wrinkle in the energy balance for next week. VIC is next Saturday which is of concern. Also Mercury quadrature occurs a few days later. From years of data when M quads the Sun (is 90 degrees relative to earth) week before is subject to frequent sometimes large sell offs. I know we are due for a up move based upon technicals, wall cycle, 10 week cycle, and Luner Tuner. I just might step aside next week and exit long position Monday at open until after VIC and Mercury quad. To see for yourself go to “theplanetstoday.com” scroll until Mercury is quad sun and see on chart if this effect isn’t remarkable.
The average return of week before to week after quad over 17 years has been a negative -.5%, 102 occurances. Next quad is 8/16.
Something about inner planets quad, Venus has similar results three weeks before 90 degree earth sun angle to three weeks after have had negative net returns over same 17 years of data.
Thank you kindly for your insights. All the best every one.
Hi Valley,
Mercury quad sun is this the same date mercury latitude midpoint(@)0)?
19/8/15
thanks in advance.
oh sorry you wrote it down allready thanks
Thanks JVM, didn’t realize mercury latitude midpoint and mercury quadrature were related. Very useful info.
NIcola et al
I suggested Aug 18ish as a possible CIT based on an Armstrong cycle from 2009 lows. The first turn was spot on and some of the others within a few days.
If it happens it would be the last MAJOR turn before Oct 11 2017 which also happens to be 10 years from the 2007 high.
If we look back 8 years we find Aug 16 was a panic low and it could have been a crash except for FED intervention on that day. Will that happen again ?
Why a possible crash day ? If you look at 1929 & 1987 and many other crash cycles, you find some interesting day counts.
It usually looks like 99 cal days up from a low and then 56 days down into a crash low. That’s 155 cal days low to low.
Sure the move up can be a couple of days short or the crash down phase a couple of days short.
Anyway the weird thing about 2007 was that it was 155 cal days from Mar 14 low to Aug 16, but the 56 cal down phase actually became a 56 cal move up into Oct 11, the major high. Why ? Dunno !
The crash low date can be a few days short of 8 new moons after the first new moon after March equinox. A new moon was close to equinox so allow Oct 9 or Nov 8. You’d have to go for the Oct 9 as Oct 10ish has the most major CIT’s in history.
At the moment I can’t see any of those relationships apart from being close to Aug 16 2007.
Thank you so much ……Nick
THanks for sharing Voltaire,
I read your comments June 20,it might become a big hit August 18 or 19
So this will become a low and a turn up?
Do you also think September 30 could bring a top?
Thanks in advance.
John.
What about gold ? If this is really significant bottom then it must rally past 1105 in decisive manner. But last 2 weeks were triangle-like consolidation and each rally was sold.
There is very important trendline in gold connecting June 2013 and Nov 2014 lows. Gold broke below it and it is scratching it from below, trying to get back in. It is getting repulsed.
Next week gold will probably break out of 1077-1105 consolidation zone, which way ?
I slightly favor downside move but everything will change if it gets back past 1105.
Crude is low and going lower so what about Gold?
http://finance.yahoo.com/news/whats-happening-oil-market-now-100400920.html
Is insider buying pointing towards a new ATH for US stocks?
http://247wallst.com/investing/2015/08/08/insider-buying-skyrockets-as-stock-market-stalls-in-august/
Richard, the same article contains a link to this:
http://247wallst.com/investing/2015/08/08/insider-selling-at-highest-levels-in-months-as-earnings-wind-down/
Could you explain –
Maybe its one of the reasons that JH is highlighting both major sell and major buy signals are occurring at the same time.
Hi john Hampson,The best analysis.thanks
Haha – I like it when you literally have a site saying that the market will either go up or down. I would immediately stop visiting them. Useless.
imho
J
I always visit the blog John Hampson because for me he has the best analysis. Thank you very much John Hampson on your analysis during this. GBU
China’s decline will continue with no end in sight:
http://www.theepochtimes.com/n3/1711073-a-chinese-entrepreneurs-rude-awakening-at-a-german-manufacturing-fair/
Lunar Tuner next week:
Phase: Price supportive all week
Distance: Price supportive all week
Declination: Price supportive all week
Seasonals: Price supportive all week
Planets: Mercury quadrature 8/16 bearish all week
Venus inferior conjunction 8/15 bearish before, very bullish after
Post Venus Mercury heliocentric opposition bearish until 8/18.
Summary: Lunar seasonals very bullish especially near price lows for year. Planets are not at all supportive, but flip to very supportive following week. Price sometimes bottoms out before the VIC, so if price goes up and away this week would not be surprised.
BTFD still rules. I am expecting the ATH to be in October with the major downturn to start after then.
Which index do you think ATH? The Dow last made one in May.
Could be, a two month counterseasonal rally (post Venus inferior conjunction), then counterseasonal discounting from October into next year.
The big news this morning:
http://www.marketwatch.com/story/dollar-trims-gains-after-fischer-says-fed-wont-hike-until-inflation-picks-up-2015-08-10
I won’t bother with the article, for obvious reasons.
But worth noting that the market will flatten the yield curve, and the Fed will
remain impotent.
The dollar will rise during the coming recession.
🙂
US producer prices later this week?.
my goodness Richard, I thought I repeated myself
a lot, I have got nothing on you! )
Blind Freddie saw this coming. What were the chances that the indices were NOT going to bounce today?
The big big question is, with major moving averages and BB’s converging we ae at a major decision point. Either we break to new ATH’s or the bottom drops out.
This 10 months of sideways chop has to end one way or the other and everyone knows it.
Not only will there be No rate rises in the near future, but QE4 is just around the corner. That tells you which way I think it goes.
I agree on QE4, next year probably. Still think they might try to raise rates, if only to give themselves some ammo to reduce again. Yield curve will rule as always.
I have no idea about equities at the moment, but if I had to pick, I would say down, based on many indicators, not just my bearish views.
John Li,
China is now ready I believe. It won’t do more QE.
It has enough gold within its borders to become self-sufficient as an economy, no more need to sell to the West for paper promises.
All that is missing is the higher gold price, which Mr Market and the ECB will deliver in the next few years.
Not sure if I agree with that. China sold Treasuries — 180bn out of $1.65T, or more than 10%. The idea that China doesn’t need the US comes from its massive Treasury horde, but if 10% can disappear in a year, it is not a stretch to imagine that all of it is gone from a lost decade.
Yes, gold will be valuable, but I don’t think it is because of China’s secret grand plan. I used to think that China was smart — they engineered a bubble and then tried to unload it to MSCI indices and Hong Kong Connect, aka foreigners. That would be a good highway robbery solution. But now they are buying stocks in China at double the price as Hong Kong — and I assume foreigners are selling if they can. They also lost MSCI, and would they lose the IMF too? They have turned themselves to be the ultimate fools.
China did QE $1TRILLION. If that kicks the can for another 2 years, like it did in the 6/2013 meltdown, I think they need $10T in 2017, and $100T in 2019. But by the 2020 solar minimum, surely, they reach the end of the line?
What do you call $1000T anyway? Because at some point it is real money.
John Li, you are going to be disappointed with this answer. A 1000T is just called a quadrillion and then thereafter each 1000 is called a quitilion, sextillion etc.
That must be the MOST boring numbering sequence there is. Whoever thought of it needs shooting…..probably already dead poor being.
China isn’t buying stocks John, that’s just a media narrative.
They have a foolish population who love gambling and easy money.
The bubble will be allowed to burst, the PBoC and the govt are not stupid.
Don’t believe the media narratives. They are ready to move on, away from supporting America.
Bingo!!!
This could be a two month post venus inferior conjunction rally in the all risk assets that I had mentioned earlier. Fed announcement, dollar falling, could be a prelude to risk on which often happens post VIC. This week way up, next week down, then off to the races as Richard has said until October.
Valley,
Thanks for posting very good..following your ideas..i am combining lunar tuner with other indicator for oversold and over baught. Thought about shorting ..but it never became overbaught..looks like it sold off..let me know what you are doing next. i was planning to short at at 2120/30 but not any more as of today mornig.
Hi Bill,
Mixed bag this week, tuner is good but planets are strongly bad. Mixed bag next week, tuner is bad, but planets are strongly good. So buy low sell high is my only guide. Will stay long until Friday and maybe beyond if price stays low. I am expecting a counterseasonally rally in all assets next two months, post VIC.
Hi all ! How is it going ? I was away last week and I couldn’t post. Sorry for that.
There ‘s been no change in my strategy, I would still emphasize IBB, AAPL, AMZN GILD etc…
There’s a dead cat bounce in gold today and it’s a nice opportunity to sell/short more.
Overall, insiders are buying, companies are buying back their stock, and central banks are still supporting the markets. So all in all, i’m still bullish.
Good post by John, still he ‘s still way off, once again.
Nic, any chance you could tell us now all of your future planned ‘away times’.
Great way for us all to get short at just the right time.
Thanks.
LOL, that is the best post.
LMAO, that went way over his head I think.
Hi Nicolas
I had posted an earlier link from this guy about Biotechs which are one of your major holdings. He’s got another one now:
http://rightsideofthechart.com/biotech-sector-breakdown-confirmed/
Does what he is saying worry you at all?
Please do make sure you post when you change tack. Thx.
Hi Purvez ! How are you ? I’m not worried at all by biotechs. the big cap biotech stocks are very undervalued with low PEs, such as AMGN, GILD etc…
Don’t over analyse it, just buy IBB and hold it.
regards.
Thx Nicolas for your reply. As I’ve mentioned before the valuations are now too rich for my liking at this point but I’m eagerly waiting for your announcement that the ‘top’ has arrived/past.
Todays trading wreaks of distribution. How many BTFDer’s are going to get fleeced in the next few days?
Gold impressed with the rally today but it may still be interpreted as final E-wave move in the bearish consolidation. I am waiting for it to close above 1105 to enter longs. Short position preferred below 1090
I was asked about the 886 algo and its inverse
here it was in place on Friday close with MINIMUM target yet hit…
hit this morning
traders do not have to take trade
but it is useful to know when it is in place
as the computers way, their short hand
of signaling to each other their intent of the next directional move
http://stockcharts.com/h-sc/ui?s=QQQ&p=15&yr=0&mn=0&dy=15&id=p12657245453&a=338378191&r=1439236606713&cmd=print
The huge money manager Tepper said a few years ago that the stock market was a can’t lose. If news is good that is good, and if news bad, more QE and that is good. A can’t lose and he was right. So I should not have been surprised when the stock market rallied on bad news from China . China reported it’s Producer Price Price Index fell at a -5.4% rate in July. In the US, that happened in 1930 and it signaled the deflationary spiral that killed the economy and the stock market for the next two years. I have been expecting China to blow up and cause the bear market some of us have been expecting. Number one, it was hard to even find this bad news, and secondly it was reported as good news, it would mean more stimulus! Yipee. The 1930’s deflationary spiral is the only case I know of where the markets over whelmed the FED. China is so overleveraged with mal-investment, one would think it would happen there, but who knows. China is now over a year after the real estate top, the stock mkt has had a 30% crash, and now a deflationary spiral signaled. With things that bad, it should be fantastic!
The Fed was easing in 2000-03 and 2008-09 Kent. It is impotent still.
Banks control money supply, interest rates and credit, I suggest reading about the Eurodollar markets at Alhambra blog, and at Policy Tensor blog. Central banks are still operating with a 50s playbook, but Eurodollars and global credit means their powers vanished in the 60s, never to return.
As for news re China, meh, the market is becoming more volatile, this is reminiscent of the 2007-08 top, and I mean just before the waterfalls started.
I smell a waterfall soon.
My waterfall sniffing nose is still working, look at oil, copper and the Dax this afternoon. Panic is in the air as I type. Chocks away, open the bear pen (that might mean bears flying aircraft)?
And GOOGL jumped nearly 7% AH because………well……. just because they announced something. Any excuse will do now.
Long DAX at 11394. Now have my largest long position for a while. Expecting this shakeout to end with a powerful move to the upside very soon.
Long again at 11310. Strong support here.
Krish, please be careful out there. The ‘tide’ has turned and you need to acknowledge that.
Wish you ‘ALL GOOD’ with your trade.
Krish, where is your stop loss or do you use one?
Gold bottomed for now. This rally may have far to go. And if it is C wave like some have predicted it may drive it even to 1450-1550 target. There was very little trading in 1500-1550 zone during gold crash in 2013 so it may be revisited.
Bunell, not being an Ewaver, what comes after a C wave in your count please?
I’d guess D? 🙂
But you know what I mean!
GM, I think that ultimately gold will fall to new lows when stock tank next year. My preferred count is that A-B-C correction started in Nov 2014. We need to entirely reset negative sentiment around gold and I think this C-wave rally can be really fast, reaching 1400 before end of year. We’ll see.
Thanks Bunell.
purvez & jeger,
Managed to get Part 1 of my money nexus post finished, all welcome to have a read: http://screwtapefiles.blogspot.co.uk/2015/08/the-nexus-part-1.html
Part 2 to follow soon.
GM just acknowledging your Part 1. Have had a cursory glance through but I need more time to go through it in depth.
Only point I would like to make is that at least by the end you need to have given us a ‘taste’ of the (with one recent group as an exception) of the ‘group’ to keep us interested. Your post mentions them numerable times and it’s only fair on your readership to give a hint. imo.
I’m really looking forward to Part 2 now.
The hint is within the post p, for those with sharp eyes!
Golden Cross on the DOW, the first since 2011. Many will say it means nothing. Well we’ll see how nothing it means pretty soon. The DOW is beginning to awful technically.
Golden cross or death cross?
Please may I ask:
Anyone who was long yesterday took any profits before the turn down today?
The reason for my asking is I’m trying to ascertain how many of us are ‘traders’ i.e. get out when the goings good and how many hang on for the larger gains?
Full disclosure….for ‘whatever’ reason I couldn’t get myself to trade either yesterday or today. No ‘obvious’ reasons come to mind….. just a ‘je ne sais quoi’!!
Is that the equivalent of writer’s block?
Yesterday intra-day charts had distribution written all over them
Allan I agree, but a ‘trader’ doesn’t care. She/he is just interested in the next minute, hour, day etc!! So my ‘hesitation’ was completely out of character.
BTW since I ‘spread bet’ as my method of trading I can trade pretty much 24x7x5(days) so there really was no ‘reason’ NOT to trade.
My point was that anyone long should have taken profits based upon intrad-day charts. If I were still a trader, which was long long ago, I would have taken my bird and run mid afternoon session.
Thx Allan, that is more reassuring to me than you may know. I just thought I was loosing my touch here. LOL.
For the record I’m not a trader. I look for longer term swings – which is what John’s focus has been from the beginning and one of the major reasons I was attracted to his writings in the first place.
That’s fine Gary and thanks for letting us know. As a Gemini, I tend to be a schizophrenic. I do have longer term investments but spend most of my time ‘trading’. That’s my intellectual exercise.
Purvez, I am bullish for this week and probably early next week and expecting a big move (as stated end of last week). However, I exited long positions yesterday because it was nearly a 40 point move in one TD which is not the norm. When it occurs there typically is a temporary profit taking pullback anyways so you can either reposition at a more favourable price or re-enter if the market decides to steam forward without any dips.
Market is carving out some complex patterns nestled within each other …. triangle, possible W bottom, possible inverted head and shoulders … and thus the path it takes to get from a starting point A to expected point B is rather unpredictable intraday or even day to day.
But as it stands as of several hours into Aug 11, I anticipate the market to bottom out either later today or tomorrow and then rise towards a higher high than Monday in next 4-5 TD’s.
So if I was caught still long entering today then I would just take the short term pain and hold to end of the week based upon my thesis and hope to either profit at the end or get proven wrong with further price action.
Steve T, I am very grateful for your detailed response.
I guess our trading styles differ. I tend to monitor the ‘shorter’ time frame and therefore don’t have a big ‘draw down’ to deal with. I would usually expect to have 1-2 trades a day averaging me about 30-50 points on the DJIA. So on that basis I’m usually ‘hedged’ if I’m on the losing side of 10 points.
I’m very pleased for your gain yesterday and wish you MANY MORE.
This has been a great month for me. I was long GDX and I took profits at the close yesterday and at the open today. I know you are talking about the stock market — I hope gold miners count!
I am still short IBB, and plan to be long GDX — but my observation is that both plays take turns to work, and I do trade quite rapidly around them.
Thanks John Li, I’m very pleased at your gains this month. It is indeed very interesting to know how many of us do trade regularly.
Congrats to all and may you have MANY MORE.
I was long this past week purvez, but I’ll be holding my gold miners for a good few years. 😉
GM, hehe, we all know you as a ‘non trader’ but thanks very much for your input.
I guess as long as you don’t have a ‘draw down’ that is huge then that still counts as a ‘trade’ ….. in my books.
I have been in draw down these past 2 years p, but have kept buying through the dips. My clients have remained patient and stoical. Onwards!
For traders though, I read an article about luxury goods stores struggling in Honk Kong, and looked at Burberry;s chart. Looked a good long-term short bet to me.
That and the S&P, the Dax, the FTSE, to name a few…
Purvez – I got out of my longs yesterday and into shorts. Got out of my shorts today and back into longs. Attached are the trades since my buys last week.
Jenna said what?
Bo Boloney re Polny, still talking three digit silver in 2016 …..the guy thinks he has a direct line to The Creator.
I’m bullish but that is absurd!
If he is correct, he will be famous. If he incorrect, he will be famous for his outsized call. Either way he is famous. Not a bad idea. Probably why Harry S. Dent, Jr. always exaggerates his calls.
Hi GM
I would like to say that I appreciate you taking the time and effort to post on the subject you have chosen, it must have taken a long time – and kudos to you for doing so.
As to your conclusions, I think I will just leave it there as I think I have said it all before in various other posts here. It doesn’t mean that I am not interested in what you write, or in exploring your intellect through this medium – no disrespect intended, genuinely!
I won’t be able to contribute to the wider discussion on this subject under these limited parameters.
I will however say one thing. Consider the decision to make banks (of any sort) the vehicle for creating loans with interest. Consider the extreme fiscal drag this has now and has had over the decades. The Government could just make loans without interest to spur financial growth if all you had or could imagine was a monetary system. There is no need for banks of any sort, they are just a comp plan for millions of people in a parasitic economic type of entity. Who pays? Always, as you say, the taxpayer.
Any monetary system will ultimately fail, in any configuration. The real shame is that there really isn’t any need for one any longer. The problem is that it will probably take many decades for people to even start to realise that. All the while, inequality grows, conflicts grow and most importantly of all resources are wasted that cannot be regenerated.
I sincerely wish you all the best with this, hopefully at some point our views will not be so incompatible as to allow an open debate.
J
That’s cool j.
I’m not going to comment here at all, as it’s John’s blog, but feel free to add any comments over at STF.
Purvez
I just use stops. Went long at 17417 stopped out today at 17510 thus losing out on around 100 points but still profit. Sometimes it works, sometimes it doesn’t.
Looks ugly for now.
DAX too.
imho
J
J, do you have a ‘profit stop’ as well as a ‘loss stop’? Just curious as to how you work out ‘profit stops’?
My method of getting out is by counting waves / Fibs contact points.
Thanks for responding. Not trading for 2 full days is a new one on me and has me worried a bit.
The FED is neither omnipotent nor impotent.
They have clearly altered the cycle, but can not
abolish it.
Hello Phil.
I’d be interested in why you believe this to be the case?
It’s a common view, but I have yet to see any actual evidence.
Genuine enquiry, thanks.
P
I have a limit on all orders which is where I will take profit unless something fundamental changes. I always have stops on every order where it is possible to have one. In this case, yes hindsight trading I know but to just to illustrate – on opening the position I had a stop, which as we gained 150 points very quickly I subsequently moved to lock in some profits. I don’t always move stops, but when volatility is high I can do, and as a position stays open there may develop levels where a stop can be moved to that makes sense (to me).
The only completely hard and fast rule I have on this is that every trade I take will *on opening* have a stop and a limit. Always. The vast majority will have a guaranteed stop. They can be revised in any way I see fit, EXCEPT the initial stop loss can never be moved further offside than when trade was opened.
J
J, thanks for your explanation. I suspect we are not very different in our trading although we use different ‘methodologies’ to achieve the same.
I rarely have a ‘profit target’ but always a ‘loss target’. Mostly I will exit at the ‘loss target’ but there are times when things are SOOOO stretched that I will take a ‘fully hedged’ position and then take a small loss on that rather than try and find another ‘entry’ point for my original trade.
As for the profit target, I tend to count waves so I will stay in until I’ve got the required number or one of them ‘crosses one of the EW lines’.
I’m still unclear about how you arrive at ‘profit limits’?
Hi P
I always have a target in mind based on price levels where resistance or support can be found, or breakout etc. . If I don’t I don’t trade.
It is much better to not trade than not know why you are trading imho.
J
Thx for your response J.
I didn’t make myself clear. I also have a target in mind but I still prefer to count waves as the market progresses towards the target.
It helps me to either bale out earlier or stay in the position longer.
I still get it wrong as often as I get it right. Lol.
I find it quite bemusing these days how many have complicated analysis to such a degree, with cycles, EW, so on and so forth that it is quite common to sometimes miss or overlook the simplest of things.
The DOW is breaking down from a complex head and shoulders which is very similar to the pattern that GDX put in seveal years ago.
http://stockcharts.com/h-sc/ui?s=%24INDU&p=D&b=5&g=0&id=p05778776839
Did not miss it because it is not H&S. Overlapping mess no impulse best case LD and deep retracement will follow. The indexes are not finished to the upside. I would rather bet on symmetrical top .

Karni,interesting chart. What is LD again?
Based on the chart, it looks like you believe the top is in – yes?
How can you say it is not a HS? Just because it does’t have the classic defined structure of what people expect a HS to look like does not mean it is not a HS.
It has all the classic tell tales of distribution. A HS can be of a very complex structure.
I’ll stick with what has worked throughout the ages and DOW theory says we are going down. And in a big way very soon.
I believe LD stands for Leading Diagonal.
Leading diagonal a way to count overlapping mess as an impulse and to say ok a move in the opposite direction has begun.
I think SP500 will make one more higher high… DJI is weaker lower high looks more probable.
Allan – H&S from March no because it will move one more time higher. H&S from December 2015 ok it is H&S
Whilst everyone is focused on NFLX, GOOGL, AMZN, FB, AAPL , Biotech to name a few……sumthin is seriously wrong in noddy land!
http://stockcharts.com/h-sc/ui?s=CAT&p=W&b=5&g=0&id=p88988264493
To wit I say aside from last minute overshoots, John Hampsom pretty much nailed it.
From Jeff Hirsch:
Following yesterday’s solid, one-plus percent across-the-board gains, today’s across the board loss of nearly equal magnitude is a clear reminder that volatility tends to really begins to pick up in August. In an average year, VIX typically reaches a low in July and then begins to steadily climb toward a high sometime during October and then to decline once again.
Since VIX does not measure actual volatility (daily price moves), let’s compare it to actual daily price swings of the S&P 500 since 1950. August has the third highest percentage of days +/- 1%. October has the most which matches the 1-year seasonal pattern above.
This historical data suggests the market has just begun its most volatile four-month span of the year, August through November. There are likely to be many more days like today, and yesterday, in coming weeks.
“The market is poised for a big drop. We bounced off of the 200-Day MA yesterday and we are right back on it today. I have been pointing to this moment for the last few weeks. I believe China’s retail sales will miss overnight and the SPY will convincingly trade below the 200-Day MA on Wednesday. We will be buying puts – we bought some today.”
This quote is from Options One site. “If” this happens tomorrow, it will be too late as I am long. However, if it is a 2% sell off, imho an excellent short term buying opportunity as the VIC this weekend “could” snap prices to ATH in a few days.
Dang, I closed my puts today and bought calls. Wild ride this week, been trading offthe 10m charts! I hate day trading.
Are you going long today
Purvez – Posted this weeks trades above. I’m long calls going into tomorrow. Trading off 10m charts this week. I hate daytrading. I’m a swing trader who likes to ride the trend. Taking profit and changing direction quickly is driving this guy CRAAAAAAAAZY!
Hang in there geno. The words, goose, gander and sauce come to mind. I love volatility and despite my 2 day hiatus I got my mojo back yesterday afternoon.
In fact EW works very well with 5-10m charts in these circumstances, at least in getting you ‘out’ of a bad trade.
On a side note, Nicolas must’ve been on vacation again today?
GM, I do hope you are right that China is smart enough to let their market crash, instead of wasting more money on it…
purvez August 11, 2015 I believe LD stands for Leading Diagonal.
A leading diagonal in the impulsive wave one position is typically followed by a deep retracement (wave 2). Occurrence is rare. Make sure the diagonal wave is not a 5th where diagonal triangles typically occur. If in doubt it is advisable to favor the typical. And this also leads to a deep retracement, but one order greater.
Right in the middle of my top call timeframe guess atm.
We can have a nasty correction within a continuing bull market,
as per the RUT in 2014.
Still a long way to go before I would begin to get excited.
I bet the Chinese central bank shorted global markets heavily last week. They do know how to create carnage! I’m all out of my DAX positions as the stop triggered last night. Might as well take a break from trading until September as this market is untradeable.
saying that we are at good support and I wouldn’t be surprised to see the market recover to 11500. If the Chinese continue to manipulate in this way I will start to become generally bearish though. I’d like to see the views of Western governments on this.
I’m hoping that quip about the Chinese central bank shorting is in jest?
It’s been easy to trade the Dax if one recognises a simple series of lower lows and lower highs. That trend is intact until 11785 is taken out to the upside.
Good luck.
I disagree. The majority of the price action has been determined by policy decisions rather than technicals so I can’t see the true picture. Even though the charts look bearish a policy move can completely turn the tables round. I agree that we need to get above that 11800 area to continue the bull but at worst I think we remain between 11000 and 11500 if that doesn’t happen for the next few months. I have no positions now anyway so personally I hope for a big drop to renter longs.
krish, you are doomed with this view.
I will say it again. A complex H&S and we have decisively broken the major neckline yesterday and following through today.
Futures down big at present.
http://finviz.com/futures_charts.ashx?t=YM&p=d1
As I wrote DJI probably will not make higher high… but just watch how the bears will be killed again… dreaming of bearish patterns.
karni, it’s not dreaming when the pattern is clearly unfolding as it is presently in the DOW and there are numerous reasons to believe that it will continue to unfold.
I agree there is potential for rip-your-face-off rally today. In fact, I would not be surprised if we reach 2150 in 2-3 weeks
I think if it is H&S it will be the “big one” with beginning December 2015, now the head will be finished and there will be one more strong rally for the right shoulder.
Now we wait and watch what happens:)
Karni – how do you expect the market to make a new high if it keeps getting rejected at 12 VIX? We would need to see a 7-8 VIX to see 2150 imo.
What is happening with the DAX longs here? Hope the stops kicked in?
J
Yes my longs got stopped out although it was unexpected in my view. Hard to say but this could be a good place for a short term bottom in the DAX with a rally recovering around 1/3 of the fall from 11600. I believe the entire fall will be retraced given enough time.
Krish, you’ve been quite bullish for some months on the DAX. What would turn you bearish?
Do meteor showers have any impact on excitability or sentiment? Thanks
Just gone long DAX with a small position to test the water. Stop below LOD.
J
J, I understand this is a trade but I also think the global dynamics aren’t favoring the DAX at the moment. Export dependent and with the Euro going up and the Yuan down, you have quite a negative fundamental outlook for Deutschland.
Here’s my wave count for the SPX. First there is no leading diagonal. I’ve seen this talked about on a number of sites, but wave 3>1 under that count and that’s a violation of the rules. The best count as I see it is an aggressively subdividing minor wave 3 of intermediate wave (A) (I have it of primary wave [4], with a new high to come next year). Back to minor wave 3, according to my count it has subdivided down to the submicro level, with submicro wave (iii) of micro wave [iii] of minuette wave (iii) of minute wave [iii] due to begin today.

Be prepared for a huge snap back rally once the Chinese authorities announce they’re stepping in to stabilize the currency and/or the YUAN has reached a level they’re comfortable with (and they will).
Maximum uncertainty right now –
That might be August 15th, per Valley, let’s see.
PALS: Planetary Aspect Lunar Seasonals,
Planets*: down this week (AVIC, AMQ), way up following weeks (PVIC,PMQ)
Lunar: up this week, down next week
Seasonals: up next 8 trading days.
Summary: Long until at least Friday.
*(avic-ante venus infer conj, amq-ante merc quad, pvic-post venus inf conj, pmq-post merc quad)
if 2044 falls, then the cards have been dealt
The fed will do anything to keep this index up and manipulate it till the bone but just like 2008 but when the herds go wild they can not…
Yes, some 30% lower versus the USD.
The market is in control Gary,not the PBoC.
Oh, please…
Really, you should read more widely, you would grasp the yuan has been under pressure for months, the CB was forced to move the bands.
30% is a minimum over the next few years, shit’s going to get real.
A 30% move would destroy the economies of the US and Europe and most others. In return the Chinese economy would be destroyed. I think it is quite clear such a move would be detrimental to China so its safe to assume it won’t happen to that extent.
krish, you and many others are going to be amazed at what happens over the next few years, that’s the only safe assumption to make.
The markets will decide, not any government or central bank.
I agree there will be a snap back rally (the extent of which is up for question) when investors are re-assured. China is has no benefit from destabilising markets as it will eventually boomerang back at them. Until then high volatility is likely as the question remains whether there will be day 3 of Yuan intervention.
Agreed –
China isn’t destabilising anything, it is trying to regain stability.
Investors will become increasingly risk averse when they realise the market cannot be controlled. That and the deterioration in profits.
I can see the bulls are going to have to take a few hard knocks before they see what’s happening, a sign perhaps that the market might cling on up at these levels a bit longer. Or not, someone’s going to be caught holding the risky assets when the bottom falls out.
Well, they certainly announced it to SOME folks given yesterday’s rally, just not us, lol
In my books from the July 16th high in the DJIA it looks very much like an Ending Diagonal with today’s low being the throw over. Once we get back above 17230 then we are in for a retrace at least until 18,000 but probably a bit more.
Following on from my post above about a retracement if we go above DJIA 17230…..
The 2 trend lines I was following were:
Wave 2 top (31st July) to Wave 4 top (10th August) – top line
and
Wave 1 bottom (27th July) to Wave 3 bottom (7th August) – bottom line
Today’s action sliced through the bottom trend line without stopping. THAT is not normal action which makes me think that Wave 5 has NOT completed and that we may yet see another low.
Usually when a wave is ‘retracing’ it will ‘pause’ at key trend lines but today’s action DIDN’T. It was almost as if the lower trend line didn’t exist. So that’s what’s making me think we get another low before the wave ‘acts normally’.
Of course it could just power higher from here in which case we’ll not see a new low.
DXY responds with 1% drop so far. Looks like sheep docking.
A perspective… http://barestbodkins.blogspot.com/
‘The People’s Bank of China (PBoC) also announced that from now on the fixing will be based on market maker’s quotes together with closing quotes.’
It’s pretty damn arrogant of the US establishment to start finger pointing at China for devaluing it’s currency when the US has abused it’s position as holder of the world’s reserve currency for 4 decades and exported its inflation to the rest of the world.
Interestingly, from a narrative perspective, the Chinese central bank have just devalued.
I’ll note that krish and others out there see devaluation (when it’s the euro) as positive for markets like the Dax.
When the Chinese do it, these bulls are less happy. Surely they should just go long the Shanghai Comp now, on the same rationale?
Cognitive dissonance abounds in bubble-land.
Because the Shanghai Composite has risen about 5 times as much as other markets in the space of a year is why I wouldnt go long on it. That GM is definitely the definition of a mega bubble. If the DAX and DOW went up 100% in the space of a year I would be extremely bearish too! The snap back rally happened today as mentioned by Gary and me. A 250 point drop on the DOW completely reversed!
Hmm, some would say +50% in 2 years for a developed country’s stock market is a bubble too. Others might play in that bubble blissfully unaware of it.
Interesting times eh?
Lucky Nic, away on another break these past 2 days.
Send us a postcard Nic.
I think folks should be accumulating DBA/MOO here. The Yuan mess is giving you a golden opportunity to buy food-based commodities on the cheap…
#ElNino
I notice no solar cycle reference on this particular blog John H?
pulp that may be because there is not much solar ‘stuff’ happening according to these guys:
http://www.suspicious0bservers.org/
If we get a spotless day soon I think it is worth a mention since it indicates how euphoria is dying down.
http://solarham.net/regions/map.htm
Looks like 2 to 3 percent higher from here on US SM within 3 trading days. Wish I had bought GDXJ a few days ago. GDXJ may double next two months.
Words for the next two months: “risk on”. Phrase: “a rising tide lifts all boats”. Words after October: “risk off”. Phrase: “a sinking tide lowers all boats.”
So even after August 15-18 you will not go long in the market ?
Yes, I will be going long and am long now. Very confident of market rally in near term but since I swing trade will be going short also.
Valley, could you refresh my memory – why are you saying the next two months are risk on? I know you’ve discussed this before, but if you could give me a quick refresher, that would be much appreciated.
From Valley’s post 2 inches up the screen Gary:
‘Words for the next two months: “risk on”.’
Don’t mention it. 😉
GM, appreciate the “help” but what I’d really appreciate it is if you put me on ignore. Don’t even bother with my posts going forward, you have better things to do with your time.
Gary, my view is that if you post a view or a link to a blog such as this, it is open for debate, or disagreement. If a bit of gentle banter (above) upsets you, I apologise, and will desist.
(Are you American by the way? I ask, because over the years I have found that the US lovers of free speech don’t really like it when said free speech doesn’t fit with their view). Roll on the demise of this American empire I say, hypocrites in so many ways.
But I’ll still highlight any mainstream media commentary you may link to as such if appropriate (i.e. it is flawed). Feel free to ignore my comments on them if you have better things to do with your time.
Answer is below, it has to do with post Venus inferior conjunction have four months of upward price movement most times. “The planets today.com” has planetary positions.
JH: I mentioned recently that it might be a good idea to do a special on the Currencies especially given that China is devaluing theirs.
Still expecting Oct ATH?
haha, I seem to remember he mentioned something…….about 17 times. I am sure a reminder is incoming anytime now.
J
But he finally changed his mind…
8/13 9:50 Spiral update. 2032-3038 or 2010 today have potential to be end of Wave 1 down.
Peggy, please may I ask… are you ‘really’ believing that 2038 (I’m assuming your 3038 is a typo) can be achieved today? That’s a 40+ point drop from where it’s sitting as I type.
Whilst I’m happy to say ‘never say never’ that seems a bit of a stretch to me.
Does seem a bit of a stretch p.
However, whenever I see oil plunging (as it is again right now), my equity-waterfall-sniffing senses start tingling.
Many believe we’re off to the races shortly, maybe we will be.
But if I had to bet, I’d say we’re so long overdue some air coming out of this bubble, and it would be panic selling, and very large declines.
Hope it’s the latter, the past 7 months have been long & boring.
Maybe tomorrow?
http://screencast.com/t/IAbJntyl9q0
I suspect there will be more churning at the top
IF that price today = bottom of Wave 1
Aaah I see what you are saying Peggy. I misunderstood your original post. Thx for the clarification.
8/13 11:22 Remember, Expansion has begun and the Expansion high is 9/11
Peggy I have watched the ustream channel quite a few times and the claim is… the spiral was calculated 12 or 20 years ago… then how come the targets keep on changing ?
I see a green phase till tomorrow or at least Monday…
I don’t understand what your question is. Are you talking about time or price?
mainly price… I have seen quite of few unmet price targets. and since you asked about time… does the spiral have a time element forecast ?
What time frame are you talking about?
Credit has confirmed the cyclical change, rates have just exceeded January’s high, so the trend upwards is confirmed:
https://research.stlouisfed.org/fred2/series/BAMLC0A4CBBB
Equities will realise sooner or later.
Valey,
are you taking partial profits now and today, you expect 15th aug to be negative.. so may be monday is negative… I am some long for tomorrow and today…
One of the most persistent planetary patterns is Venus:
Up: VIC (8/15) to VQuad (12/15+/-)
If you do the chart work, almost every time next four months are up a lot.
VIC is venus inferior conjunction, and VQuad is venus earth quadrature or where v quads earth (90degrees angle).
So, I would have an bullish stance towards all asset classes until the end of the year. This is not based upon current price, technicals, fundamentals, etc. but is just based upon price action in past. As we know, prices that appear irrationally high can get more irrationally high, before they correct.
Short term: I am bullish until next Monday morning, after Monday morning have to see where price is.
I am going to add EXK, HL, SA, NGD and / or GDXJ gold miners on Friday if price continues to sell off. Next two to four months are going to be “interesting times” in the mining sector. Reason: post Venus inferior conjunction risk on time.
Just placed bet on GDXJ. Will hold until price goes up 25%.
25%? I don’t think it would take that long for you to get there :). 2-3 weeks maybe? I am loaded with miners as well. We’ll see how it goes after the VIC is over.
Great calls with the VIC effect!
I am back in the gold miners too.
Overall, my trading averaged out OK. Didn’t lose opportunity with the whipsaw but saved myself from some white hairs.
valley, I don’t see gold and its miners rallying if risk comes on strong.
They have been opposites for 4 years, give or take.
We will see, would be unusual though.
Valley’s VIC is on 15 Aug. So tomorrow is the last trading day. (Thereafter according to Valley it’s ‘sunshine and roses till Dec’.)
I can certainly see the possibility of a hard down day tomorrow which takes the DJIA below yesterday’s low to end the Ending Diagonal which started mid July and then the huge ramp up.
Unlike Valley I’m not sure that we extend all the way into December though with the ramp. Certainly I don’t see the DJIA making a new ATH but the S&P is a different proposition. It ‘could’ make a new ATH.
G’Luck all
Is this the reason why the Bradley middle term maximum is also on 8/15/2015?
8/12/2015 29.21
8/13/2015 31.30
8/14/2015 32.67
8/15/2015 32.99
8/16/2015 32.48
8/17/2015 31.71
8/18/2015 30.51
John Li, I have little understanding of Bradley and am therefore unable to comment helpfully.
Bradley mostly based upon inner planets (Mercury and Venus). A cursory look at planet position shows the inner planet govern price CITs on monthly basis which makes sense cause whatever energy the sun is putting out is reflected, focused, or diffused by the location of its two closest “lenses”. An interesting phenomenon which speaks to the power of planetary position is when earth lines up directly in mars opposition the usually opaque atmosphere of mars clears noticably, mars being much farther away from earth than venus is to earth it is no wonder why Saturdays venus earth direct line has so much effect on the earth.
Thank you.
With premise of this bull cycle since 08/09 being in its 4th wave (of 5) Any new ATH from hereabouts would signal high probability waterfall territory (within and to end the 4th) don’t you think?
Yes Peter_ I would expect some ‘waterfall’ type events once the S&P gets to a new ATH. However that would either be the ‘3’ or the ‘b’ of an expanded flat.
Since I ‘see better’ with the DJIA I will refer you back to my ‘long suffering’ count:
https://www.tradingview.com/x/2Drxtlb8/
Where I’ve marked ‘y-a or A’ could also be a 3. In which case I would expect the next wave to go down to the ‘green trend line’ i.e. where I’ve marked B for a 4.
However the reason I’m hesitating with that is if you look at the ‘other’ 2 waves that reached the ‘green’ line, they did NOT pause at the blue line at all. Yet the recent wave did. Which is what is stopping me from saying we go straight down to the ‘green’ line.
I hope ‘some of this’ makes sense. It’s 10pm in the UK and I’ve had the odd glass of wine here!!
I will have to offer a slightly contrarian perspective as I do not quite see the sunshine and roses from now to year end, and instead it is likely to be an extremely volatile affair unlike anything people are expecting.
Short term, I did not anticipate such a deep sell-off on Wed looking from last week and expected low 2060’s SPX to be worst case if a sell-off did occur. The late day recovery to close green was impressive but unfortunately it only mitigated the damage and prices are relatively unchanged still.
This week and early next week is supposed to be a “bullish” lunar period for equities and Aug 5 seems now to be an important turn date for both equities and precious metals. As it stands, tomorrow Fri will likely be a down day since we did not get meaningful profit taking yet nor did momentum follow through on upside take place. Which only leaves maybe two TD’s next week to make any further rallies to close out the positive cycle. In other words, it ran out of time to do anything meaningful which does not bode well for the near term picture.
I would be very careful making any significantly large bets on the long side moving forward from here, because mercury retrograde approaches in mid-Sep and almost a guarantee of big price swings on both sides. The bull case likely resumes in full swing in Q4-2015, so I can see how the general “big picture” for VIC still applies if you ignore the huge swings in between.
Good commentary, Steve. I agree it may be too early to catch the short term bottom of miners, which could be anytime in the next three weeks, imo. It is just that the VIC is usually a CIT. I also am not sanguine about the market in the next 12 months because of the apparent parabolic price move of last four years, and the shemitah effect which if rhymes 87, 94, 01, 08, 15 would mean this should be the year, also Jupiter is drifting thru Virgo next 12 months which is usually slim to no gains. On the bullish side, preelection year, year 5 of decade, and Saturn in Sagitarrius (85, 57, 29 all manias). However, as a full time trader, I am trying to catch the moves however meager they may be.
Valley – You may want to pick up some shares of BBG very soon. Good luck!
Valley : “However, as a full time trader, I am trying to catch the moves however meager they may be.”
I hope you still retain your ‘risk/reward’ perspective!
Steve T/Valley I applaud both your commentaries. This is what ‘good debate’ is all about.
Thanks very very much.
Purvez – I just can’t get bearish yet because on the weekly charts we’ve burned off the overbought indicators and price has NOT broken support. Only under 2040 can I get bearish now.
Geno, I’m not overly bearish. Just that on the DJIA I can see that there is still one more ‘down’ wave needed to finish the Ending Diag.
Yesterday I thought the Ending Diag had completed but the action subsequent to yesterday’s low had me worried as I mentioned. So I’m expecting one more drop then a huge rally.
Certainly on the S&P I can see a new ATH. On the DJIA it will retrace a VERY BIG chunk but not a new ATH.
That’s how I’m playing it right now.
The point at which ‘I’d be wrong’ is today’s high.
Thank you kind sir! Hope you are successful in your trades.
A lot of money has been leaving China for America in the past couple of years.
What will happen if the yuan drops 10, 20 or 30%?
Will the flow stop?
Will it reverse?
Will it accelerate?
Answers on a postcard please to Zhou Xiaochuan, c/o the PBOC, Beijing.
Ms Yellen might like a photocopy too.
(It’s all about to get very interesting indeed).
PALS, next week:
Phase: + cycle ends Tuesday
Distance: – Mon to Thursday
Declination: + Mon to Wed
Seasonals: + all week
Planets: ++ all week
Summary: Moved out of US SM into cash. Will enter Friday as close to low price (there may be big sell off, then late day rally). Will exit Tuesday if price has risen or stay in if price continues choppy pattern. Moon phase is especially bullish next monday and tuesday, which is the end of the favorable moon phase cycle.
Unless we take out 2040 odd on a close, I favour a lot of volatile churning until price resolves itself. Yes, money leaving China, willit go to a market that is within a few% of an all time high? Maybe, but if I was looking for a home I would be looking at sectors that have been bashed to hell, like GDX and so on. Infact, that is what I am doing.
A blow-off top is always possible, but it feels like indecision is creeping in. Many long term investors look at monthly closes, as the market goes nowhere basically for a few months profit-taking will start to come to the forefront. I can’t see that there has been any serious profit-taking for many years, and even buy and hold types who are addicted to seeing their paper profits flourish will realise that nothing has been gained until it is banked.
We will see, but I am not overly bearish until price action looks to confirm a break. in fact if 2040ish is seen I may sell some of my Sep calls depending on the situation.
Good luck and be careful.
J
By the way, someone mentioned oil dropping. If you take a look at Cushing and the surrounding infrastructure this is not so surprising. Whiting may be out for some time (keep an eye) so there is a lot of Canadian Crude looking for a home. It can easily get to Cushing ofc, and there is the statistic that the outage surplus alone could fill Cushing in 58 days. In fact, Canadian heavy as result was trading at close to $25 per barrel, which leaves some companies struggling even to cover production, transportation and blending costs.
I am not trading WTI at the moment as I have to get some clearance to prop, even though I am not trading in a professional capacity in this market per se. Shouldn’t be too long though, it’s going to be very interesting imho.
J
Small long dax at 10960. More of a punt than anything else. Not going to build a proper position until the volatility dies down.
Trend still intact, last few days look like bear flag to me:
http://screencast.com/t/qvryyEfCU5
Fun & games, the narratives are changing:
http://www.bloomberg.com/news/articles/2015-08-14/china-increases-gold-reserves-by-about-1-1-in-july-pboc-says
Maybe the world could use a deal, but I don’t get the scare mongering. What has it got to do with the dollar being the reserve currency?
Why does it net benefit the US to be the reserve currency anyway, as there are costs in terms of jobs for example? I am not saying that it was not useful in the past, but when structural unemployment is high, young minds are being wasted and this will be a permanent shift as time passes.
Q: ‘Why does it net benefit the US to be the reserve currency anyway’
A: http://www.reuters.com/article/2015/08/12/us-usa-budget-idUSKCN0QH29O20150812
Reserve currencies are largely mythical John, always been about the reserve *asset* that surplus countries choose to accumulate. Uncle Sam has lived high on the hog on the back of the rest of the world for c.90 years, but it’ll be over within 20 years or so. Its debt and its currency will perish.
Should I move to a different country? 🙂
I would.
Well today’s down day didn’t materialise. Including out of hours trading I can see a small scale triangle forming on the DJIA which should break to the up side and then reverse completely.
I think Steve T’s choppey chops may be coming to fruition.
Today so far has been another inside sideways day and does not bode well for the SM in the present bullish lunar cycle. Action from Aug 12 onwards looks eerily similar to July 27 to 31. The Aug 10 gap up and then next day gap down followed by extreme Aug 12 sell off is severely constraining the upside possibility for early next week. Instead of potential 2130 SPX (viewed from Aug 7) target for Aug 17/18, the resistance might cap upside to maybe just a paltry 2100.
If it popped to that level on Monday and then reversed to close unchanged or down from today, then it would be very concerning and increases the probability of a new downtrend channel from the July 20 high with a measured low towards 2045.
Steve T, I’m arriving at similar conclusions to yours but from an EW angle. If the small (tiny?) triangle on the DJIA plays out we get a pop up (probably Monday now) and then a big reversal down.
However that reversal down would finish the ‘Diagonal’ and lead to a powerful upward reversal.
Steve T. may be correct but I see top on Tuesday, possible gap up move 2% higher, just the thing when traders have been lulled by recent price inaction.
2% gap up move in two days would put SPX to 2130, which is my original projection based on a thesis of a potential inverted head and shoulders formation where that price is the neckline.
Anything goes in these markets but I now view that 2130 scenario’s probability as significantly reduced based on action thus far this week.
does this market even have the energy for such a gap?
Yes, the market was in a stealth correction since May and now it is turning up… believe it or not:)
It is disguised because of all the choppy mess which is running for almost 9 months.
How to spot it – market breadth,cycles, corrective EW patterns…
do you think gap up?
More currency and commodity (Gold) sell offs on the way:
http://www.valuewalk.com/2015/08/emerging-markets-currencies/
Valley, does the VSC mean anything to you? Or just VIC? Thanks in advance. I am learning still and trying to compare with Bradley.
I see that VIC was close to the 3/2009 bottom.
New post, thanks all