
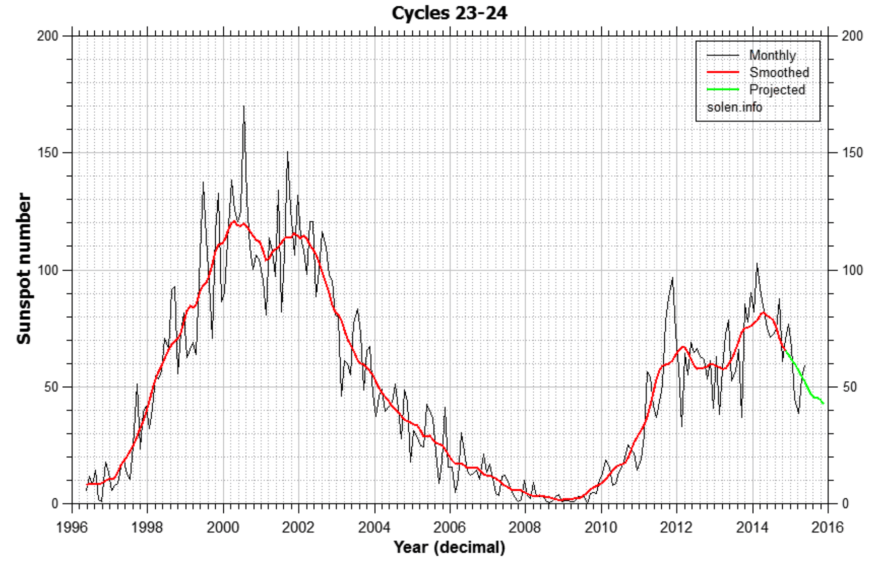
The smoothed solar maximum occurred mid-2014.

Source: Solen
Financial Conditions peaked mid-2014.
 Source: Bloomberg
World earnings peaked mid-2014.
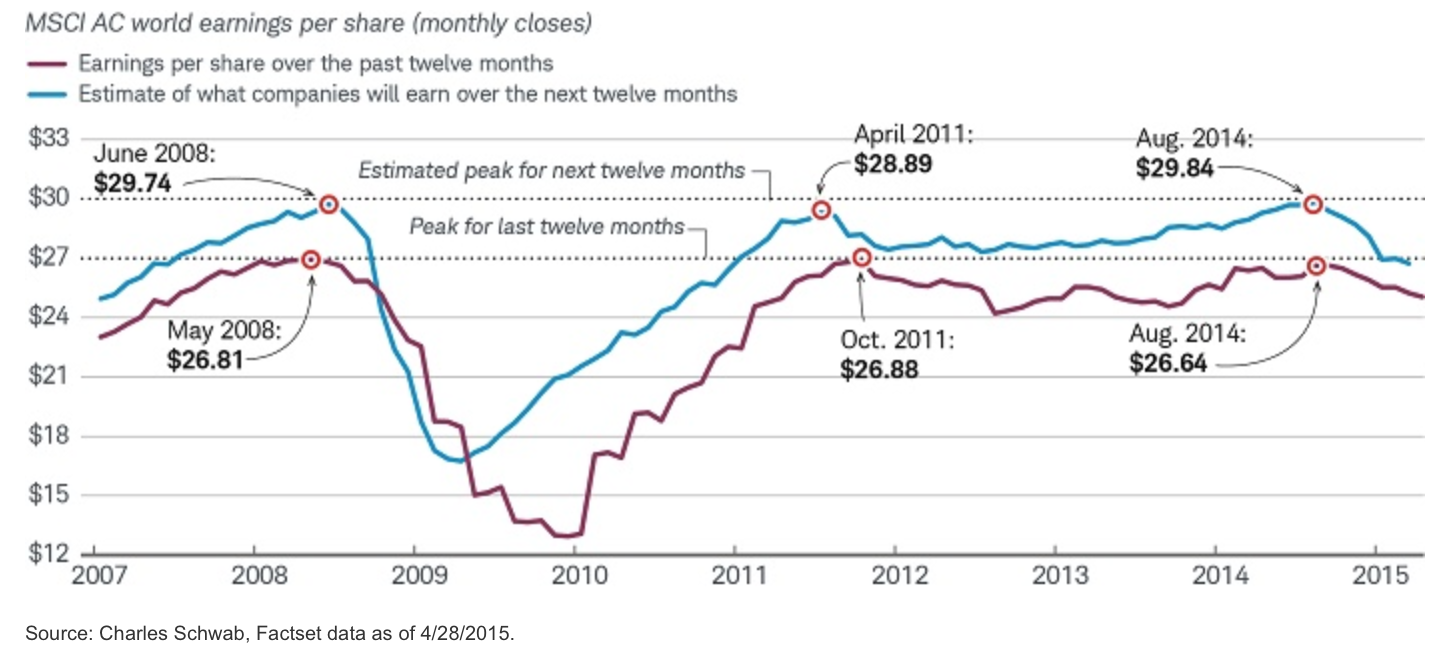
Source: Schwab
US IPOs peaked then.
 Source: Marketwatch
Buybacks peaked then.
 Source: Factset
US stocks:dollar, stocks:bonds, volatility (inverted) and breadth all peaked mid-2014.

Source: Stockcharts
Junk bonds, commodities and FX all changed course then. European stock indices have since risen in nominal terms, but if we net out the Euro’s decline from the picture then they too peaked mid-2014.
 Various economic data measures peaked out then.
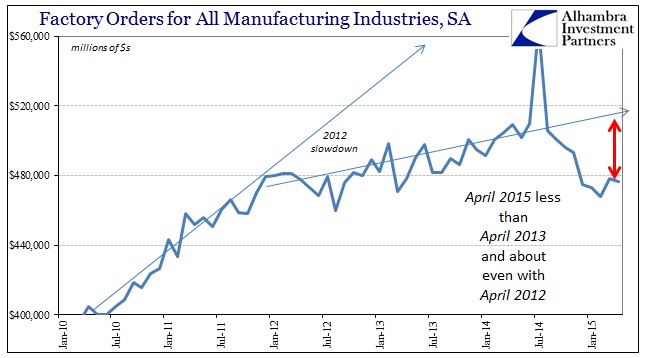
Source: Alhambra
This all fits with the theory of peak human excitement at the solar maximum, translating as peak speculation and risk-taking in the markets and peak activity in the economy. However, we need to continue to see further all-round degradation as the sun moves further away from its peak over the rest of 2015, and not least, we need to see the nominal falls in equities now come to pass.

thanks John ….n
Waiting for. Thanks, John
JH appears to sound more circumspect here,
unless I am misjudging the tone of that post.
The evidence so far is impressive, IMO, but it’s a slow process of hindsight.
Indeed, but we must explain it otherwise it looks like confirmation bias. Hopefully that’ll happen some day. Just been too busy to do anything about it.
Some recent macro has both disappointed and come
in weaker than forecast, very few would
dispute this, it’s been discussed widely on about
every online financial site.
However this alone is not enough to kill off this
bull market.
What that requires is macro weakness reaching an inflexion
point where mean earnings begin to roll over quickly
with mean dividends and buybacks beginning to be
scaled back.
At the very least the anticipation of this needs to begin
to gain acceptance.
For me this is what some people may be missing in their
outlooks.
You can still have nasty sells off without this happening on
sentiment shifts alone, however for the bull market to end
this has to happen.
We are all just guessing, this is about probabilities, not certainty.
Those who seek certainty on short term precise market timing
should stick to reading Aesop’s fables.
Peggy – when is the Spiral expecting a possible low in the 209X level? Looks like today may be a melt up based on futures action in the pre-market.
Expansion/Singularity is a larger trend. The posted price target was 2088-2092. Usually there is a double bottom or a higher low. Yesterday price came within 3 points of that target. Will there be a double bottom in the next few days? That’s where each trader needs to make their own decision.
Here are my posts from this am on the previous thread.
Peggy (@mjmateer)
June 3, 2015
Spiral update -User error! Spiral was UP from 4:20 to 9:10. Then down to 11:10. Price targets 2111-2113. Then UP (2123 target).
Reply
Peggy (@mjmateer)
June 3, 2015
next price targets 2111, 2109, 2107. Low in by 11:10.
Reply
Peggy (@mjmateer)
June 3, 2015
Spiral update: 2107 price target reached, next price target 2126-27
Reply
Also, the predicted low at 2107 this am is a higher low.
Phil, you keep banging the same drum don’t you?
You’re wrong, and just trying to justify your narrative.
The markets will turn down first, then the economy will collapse in a heap.
Credit spreads will widen, much wider.
That will kill the economy. That will stop buybacks, they’re not driven by earnings, but by credit costs.
Horses and carts, you continue to have them the wrong way round.
Please note, my comment is not related to timing, just your narrative.
You do appear to ignore the fact that broad US markets have been treading water for a year.
I suggest you re-read Johns posts over the past few months, the data is there for all to see.
Perhaps you simply are stuck with your narrative, that’s fine of course, but it’s wrong. And of course, you do repeat it incessantly.
GM, I like your posts, and I enjoy Phil’s too.
Can you explain why Phil is wrong precisely? Hasn’t he been calling for a summer top, and if summer has not passed, how can he be wrong?
Only time can tell if the market peak was made before or after earnings peak, but I believe the last 100 years has seen both cases.
Hello John.
I don’t think I can add much to what I’ve written above, which was not about timing at all.
I’m not really interested in Phil’s timing window, but notice he continually
misrepresents facts, especially re earnings, when the facts are often in the blog posts anyway. Facts are facts, plain and simple.
The Dow top date of 15th/18th May 2015, as per my cycle, is looking pretty good so far, although we haven’t actually had a big fall yet.
http://www.17yearstockmarketcycle.com/2015/01/djia-march-2015-cycle-high.html
Let’s see what happens over the next month.
Regards,
Kerry
GM,
Narratives make no difference,
price action does.
You jumped up and down a couple of months
ago calling for a correction, which did not happen.
At least have the good grace to accept you called
it incorrectly.
All you appear to do is want to tell others that they
are incorrect.
Now if that makes you feel better, great, go for it.
I took enough flack here last year from people
trying to force there bearish outlook, those people
have now nearly all disappeared.
I am not wasting time engaging in any further discussion
with you, pick arguments with someone else.
I’m not trying to engage with you Phil, just keep you honest. And you never engage on the facts I raise anyway, for obvious reasons.
Lunar Chord:
Full moon weak zone ends Friday
Perigee strong zone has begun
Mercury surprise sell off failed, now mercury supports price next 10 days
Venus mania until mid June
Far south declination today, strong zone begins
Summary: My all in leveraged short didn’t cost me much, but since market failed to respond to overlay of 4 to 5 reliably bearish factors shows its strength. Keeping a modest short position today, which I will exit at close of RTH.
Hi Valley,
I have been using lunar elements that you use in your chord but slightly differently, as follows;
FM 2/6/15 – bearish, apogee 26/5/15 – bullish, N->S declination – bearish. Two out of three bearish I was looking for a low near the FM.
Next one NM 16/6/15 – bullish, perigee 10/6/15 – bearish, S->N declination – bullish. So I am looking for a drift up into 16/6/15.
One thing I noticed is that ap-FM, pe-NM dates are drifting further apart and we will soon have pe-FM i.e a double bearish coincidence.
I just thought I’d let you know what I am looking at re lunar stuff.
Regards,
Kerry
Nice to hear it, Kerry. Every day or so, I find another interesting correlation between lunar position and equities direction. The key I think is figuring out the interrelation of the combination of effects, and figuring out how to add seasonality into the equation. Keep up the good work, and as the rubber hits the road over hrs, days, and months maybe we can find out a workable system. A read interesting factoid is that tides work on daily basis, market inexplicably tends to rise from low tide each day and top out at high tide. Not every day, but most, so for a futures account this could be a source of advantage.
Great book on Solunar theory = MOON UP, MOON DOWN by John Alden Knight 1972
http://time-price-research-astrofin.blogspot.com/p/delta.html
THIS (all caps for emphasis) is the best article I have ever read on moon and markets (except JH’s Lunar Edge article). Print the Moon Position Geo chart, and write “N” second slot after Gemini, “E” second slot after Virgo, “S” third slot after Capricorn, and “E” the first slot after Pisces. N is north, E is equatorial day after N, S is south, and E is equatorial day after S. This is the closest moon to market chart I have ever seen.
Exited short, in cash out of respect to the bears, looking for a buy out of respect to Peter’s leaping cat.
The move today in yields is, relatively speaking, stunning. Has anyone done any sort of EW analysis (and other approaches) to gauge where we’re headed?
See the Bonds section of the monthly outlook update.
Today’s rise in yield is likely a small-degree 5th wave or a 3rd wave up at one larger degree.
http://market-timing-update.blogspot.com/2015/05/mtu-weekend-ed-monthly-outlook-update_29.html
FWIW, I did in fact get that 2nd Sell signal last night, so from a 50% short taken on a prior post, by COB today my trading system will be 100% short….
I just added a few more shorts, so I’m (more) than there…
We shall see…. GL to all….
Barry
Agree it’s been a stunning few days in yields.
Europe inflation data has contributed with some
easing in deflationary forces, at least if you are an
optimist ).
ISM was also notably stronger than many expected
TLT is swinging lower lows, while Nasdaq Comp is making new highs. What a divergence.
rebound in all indices today and dollar weakening. I expect this has caused US markets to rise and have taken a short on the dow. Closed some dax longs on this rise as I think it will fall back to 11200 before rebounding higher (mainly due to the temporary strengthening of the euro). Opened a euro/dollar short too and looking to add as the short covering continues (medium term trade targeting 1.09).
Who would have thunk?
https://www.businesscycle.com/ecri-news-events/news-details/economic-cycle-research-ecri-reflation-vindication
I mentioned a while back that a credit crunch may be in the offing. Well, bonds look on the verge of really breaking down. Ironically, the mkt and the $ are doing the opposite of what one would expect in such a scenario
Kent, there are other possible reasons for bonds breaking down other than a credit crunch. What makes you think that’s the reason?
Vast majority of debt overseas is denominated in dollars. Developing countries are therefore essentially hugely short the $ and Russia as well. The scramble for $’s includes borrowing more which hikes interest rates which exacerbates the $ shortages which induces further borrowing higher rates, etc. Think how hard it is for resource and commodity producers are having meeting debt payments. Oil. Copper, farmers, etc.
Bond fakeout IMO, especially in the US, UK and Japan.
Watch those yields when stocks start to slide.
EZ bonds, wouldn’t touch them with a bargepole.
Gold……mmmm.
I am in the same camp too. The scary thing about these Hong Kong listed names is that they just open gap down -50%.
Since debt in China is infinitely good debt and guaranteed by the government, until one day it is infinitely bad without any courts and proper documentations as recourse, -50% is actually logical and much faster than how the US unwound in 2008.
http://www.bloomberg.com/news/articles/2015-06-02/troubled-hanergy-s-debt-web-snags-state-banks-to-shadow-lenders
So we have a CEO pumping up the share price to borrow more money to pump up the share price even more. And we have trend followers jumping in with margin debt and circumventing limits by trading China from Hong Kong or via trust products. And even the principal underlying the margin debt is based borrowed money from from P2P loans. This is either the most epic leverage bubble the world has ever known, or China has discovered a perpetual motion machine and everyone should seriously consider becoming communist.
We have a telephone directory call service in the UK, called 118 118.
They are now advertising that they offer loans to all.
99% interest rate.
Loads of takers I bet.
Madness abounds.
Yes 99% but per annum. China is up 100% per quarter, and there is no risk because if it doesn’t go up 100%, the entire system implodes and the government can’t let that happen.
John, governments aren’t omnipotent, more like incompetent.
Plus, I don’t think the Chinese government want that bubble, so it will deflate.
The Cat (HFT and Algos) have thoroughly enjoyed playing with the mice (everyone else) the last few weeks. constant bull and bear fake outs. I nearly added another batch of call spreads for a net credit near 212.50 today except for next week.
Interesting to see the june futures nearly trading in parody with the cash market as of 11:50 CST
Parody freudian slip.
Parody, parity same sound different meanings?
no…it was intentional.,,nice catch though:)…the market is a complete farce, parody, and as Armstrong states, when the populace lose faith in government, currency, central banks and no liquidity exists, it ought to be Epic.
This is a handsome Golden Tiger by the way.
SPX daily candlestick chart has appearance of a leaping cat.
I think its prey is done for
If it is “factual” that is
FWIW
FWABCW (For what anything beyond a chart is worth)
Spiral update – revised price target 2118
Please try not to displace my cat’s nose
Your phat cat may be too chubby to leap.
Ragdoll
Recently a early 1900’s ragdoll of a golfer sold for $550 at auction. Prices for collectibles are rising higher than most other asset classes.
Looking down John’s list, there are a lot of very important markets and economic data which peaked at the smoothed solar maximum. I would also add oil to that list.
So if the smoothed max did its work nearly a year ago to cause crashes in some things (eg. oil), and cause others to roll over into new bear markets, then what solar influence is there left now (nearly a full year afterwards) to cause anything to crash?
Still looking for the grand finale this fall:
I think there are only about four of us left who see the importance of this Joseph. Which is fascinating, given its implication for the near future! The smoothed max influence has come and gone, and taken everyone’s attention with it.
But look at 2013, the current cycle was at 40 whilst the older cycle was at c.95.
I think you’re both seeing a bit too much correlation here.
There is absolutely no reason why a spike lies ahead in the this cycle.
It could happen, but just as easily not.
I’m not looking at the spike GM; its the timing of the breakdown. Those who have been watching this for the past three years or more have not been surprised at what the main stock markets have done so far.
GM,
In those instances of divergence one of the hemisphere measurements alone captures the correlation. Some might call that overfitting but it fits the bill imo in a low sunspot plateau top type cycle. Do one of you have the link handy with the N and S measurements and ill create a new “overfit”version of the analog.
Spiral update: Most likely time for the Singularity low is 6/9 late morning. Most likely price targets 2091 or 2085. It is possible that the low is already in – time and price are close.
Not the size of Enron, but still, how many of these are there?
http://www.valuewalk.com/2015/06/is-hanergy-thin-film-chinas-enron/
The Russell closing in on it’s high.
If you are looking for imminent falls here
negotiations with Greece need to hit a big roadblock.
Strong upside risk on confirmations of a Greek deal.
maybe the market knows greece is solved and thats why it has not sold off. my guess is pop then drop.
https://www.tradingview.com/x/zm56ceR1/
Corp bonds getting sold……tick tock…..
Just, literally, LOL.
..at Phil’s Greek drama.
FYI, I am 175% short. Greece solved popped and dropped. Greece not solved drop. Upside risk 2%. Downside risk is 25% over next 3 months. We are churning at the top. If i am wrong I cover. I am not day trading this. Swing trade here.
Good call!
JH, still phasing in from “on the attack”?
Pausing here as we are now through the full moon. The truer geomagnetic seasonal peak would be the new moon of mid-June. Plus, with US stocks on the lower rising trend line I just want to see if they might rally up again. If instead they break down through then I will add again.
Thanks. Markets are just hanging here…
JH, I am also eyeing the Bradley turndate on 6/8/2015. Not sure if andre’s comment below is the same signal.
June 9th very important date; capitulation?
MSCI decision to include China due?
I hoped Greece would default and leave,
unfortunately Tsipras fought the election on
staying within the single currency.
I passionately believe that Greece should be outside the
Euro.
it’s an aberration that they remain within this
flawed mechanism, which is skewed by Germany.
Added to dax longs at 11200 and closed dow short. Building up larger dax long stakes now as the Greece deal rebound will likely be powerful. I don’t think after all of this they will just let Greece default. If they do what a fantastic buying opportunity it will create for the dax as panic sellers rush for the exits. The next step by the ECB will likely be a target rate for the 10 year bund which they will try and maintain through ECB purchasing. 0% seems a good target and will reduce the volatility. It will be a terrible move in messing with the monetary system but what other choice do they have.
#DAX bounces off the 11200 support, but remains vulnerable amid bond market jitters http://on.forex.com/1IfFDnX ^FR
http://www.thestreet.com/story/13172333/1/kass-this-market-looks-as-serene-as-a-duck-but-theres-turmoil-underneath.html?kval=dontmiss
Not sure I get Doug’s “serene as a duck” metaphor. That’s a new one.
FTSE bounced at lower wedge line:
Apologies, ignore the chart above, this one is correct. User error above, or technology, hard to tell?
I think these wedges are so broken, waterfall declines are inevitable. Head & shoulder patterns will be in play if that happens, assuming a bounce happens at the October lows.
Krish, I think you are going to be on the right
side of this.
The Euro lifer politicians are unlikely to let Greece
walk away, they have so much emotionally invested
in this project.
A 3% plus pop in the DAX on a deal confirmation?.
It looks likes it’s going in to next week atm, let’s see.
Greece has no desire to walk away from the Euro, they have repeated that over and over. It’s a stable currency, post-default, they wouldn’t need to devalue anyway.
Yep i closed some of my earlier opened positions at 11400 and have left my 11200 long in tact. A deal confirmation hopefully will propel the Dax to 11600-11700. If the euro weakens at the same time maybe we can head to 12000.
Spiral update – minor up to 2112, 2115, 2118. Then down to 2092-2095.
High mid morning.
Peggy – so a small bounce is expected this morning followed by a downturn to 2092 – 2095?
yes.
Gold, now at $1179, is flirting with a major breakdown towards $992. It has closely followed two Fibonacci sequences since its natural high at $1800 ($1192 was a temporary overshoot).
Sequence 1: 1800-1636-1539-1460-1380-1282-1126. This one was completed (more or less) during early November 2014.
Sequence 2: 1800-1605-1488-1395-1300-1182-992. A breach below $1182 at this stage will probably bring $992 into play (over-ruling the $1130 low).
All prices in both sequences (so far) were reached at Fibonacci timelines. Lately, since early November, it is the prices of the second deeper sequence which have coincided to the timelines, so if $1182 cannot hold then gold will have a date with $992 during late August 2015.
So you just ignore $1,192?
Weird.
India is a major importer of Gold but with an El Nino this year, and the expected reduced Indian farming sector, Indian importation of Gold should decline this year and possible selling of Gold holdings due to drought to put off starvation.
In other words, due to the large Indian farming sector the El Nino could cause India not to import Gold but to export Gold.
Physical gold movements are literally irrelevant to to today’s 95% paper markets Richard.
It’s all about paper investors’ confidence.
I became a commodity broker way back in 1974. This so called paper vs physical is nonsense. It has been that way for a long long time. The sellers (miners) can deliver their gold if they want to, and the jewelers/users can take delivery if they want. Closing out contracts saves the tremendous cost of moving all that stuff around to meet what is basically hedging by producers and users vs speculators. The concept of paper comes from gold bugs finding an excuse why they have been wrong so much.
Kent, with gold it’s not futures, it’s XAU. Billions traded on that every day, physical hardly ever involved.
One day it’ll break. A new pricing market will then emerge.
Some stronger US macro this week folks.
Auto sales, construction activity, manufacturing data.
Jobless claims again today well under 300,000,
3 months of claims under the 300k figure.
Beige Book shows areas of weakness but the report
as a whole does not suggest a cycle that is rolling over,
at this point.
Data can alter quickly and it may look very different
by the end of the Summer, for now it looks like slow but steady
growth in Q2.
It may also be one of the reasons the RUT is now very
near it’s all time high.
IMF warns FED to delay rates hikes to 2016 – breaking news.
And that’s all from CNBC for today.
Sun Spots may have to go to zero for a number of days before stocks top and roll over. Debate may want to turn as to how many zero days of Sun Spots will be necessary to top out stocks. Will it take ten days of no Sun Sports or thirty days of no Sun Spots to top out this stock market?
Spiral update. 2111 reached (forecast 2112), now close to low price target. Low expected by 12:20. Price target for next high 2117 (may revise that)
revised short term price target 2110
Peggy: I am in awe of your calls and the spiral tool. No tool is perfect, but you have mostly been spot on. Big thanks for your great calls and frequent updates
It’s the Spiral, not me. 🙂 Revised target 2104-2105, then 2085
Peggy’s short term calls have been quite spot on, although with the up and down day to day volatility, the path towards those targets have not come as easily or as anticipated.
I made a prior post about how the recent intraday fake prints on SPY have all been hitting with the last one on May 29 (FP 212.45) essentially hitting Jun 1 (212.34 high) or Jun 3 (212.67 high). I just noticed another fake print just now (Jun 4) at 211.86 (when the price was below 210.35) and that indeed jives closely with Peggy’s target price for futures at 2110 (typically priced 6 points below SPY).
revised to 2104-2105. Then 2085
Peggy, does the Spiral provide longer-term price targets?
Hi Richard ! The sun looks pretty hot today, that’s bullish for stocks. On the other hand, it’s pretty cold on Jupiter which should be bearish. Maybe, Saturn holds the key here. What’s the weather like on Saturn these days ?
Does somebody really believe this suff ?
Interesting that you are posting on a down day…
1) Dow theory Non confirmation. 2) NYSE A/D line has not confirmed new highs and last time that happened was September 14. 3) My buddies LT intermediate trend line hitting new low. Now all we need is a dow theory sell signal and the 4 year cycle top is in place. We shall see.
Before they changes the name from Global Warming to Climate Change, Jupiter developed a 2nd red Spot, Mars lost its entire Polar Cap and Venus was glowing in the dark! Anybody believe THOSE were Man Made?
http://www.crawfordperspectives.com/ ?
Arch, are you saying that Climate Change on planet earth is not due to CO2 buildup in the atmosphere, but instead due to a change in the amount of heat output from the Sun?
Wow, I feel privileged to welcome you to the site. Ref astrology pro or con. I am a member of the church of whatever works.
Maybe they have SUVs on those locations also.
And it looks like Uranus is just about lined-up in the correct position too!!
Nic, showing his true troll colours. Soon he’ll be gone.
that was his first bitter lil bitch comment on a down day. my guess is he got caught a little longer w/ too short a time frame to recover. I’ve been in that position before. still don’t understand why he trolls on this site since he is obviously uninterested in solarcycles (name of John’s blog for crying out loud).
my net credit spreads worked out pretty well they expire tomorrow. unless SPY goes north of 213, I will profit 65% in 4 days.
ok. left $120 on the table by booking $680 today after risking $1200 on Tuesday. i’m picking up some long aapl call spreads here for month-end 6.26 130/132s. aapl at the long support 50 day. now that I have taken a long position, we should really see a good capitulation and sell off 1000 points on monday. at least i have some american express august puts:)
Well done on your spread trade Scott.
https://www.frbatlanta.org/research/publications/wp/2003/03_05.aspx
This posting is for Nicolas.
It is kind of coincidental that precisely at Saturn opposition the top was reached.
Heatwave for Paris tomorrow Nicholas.
Looking forward to the tennis )
interesting hint at belief systems
i don’t understand astro in the same way i don’t understand point and figure or momentum. but i don’t ridicule them. to each his own and whatever works. i know trendlines and chart patterns with a little candlestick on the side.
but faith in central banking seems more like the easter bunny or tooth fairy.
but i could be wrong
My cat has something dripping from its nose!
Hope it doesn’t turn green
In which case the drip bowl is waiting
Maybe its a dead mouse bounce
i think you liked my kitty kat metaphor:) still valid until we see some capitulation. as andre hinted….is monday the day? is this time really different? or does greece bundling their June payments simply kick the can down the road?
My cat is not just any old kitty kat. It is a thouroughbred with its nose raised quite high. But elusive and appears with an impending nose bleed.
bradley siderograph turn date 28/100 power June 8
WOW!…..THEY and by “they”, I mean CB’ers are desperate to keep the lid on PM’s.
Anyone that thinks takk of PM manipulation is the talk of “nut job” conspiracy theorists needs to think and look around a bit.
To beging large global banks have ben fined for manipulating LIBOR, FX and many other markets. They committed outright fraud in respect of sub-prime and yet when talk of PM manipulation is raised?…..nah don’t be stupid!
Look at the recent actiin in Ag. On Friday silver back tested its 50dma the promptly shot higher to take out its 200 dma and was well on its way to break the downtrend from 2011 highs thus establishing a new bullish uptrend.
What happened within minutes of it breaking higher should be under investigation by the CFTC, of course we all know by now that they are complicit in the fraud and a proper investigation will never occur.
With the USD tanking and breaking support, silver miraculously reversed its VERY bullish posture and broke lower. And that is exactly what it has done ever since, head lower, despite USD weakness.
Notice that they had to hit Silver SO HARD, so that they could reverse the 50 dma back down as a vullish cross was looming.
These maipulators are now so brazen and that they don’t give a s#%t about leaving giant footprints.
Am I worried?…….not in the slightest, because it demomstrates to me just how desperate “they” have become to keep down what they know is a time bomb ready to explode.
They can’t hold back the forces of nature indefinitely!……….my God when it goes it is going to be like nothing anyone has witnessed before in financial markets.
Silver will outperfrm even gold.
http://stockcharts.com/h-sc/ui?s=%24SILVER&p=D&b=5&g=0&id=p24683145132
Please be calm, my cat has got a nose bleed.
on the other hand, the ongoing correction from the 2011 top looks perfectly normal in EW terms.
pC, perfectly normal because??…..
You have a market where the paper contracts dwarfs the physical market by a factor of over 100 and 90% of producers can’t produce at a profit….something is seriously wrong. You don’t have to be Einstein to understand that on the ocassions where a large commercial dumps enough contracts to overwhelm the long side without any regard as to price, is and of itself quite literally absurd.
The purpose of futures was to enable producers and large end consumers to hedge risk, not to use paper contracts to create a market where 90% of producers are underwater.
If there were no paper market I have no doubt that silver would be significantly higher. Common sense tells you that to be the case. Futures have not assisted silver in any way shape or form other than to allow large commercials to manipulate price and thus the futures markey should be abandoned.
Oh and as far as EW goes…..show me 20 expert analyists suggesting a move in one direction and I’ll show you 20 more experts suggesting the opposite.
Allan, just look at the other industrial commodities, silver bubbled, then crashed, much like oil did pre 2008.
It’ll be back, when it’s ready.
GM, I am not saying that silver is or can be manipulated against tne larger long term trend. Thus my statement:
“they can’t hold back the forces of nature indefinitely”….however
How can any commodity possibly sell for lengthy periods of the time for less than what 90% of producers can mine it for?…..it makes no sense and thus leaves it quite clear.
No market can do that if it is not manipulated. The massive size differences between the paper market compared to the physical market enables this to occur.
On this one we’ll have to agree to disagree Allan.
Enjoy your weekend.
I’m off to sunny Morocco tomorrow, for some golf and rest in the sun.
Allan, you’re right, EW analysts can be all over the map. So what? Show me 20 TA guys who are bullish, and I’ll show you 20 who are bearish! Does that invalidate TA?
My point was not to praise or denigrate EW. Just saying that gold’s bear market looks normal to me. I don’t need “manipulation” to explain it.
Forget EW. Just look at TA through this lens and you’ll see the same thing.
http://rambus1.com/?p=38244
Gold’s bear market from the 2011 high has been textbook. You don’t need “manipulation” to explain it.
As mentioned yesterday Greece is key to any significant
imminent sell off.
If Tsipras were to reject final proposals and
call a general election then bears are in business.
I would like Greece to walk away from this German
benefitting single currency, Germany running huge trade
surpluses above agreed metrics without any reprisals.
Greece is not the problem with the Euro, Germany is.
With Germany outside the Euro the single currency would
be significantly weaker, instead it punishes the periphery
while hugely benefitting the strongest member country.
The odds favour the Euro lifer politicos preventing a Greek exit
as they struggle to preserve a pernicious vanity project,
the single currency.
Greece does not matter. irrelevant.
BlueStar, I fear the unknown unknowns, shouldn’t you?
when this market decides to go down news flow will cease to matter. I think we are at that point. Greece solved we pop and drop. Greece not solved we drop. Either way we drop.
Oh dear, Phil’s stuck on permanent repeat.
Devalue, devalue he cries.
Like that ever helped anyone one iota (in real terms).
He’ll hate the Euro ascendancy to come, whilst the Yen, Sterling & dollar collapse.
Got gold?
Lunar Chord Friday:
Tomorrow on all factors except recent price action price should rise significantly.
Monday: All factors positive except seasonals.
Tuesday: All factors positive except seasonals.
I would have shorted today but account was not available. Will go 100% long tomorrow if price gaps up, with a stop at .1% below the opening price. Tomorrow “could” be a 1.5% up day.
All lunar chord prices refer to Dow, Spy, or QQQ.
Spiral expects another low at 2085 (bounce to 2104-2105 first)
Well if you are short the UKX folks you’ve had a really
nice week, sub 6800 at the time of this post.
Paul McCulley is one of my favorite economists: http://www.valuewalk.com/2015/04/paul-mcculley-wealthtrack/
Break of 11200 of dax is bearish short term so I have no positions on it. Stop losses worked to prevent any losses. Waiting for the capitulators to book their losses and then back in for the long trade. Still plenty of upside left in Europe once the bond market volatility reduces but the potential for further declines is high on the dax short term.
Spiral expects a high near 10am – price targets 2102, 2105, 2108
The job’s number exceeds about any estimates.
It confirms this week’s data that Q2 has seen a recovery
and appears to validate the FED’s expectation of an
acceleration in economic activity.
GM
So US economic cycle is rolling over
according to you.
You must be due a good call at some stage )
Have a good weekend folks, the Murray match
to look forward to this afternoon.
These two comments betray your lack of insight Phil.
But you keep looking at the headline (lagging) indicators, and I’ll look at John’s posts and many more elsewhere, and leave it at that.
In my view by the way, everything changed today for these markets, and the ratio I’ve been watching at Screwtapes (10 year USTs priced in silver) hit a key trendline too.
Spiral update – the larger trend is down to 6/6 – am expecting that low on 6/8 or 6/9 with price targets 2063, 2046, 2028.
Peggy, is it possible that the spiral gives an inversion? I think June 9th is a major change in trend, with a high on Tuesday.
Cheers
andre, what is the reason? I see Bradley turn date, and also MSCI announcement on including/excluding China.
We have last quarter at perigee; and it’s the highest perigee this year. It coincides with declination extremes and Mars going OOB June 7th.
I use 3 different bradley systems and they all align early next week.
Mercury turns direct on Thursday, but has an impact +/- 3 days.
Mastertiming on the 1929 high (a very significant high) gives June 8th.
And I use other timing tools that all point to early next week.
Hope this helps.
P.s. If my timing is correct we should expect a major sell off to start next week with many months of downtrend. This confirms the expectations of our host J.H.
Will give some more dates in my Sunday post.
I don’t think so fwiw
Thanks, Peggy.
just planetary hours CIT’s
10:25am Jupiter
11:40am Mars
12:55pm Sun
2:09pm Venus
3:24pm Mercury
as always +/- 5 or less minutes 🙂
Please, what position of planet relative to earth and sun causes CIT?
valley… no aspects are involved in planetary hours. There is more to it .. check
http://www.timingsolution.com/TS/Articles/DT_Swing/ … no affiliation .
I do not day trade.
Thanks!
Anytime you want to post these would be appreciated, btw, is above time EST as in New York time?
yes EST and here is the link I use >>
http://astrology.aaazen.com/hours/newyork.html never afraid to share 🙂
Thanks!
Spiral high near 10 am. might only get back to 2096-98. Lower prices ahead.
Spiral update – expecting a low 11:30 to 12:00. The Singularity low is arriving. 2085, 2077, 2063. Between now and Tuesday.
The size of today’s upturn in the US unemployment rate might not be that significant, but the timing definately is (coming shortly after the effective SC24 max which was a process from September 2014 to March 2015): https://ktwop.files.wordpress.com/2013/04/gorbanev-business-cycle-and-solar-cycles-mpra_paper_40271.pdf
See page 17. If the relationship between US unemployment and solar max continues as it did in the last six maxima, then we will soon see a sharp increase in US unemployment.
Mark, we’ll have to keep a close eye on weekly claims then.
Mark, employment is a trailinging indicator, remember how dire it was from 2009 onward as the mkt was going up. Typically, employment world appear good as the mkt goes down. Reality can’t change as fast as the markets. There are trees being cleared all around me for new housing subdivisions. They will go ahead and built all those houses improving employment and consumptions even as the tide has peaked.
Absolutely Kent.
This is how businesses go bust, they don’t see it coming. Yet Mr Buffet has been cashing in of late, the old crook.
No.
Kent, I’m afraid you’re incorrect. Employment, or more precisely, weekly unemployment claims for unemployment insurance ARE a leading indicator.
Although the general unemployment rate is widely seen as lagging, these weekly claims are described as “the nation’s earliest economic data”, so given the timing implications at the moment I will be following your suggestion to keep a close eye on them Gary: http://www.forexfactory.com/calendar.php#graph=54315
I’m interested to see that they have been potentially bottoming since mid-October 2014 – very close to the effective solar max dates I gave above.
Any weekly figure coming in above 300K (and especially 320K) will be very significant.
Employment, whatever measure one looks at, is a lagging indicator.
If you think otherwise you simply don’t grasp how businesses run their operations.
On this occasion I will not explain, do your own research.
I have read that unemployment is a trailing indicator so often I consider it common knowledge. But Gary, I googled unemployment and recessions and it took me to BLS. It clearly shows in ten or 11 cases out of 12, unemployment bottomed before the recession and topped after the recession.
The ten components of The Conference Board Leading Economic Index® for the U.S. include:
Average weekly hours, manufacturing
Average weekly initial claims for unemployment insurance
Manufacturers’ new orders, consumer goods and materials
ISM® Index of New Orders
Manufacturers’ new orders, non-defense capital goods excluding aircraft orders
Building permits, new private housing units
Stock prices, 500 common stocks
Leading Credit Index™
Interest rate spread, 10-year Treasury bonds less federal funds
Average consumer expectations for business conditions
Spiral update 14:20-30 low, then up to close
So just to clarify, unemployment leads going into a recession and trails going out
No, it’s a leading indicator of the business cycle, which means it leads (but obviously in opposite signs) both contractions and expansions.
In your own words Gary, try explaining how a manufacturing, (or any other) business would cut jobs before it realises the economy has permanently turned down into recession.
Think about it, take your time.
But I’m not holding my breath.
And perhaps try ranking those conference board components too, from first to show a red flag, to last.
Singularity (low) occurs 6/6. Is 2085 the low? Use your own triggers if you want to trade this low. 2077 and 2063 are possible. Tricky!
how much money Americans are allocating into gold? 0,2%? STUPIDS!!
I tend to visit this site less often than I used to. The bearish nature is constant, every article points to last gasps of a topping process and imminent crash of epic proportions. As the market grinds higher, disbelief fuels suggestion of conspiracy that the Fed creating a bubble. I believe the solar max has exerted its influence on certain markets (I.e. Oil). But equities remain in an uptrend. I would encourage those to have a look over at Market Oracle. The author has been calling higher ever since 2009 and continues to do so. He correctly warned about the 1987 and 2007 tops. Here is his latest article:
http://www.marketoracle.co.uk/Article50743.html
http://finance.yahoo.com/q?s=%5ENYA+Interactive
And yet Duncan, the NYA, a very broad measure of US markets is flat for at least a year.
I suspect we’re all fed up with the long topping process, but John H has identified it as such ever since I started visiting.
And he’ll be correct that it ends shortly, to be followed by a weird little bear. Or a monster bear.
Duncan, many thanks for the link and context.
I accept there is a bearish bias here, it’s usually worth considering another take.
Perhaps because of the length of time
people have been waiting for a market top, a degree
of delusion is beginning to set in.
This is amply demonstrated by comments made on the US
economy this week.
There is now clear evidence from multiple data reports
that following a very weak Q1, Q2 has seen a return to growth.
No one is claiming the US economy is booming, or that
the recovery from a recession low has not been disappointing.
However the US has returned to slow growth in Q2,
to try and deny that is ridiculous.
It may look different by the end of the summer,
but that is where we are now.
The cycle does NOT need to roll over to have corrections,
they can happen on sentiment shifts alone.
The cycle DOES need to roll over for a new bear market.
(apologies for the use of capitals but it’s a key point).
So for markets to roll over now in to a new bear, macro
has to come off hard over the next few weeks, which
does not appear to be happening.
Bottom line, correction more than possible,
new bear market a remote possibility atm.
Lets see what the summer brings and if the outlook alters.
Away oh holiday for a few weeks so wishing everyone
good fortune in the meantime.
Have a great holiday Phil.
Happy and restful Holiday, Phil. Look forward to your opinions on the market when you return.
Thanks Phil. As I have mentioned before you have suggested a top this summer for some time which I thought was a good call. Not only because it was said last year but also becuase you are willling to admit it was a bad call if it doesnt transpire. You have also backed this up by saying you want to see earnings move lower.
I guess the issue I have with John’s articles in recent months is his determination to come up with a new forecast each article. Also the recent reference to zero hedge is quite simply unbelievable. How anyone can take their analysis seriously over Chis Puplava who again starting ringing the alarm bells in 2007. No doubt there will be another bearish article coming up pointing to an increase in margin debt when that is only a concern if it falls while prices rise. Apologies for the rant. Just need to provide a balance as Q2 economic indicators improve and we continue in a bullish trend
Thanks for the counterpoints.
Has anyone heard of the “Funk” cycle of 56 years? According to this interestingly named cycle market may be in excess production phase (irrational optimism) set to last another 3 years. 56 years ago was 1959 and market didn’t lose momentum until 1962.
http://time-price-research-astrofin.blogspot.com/2015/06/2015-in-56-year-funk-cycle.html
Hadn’t heard of that one before valley (but definately heard the funk of 40000 years many times).
So Funk and also Benner, and McWhirter/north node (all mentioned on time-price-research at the moment) are all pointing to higher US stock prices towards 2018. All in very close agreement with Gann’s Financial Timetable and the weak solar cycle (ex.SC16) scenario I have been mentioning. I give an SC16-type major crash a 20% chance, and 80% to much higher prices by 2017 (following major volatility at the ISN breakdown). A continuing loss of faith in government paper promises will be the fuel.
Also interesting to see that Funk, Benner, McWhirter and the weak solar cycles (from the 1930s and earlier) all pre-date the maximum extent of adult human memory.
On the esoteric side, Saturn in Sagitarrius happens every 29.5 years, so ’86..’57..’28; each time bull market while event occured. On the bearish side, and gold bug supportive, Bob Hoye who is 80 years old and has been in the top echelons of stock market analysis for 50 years or so said on Goldseek.com youtube video that CB money creation is irrelevant, what matters is where speculative money is going. He sees bonds and stocks getting much lower this year due to speculative reversal and hmmm maybe this largesse will find a home in commodities and PM complex. Maximum profits is what speculative investing is all about and since they are the lowest priced, they would reward investors with the highest return.
Good points; to which I would just add that as well as the speculative money moving from market to market, we now also have the beginnings of savings moving into speculation in an effort to avoid confiscation, bail-in, tax, interest charges and forthcoming out-of-control inflation. Not even an 80 year old will have any experience of the levels of money creation we are seeing (unless he lived in Zimbabwe a decade ago).
This will float many boats, with western government bonds being the obvious exception.
Hi Mark, As you mentioned previously that US unemployment rate and interest rate would increase post the SC 24 max, what would be the reason for a 80% chance to much higher stock price by 2017? Thanks.
KL – I get the 80% figure simply from the proportion of previous similar (weak) solar cycles where the speculative target markets became extremely volatile as sunspot numbers finally broke down, before moving significantly higher. The remaining 20% relates to the SC16 scenario of a massive surge followed by a massive bust. But by August 1929, Dow has risen by 484% in 7 years. Right now, SP500 has risen by “only” 220% in 6 years so even though the SC16vSC24 timing has been close so far, I have doubts about whether we have seen enough speculation to see a 1929-style crash soon.
As for interest rate increases, I don’t believe they reliably caused stock market weakness before: http://kingworldnews.com/wp-content/uploads/2015/03/KWN-Saut-3192015.jpg
Unemployment rate (and then all of the other relatively modern technical indicators and data) – those things are still valid but are not the main driving force at the moment. Rising unemployment will most likely be seen an another excuse for more QE, and Central Banks have already created a situation where saving money is increasingly being seen as riskier than investing it.
Thank you so much for your excellent response, Mark
Valley
It is an important point re Hoye that I have tried to get across many times. By focussing on price I am really looking at market behaviour, instead of trying to guess what might occur in the future. I still have to take a punt of course, but I do not follow cycles because in my experience they only work until they don’t – prices never lie. They can fake out of course, but never lie. That said, yes you have to consider where money might go. It may just be that at this stage after 5-6 years of 300% gain on the US indices that 80% of people are only just waking up and are going to go long at these levels. In my opinion however, I suspect that most are waiting to buy a decent dip. At that point, as has happened in the past it may just be that the last of the distribution may happen and we get the 2nd chance scenario – unless it has happened already very recently. We never know what was the 2nd chance until after the fact and the smart money has exited and is selling hard. No one knows what is going to happen of course, but it doesn’t feel like we are at a stage where a lot of money is waiting to go long at a 1-2% off ATH’s…….if I am wrong that’s fine, but I know that I and most of the others (and their clients) I speak to these days are not either. SO where do you put money then? A sector that has been hammered to sh** for several years? That is what I am doing…..and people will wake up a few months after take off when FOX news starts to talk about it…..
Yes, I have some OTM puts on the SPX atm (declared here) but thats all I have short as such. I know what my downside is so I am comfortable with that….and it partially hedges certain other exposures I have in any case. Of course, as with all options there is always the chance that it becomes a multi-bagger, I am reminded of some Dax puts last year that came in at 12x stake profit. That may mean I am due a loss of course lol:)
The main reason to go long now in terms of new money entering the market is almost certainly “fear of missing out” in my view. I don’t follow that sentiment, I look for other opportunities. Out of interest, if you were in cash now and looking to find a home for it for 2-5 years, where would you put it? US stocks?
Good luck all.
J
(No ego massaging clairvoyance here, just trying to make a living).
JS, from what I have gathered most of the QE money has gone into the bond market since 2008, much more than the stock market, and none into commodities. Guessing but say ratio of 10 to 1 to 0, bonds to stocks to commodities. If the 10 is unwinding, and assuming money once created and invested becomes indestructible, doesn’t that imply that stocks will have the overwhelming speculative bid fleeing bonds? (commodities are so cheap, and such a small sector a tiny amount of this capital will overload it). This may result in tail wind for general equities markets for at least a few years. This could come at just the right time as pension funds in the US at least are vastly underfunded. Main street investors may go along for the ride but they are small potatoes.
I didn’t realise Bob How was 80. I enjoy his writings.
By the way, nearly all of the QE is now sat as pointless idle bank reserves held at central banks. It was purely a psychological ploy, and a yield compressor. The new money creation to watch is bank credit, and my man Jeff Snyder at Alhambra notes that banks are de – risking. Hence the dollar tightness, mostly in the euro dollar market.
If you don’t grasp how the euro dollar works, and what euro dollars are, you’ll be likely fooled by the trail that lies ahead. It’s all about the banks, not the central banks.
But I agree, gold is very cheap, and due to turn up, so I’m still buying the hard stuff.
For the record, I’m still long Govt Bonds for clients, just not EZ bonds.
Final low in yields lies ahead in the next year or two in my opinion. Current blip is just noise, coinciding with the final flurry in stocks.
Do you have any exposure to equities? Short?
In your own words Gary, try explaining how a manufacturing, (or any other) business would cut jobs before it realises the economy has permanently turned down into recession. Think about it, take your time.
But I’m not holding my breath.
I’m taking my time because I have no idea what the point of your sentence is. To me it reads nonsensically.
Well Gary, that’s what a business would need to do for jobs to be a leading indicator.
It’s a matter of fact that jobs are the very last cost to be chopped, after every other cost has been cut.
No, I won’t explain why, it’s obvious to anyone who grasps running a business.
According to the following data going back to 1971 and gold in pre-election years, it should bottom late June and head higher into January16.
That supports several other cycles I have knowledge of and also supports the bullish action to date in Aussie and Canadian gold stocks.
http://www.seasonalcharts.com/zyklen_wahl_gold_preelection.html
No choice now but to change my short term views on the DAX. It is looking bearish and I expect further falls to 11,000 or lower. No positions but will be looking to add long when the signals are there.
buy the DAX this is a bottom…
Hi Karni, i replied to you on a former post, but probably you haven’t seen it.
Your last EW count was pretty accurate. Based on what are feeling this is the bottowm and what is your scenario going forward with the DAX ?
Thanks for sharing any update here.
Best,Joseph
Hi, yes I have not seen it. I am not scrolling a lot the forum:)
I am using combination of TA,EW,Cycles and market breadth.
TA – bearish, still have to work on a bottom the index….. and decent entry signal
EW – since October an impulse is running wave 5 is missing. The current move lower looks like a zigzag which is near completion… two legs lower.
Cycles – week 35 of the 40 week cycle.
Market breadth – stocks above MA20/MA50 at 2 standard deviation second low probably higher low divergence
http://www.indexindicators.com/charts/dax-vs-dax-stocks-above-20d-sma-params-2y-red-x-5ma/
http://www.indexindicators.com/charts/dax-vs-dax-stocks-above-50d-sma-params-3y-red-x-5ma/
Much higher probability that we are close to a bottom wave 4 than a top. It seems highly unlikely at this stage(cycles and breadth) to begin wave 3 and to count the two legs lower 1-2 1-2.
“Those record profits that companies are reporting may not be all they’re cracked up to be”
No S#£T Sherlock!
This whole sordid global ponzi scheme stinks to high heaven and we’re all part of it.
Accounting practices the last two decades have been allowed to becomes so twisted that compnaies can basically make it up as they go along. Central Banks have distorted monetary policy to the gree that bond markets are about to implode and yet everyone carries on like there is nothing to worry about.
This is going to be horrendous when it finally cracks and I want to be as isolated from it as I can possibly be.
We all deserve what is coming!
http://finance.yahoo.com/news/experts-worry-phony-numbers-misleading-070222254.html
My latest research shows some interesting things.
Firstly, the formal high for this bull was April 29th. Some shorter cycles target June 9th. That’s why volume has dried up in May. Anyway, tomorrow will be a capitulation day. Expect the bottom between oct 30th 2017 and nov 11th 2017 before we are up again into mid 2020.
I can now see that april 17th 2010 should have the low in the 2007 decline. The Fed started QE in 2008 and messed up the cycles. The 2009 low was too early so the market consolidated into early 2010 before the wave up really got force.
The dates are 100% harmonically derived and confirms John H’s scenario.
Cheers,
André
completely wrong there is one more high intermediate term
and long term the move lower 15%-20% what so ever will not be the the top of the bull market another mania higher will follow before implosion.
Sounds right too according to Elliott long term chart I recently posted.
karni, would you have a wave count you could post please? Thx.
Nothing special – long term the two options wave 3 or C is finishing.
Intermediate term ED but I think it is not finished.
Distribution is running for a long time… since last summer the SP500 is only 100 points or 5% higher. Distribution is running and we will see severe correction.
But I think the bankers will try to save the system at all coast and we will see crazy shit.
Cycles are more favorable for another mania phase too, so I think this will not be the top of the bull market.
Long term cycles and EW DAX – http://practicaltechnicalanalysis.blogspot.co.at/2015/03/very-long-term.html
Thank you Andre…nick
Andre, is this just based on gravity?
Spiral expects a low at 11:10 – price targets 2084, 2081, 2079
Spiral update 2079 still possible
7442 Analytics is live! http://www.ustream.tv/channel/7442-analytics
2079 reached. new targets 2085, 2087, 2089
Hi Peggy, the spiral was expecting a singularity low today. What is now the target and the dates of the next uptrend ? Many thanks for sharing.
Singularity was reached on 6/6. The actual low is coming in now – targets 2085, 2077,2063, No price projections for 6/20 Expansion high yet.
2085 reached. 2070 next target
Rising US unemployment rate and stock prices;
“…unemployment edged up from 5.4% to 5.5%. Wait a minute – why’s that a good thing? It’s a good thing because the rise was driven by nearly 400,000 people entering the labour force. In other words, the number of people actively looking for work is rising…That’s a good sign because it means that the number of ‘discouraged workers’ – people whose hopes of ever getting a job have deteriorated to the point where they’ve given up – is on the decline. That suggests broader optimism and a healthier jobs market”. http://moneyweek.com/another-reason-to-be-wary-of-bonds-us-wages-are-rising/
So if US unemployment is in fact bottoming in line with the tail-end of SC24 max, then it will be interesting to see whether it is because of,
A) previously discouraged workers coming out of the woodwork to join the party, or
B) increasing initial claims for unemployment insurance.
http://m.research.stlouisfed.org/fred/series.php?sid=CIVPART&show=chart&range=max&units=lin
Yes, the labour market is buzzing alright.
Sigh.
(Mainstream cheerleaders).
Agreed, Mark. And even though the result (unemployment bottoming) would be the same, the effect on markets would be polar opposites.
Wait a sec!……for the las 5 years the markets have COMPLETELY ignored the horrendous participation rate and yet now we are expected to believe that it will suddenly backflip and pay it attention?
There’s no doubt that this participation rate/ discouraged worker thing is just a way for the government (of the mighty land of freedom and democracy) to push the headline unemployment rate lower. But this has been consistently going on for years, so doesn’t invalidate any turn up in the unemployment rate.
What would have the greater effect –
A) unemployment rate rising from a base where everyone has a job. or
B) unemployment rate rising from a base where participation is already very low?
The lower the participation rate, the more exaggerated the effects of rising unemployment will be.
Lunar Chord:
Seasonals down all week.
Moon phase: starting positive phase
Declination: up tomorrow, down balance week
Distance: perigee Wednesday, down Wednesday to Friday
Tides: up all week
Planets: Venus far west was 6/7, down until 8/10 conjunct.
Summary: Wednesday’s perigee “could” lead to wash out decline, if of sufficient size might mark short term bottom. Coincides with moon crossing equator same day which adds energy to price. Lost a couple Ben Franklins today trying to go long at low tide and price kept on chugging down. Next few days may offer nice swing trade to the down side.
I guess we are now finally seeing the devastating effects QE will have on financial markets looking at the DAX. The bond price volatility will create havoc and maybe it will be sooner than i expected. Assume there is huge amounts of capitulation going on in the dax and waiting for the time to buy. No way will my 14,000 dax target be reached this year if there is this sort of volatility!
Long DAX at 10880. We are near a bottom here so looking to add more this week. This is a capitulation drop in my opinion as other indices are showing far less losses
QE has and will continue to have the EXACT opposite effect of what it was meant to achieve and for all the cheer leading by those analysts that have heralded its great succes, awaits a huge wakeup call.
QE has destroyed liquidity instead of creating it and morphed global financial markets into a “Frankenstein”.
The eruptions in Bunds is only the beginning of what is going to become a global nightmare. CBer’s, most notably Ben Benanke amd Mario Draghi will go down in history as the engineers of the Greatest Financial Collapse in history.
Might be a good call but be careful Krish:)
J
Was going to leave it with a stop at breakeven but it still looks bearish so I’ve closed out at 11000. Might get another chance to buy in lower but i feel we are reaching a bottom.
Spiral update – 2070 target reached. Now headed back down. Price target 2069-70
7442 Analytics live stream projects 2086 and 2092 next. http://www.ustream.tv/channel/7442-analytics After this pullback (price now 2074), then 2086, 2092.
Spiral update – more downside ahead – next downside targets 2066, 2056
7442 Analytics Spiral forecast looking for 2063 next
It looks like the Bradley date on 6/9 is pointing towards a bounce rather than a top.
Bradley turn date does not necessarily apply to stocks. something else may be turning.
how wide is the window? I would guess there’s a leeway of a day or three on either side.
Who is this? – i live near Pima Canyon
Nice set up on BRKB imho……will keep an eye on it as I have enough exposure right now…
J
New post is out