

Phasing more into long gold, short Dow, and opened ETF agri long. Don’t follow me… here is my case.
Gold has been making a long base with rising underlying strength since July last year.

Source: Stockcharts
US stocks have shown an underlying decline over the matching same period, as evidenced by stocks:bonds, stocks:dollar and two measures of breadth.
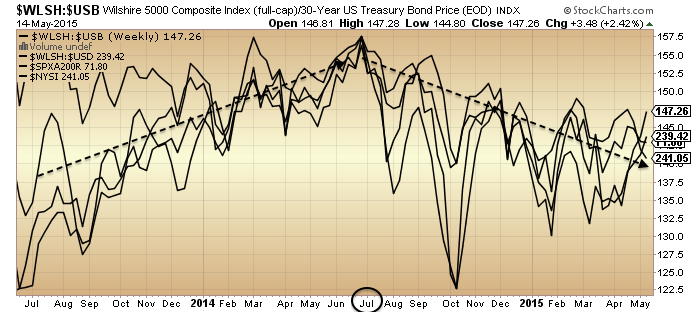
Source: Stockcharts
That turning point in both fits well with the solar maximum, a speculative peak.
The latest attempted breakout in equities has much in common with the July peak in 2011, before the sharp falls. Volatility, momentum, strength and breadth all suggest the breakout should fail.

Source: Stockcharts
Source: Gavin Parks
Geomagnetism continues to bother and is another telling divergence ripe for resolution, and its overall pattern is reflected in a variety of underlying stock market indicators.

 Source: Stockcharts
The US economy is in big trouble. If you haven’t already seen, Zero Hedge presented 7 charts arguing that the US is already in recession, to which PFS group then countered with 7 charts arguing against. I’m sure you all know to take ZH with a pinch of salt (‘fear sells’) but the charts they reference can be be seen at the likes of Alhambra and DShort on more neutral ground.
My input: the ZH charts are ‘true’ and show the US economy in deep water, whilst the PFS charts are also ‘true’, but on close inpection they mainly historically flagged once stocks had turned. In short, the stock market is precariously holding things together and is the only defence from outright disaster (as things stand) in a very fragile state of affairs. What is beyond argument is that certain economic data items are extremely ill whilst stocks are at all-time highs. In my opinion, that disconnect ‘beats’ any cherry-picking by either side and makes for a looming sharp equities correction.

Source: Not_Jim_Cramer
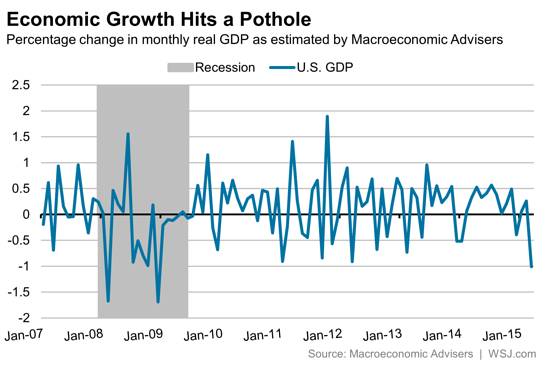
Source: WSJ
ETF Agriculture shows a similar basing to gold, with historically low current prices in various soft commodities set against a backdrop of a new El Nino and record global temperatures, which historically led to price rises.

Source: Callum Thomas
Source: NOAA
I can’t rule out equities pushing on a little higher yet here before finally rolling over, but I see it limited to days/weeks due to all the telling flags. So my plan is to phase in rather than load in in one go, and that applies to all 3 markets.

Terrific analysis as always. I hear you on this. I distinctly remember during the dot com bubble way back in 2000, stocks were in a manic phase, with divergences appearing all over the place, like we have with the transports now and gold was much unloved at 253 an ounce. My only query is wont gold collapse also in a delationary environment?
Thanks. It’s not an easy call due to the limited history of deflation and free-floating gold. But my research shows gold operating as the anti-demographic and with global demographic trends united down, I see gold as having made a cyclical bear 2011-2014 within an ongoing secular bull since 2000, with a new cyclical bull now ripe to kick off.
From Mark Hulbert today:
The divergence began late last November, when the Dow Transports rose to a record high. They are now 6.7% below their all-time closing high (and 7.6% below the intra-day high). Over the same period, the Dow Industrials have risen more than 2%.
You’d think that wide a divergence would grab investors’ attention, but you’d be wrong. Sentiment surveys, including those from the Hulbert Financial Digest, are showing high levels of bullishness.
How bearish is this divergence? To come up with an answer, Jack Schannep recently focused on periods over the past 25 years that included big divergences. Schannep is the editor of a market-timing advisory service called TheDowTheory.com.
Schannep found 14 such instances. In nine of them, he says, the broad market subsequently dropped by less than 10%. But in the remaining five cases, the stock market’s eventual decline averaged 25.7%.
Those are sobering odds. If we average all 14 instances of prior divergences similar to the current one, the market eventually fell more than the 10% threshold for a correction. If that turns out to be the case this time around, it would be the first correction since 2011.
Even more ominous is that in five of the 14 cases, or more than a third of the total, the divergences presaged a full-scale bear market. In fact, Schannep points out that when the broad market hit its bull-market highs in 1990, 1998, 2000 and 2007, the Dow Transports in each case had already turned down several months before.
Schannep hastens to add that “the market doesn’t always drop significantly after a divergence.” But if the future is like the past 25 years, we should be prepared for at least an imminent correction, if not something even worse.
Good info Gary, thanks for sharing
Thanks very much John H. A few more weeks is well worth waiting for….IF it comes to that.
I think your initial estimate of ‘days’ is the more likely.
The ‘only’ caveat here is no further introduction of QE as the Alhambra site seems to be suggesting.
Thanks Purvez. The Fed must surely backtrack away from any rate rise soon based on the data. But it seems to me they would lose all credibility if they go the full way to QE5 so soon. But, these are desperate times.
I wish you luck with your trades John, and I agree with your analysis, the markets have been on borrowed time for many months.
Re QE5 purvez, I think we will see it, but the global economy will continue to crumble anyway, and finally the market will realise that QE doesn’t help the broad economy at all. But QE5 could produce a 2nd chance rally, or even that brief manic phase transition that Martin Armstrong suggests is possible.
Either way, the game is very nearly up…..by the end of this year, the landscape will be so different.
Re gold, maybe a quick sell off in a liquidity squeeze, but otherwise it’s likely to rise during troubled times, especially if the CBs persist with QE in the face of contraction.
Keeping it short and simple, I am taking profits on longs and going short.
That’s a CIT for you Richard. 🙂 !!
thanks john. have you shifted from short russell to short dow? i though the russell was your short target?
I’m still targeting the Russell, just not entered yet
Dow top today/Monday, as per my post from 25th January 2015.
http://www.17yearstockmarketcycle.com/2015/01/djia-march-2015-cycle-high.html
Declination at 0 yesterday and New Moon on Monday fit as well.
GLA,
Kerry
Thanks Kerry I remember and thank you John yet again!
replying to Purvez – The larger trend (Singularity to Expansion – low to high) is the simplest trend to trade – 5/11 L, 5/25 H and 6/6 low. The low I am expecting is delayed to the furthest extent of the time window to where the Spiral leaves Quadrant 1 – 5/18 at 14:00 est.
Thanks for replying Peggy. Not sure I fully understand, as I thought the Spiral was targeting a low on May 14/15. However are you now saying that that has been delayed to the 18th?
I guess like all things new, I need to spend some time understanding the basics and terminology for myself.
It’s not delayed – the time window for the low extends into Monday. I thought that both yesterday and today would be down days based on the smaller trend. The larger trend has pushed the expected low into the end of the time window.
So, just to understand…..Are the smaller and larger trends always in opposition? Or due to the nature of the Spiral there are times when they both point in the same direction, because if that’s the case then that would become the ‘no brainer’ trade.
I’m sorry I keep asking questions, but looking at the 7442 Analytics FB public page one gets the feeling that this is meant to be an ‘EXACT’ science and that’s what makes me sceptical about it, I guess. Perhaps I’m reading it wrong, which is more than the likely reason.
However thanks very much for continuing to answer my questions.
It is exact. My interpretation wasn’t perfect. Skepticism is ok but if you are really interested it will take time to figure it out. and no matter how good the system is, it depends on the skill of the trader. The Spiral gives you the window but entering the trade depends on your trading trigger. I waited for the 30 min impulse top (today). Yes the 2 trends are in sync at times.
Thx for this info, Peggy.
replying to Kurt – yes Elliot wave is seen in the Spiral price path. 2141 is the target for the current up wave.
Hi Peggy – Thanks for replying.
So the Friday SPX high target is 2141 and then a drop with a low expected around 14:00 on Monday (5/18). Is this correct?
no, the high for Expansion 5/25. targets for the Monday low (or today) 2104, 2099, 2094
impressive strength in gold
knocked down to 1210 this morning at 6am
now 1220
Seems like gold is trying to defend its place above its 200 DMA. Funny it is such a touchy subject, while some are called gold bugs, some are adamant that it will even see 800 this year and that they will buy then and successively pick the bottom.
Personally, I think gold’s strength in the past 2 months is indisputable.
Im going to stick with my dow long for the moment due to dollar strength. I do expect the euro to resume its weakness and trade below 1.10 vs dollar after a top is formed in the next week or so upon which the short dow trade will make more sense to me. The DAX is a traders dream at the moment if you can call it right.
Alan;
RE: your question about stops, targets….
No stops, the system takes care of that by reversing… It’s primarily a trending system, so it doesn’t stay wrong for tooooooo terribly long, but that said, it’s pretty much been whip-sawing all of 2015….
And no targets in mind…. Trades give you what they give you, good or bad…
All that said, it reversed to a 50% buy last night, so the system would dictate covering all shorts today, and going 50% Long by COB today….
It’s primarily being led by the HY components of the system right now, and we’ve just been going back and forth there, and as mentioned, causing (small losses) whipsawing….
And ~that~ said, personally, I am maintaining all my shorts at this time…
I see enough from the charting I do to believe that a drop will be occurring very, very soon, and also believe that my system will be back to the short side on the start of any drop…
So I’m thinking I’m just saving myself another whipsaw, but fair to say, sometimes I out-trade my own system, and sometimes I under-trade it….
So, clearly I have mixed signals, but my bias and current outlook is to be bearish….
Very, very bearish….
IMO and with my bear colored glasses, a signficant 4-6% selloff in SPY is imminent. VXV/VIN is 1.28 or John’s version at .80 history tells us this is a very dangerous time to chase ATHs.
I would love to see the FAKE PRINT of 212.97 tagged today as it is within a whisper of the 1.618 extension of the 2007 top. Instead of a 4% correction we could see something much more sinister.
Given the exceptionally low SPY volume not confirming ATHS and the HUGE volume of monthly puts purchased and now worthless that will expire today, I would not be surprised to see Monday bring in a 50+ point SPY sell off. The house market makers keep all the premium and still make money on the way down.
I will say I was disappointed to see the abrupt reversal of the Spiral forecast of 2047 to 2141, but I look at it this way, despite the high probability setup seen by Spiral to tag 2047 yesterday or today and now reversal to the 1.618 target area described above, I see it like this…
You are playing Texas Holdem and have your opponent dominated until the river completes his full boat w/ a 11.5.% probability of success. As long as you didn’t go all in, you still have a chip and a chair
Scott, love your Poker analogy. Don’t understand the game but got the sentiment!! 🙂
Adding 2111 as the first price target. Low either today or Monday. Use your own technical signals to enter/exit.
theta destruction at its finest by the house market manipulators. 50% of the trading day done and SPY has traded 35% of average daily volume on options expiration day.
without a black swan event, I anticipate very low trading and range bound until the last 60 minutes, then a Pin around 210.50-75 to maximize the carnage and gross profit for the MMs.
I found the chart of the 17.6 year market cycle very interesting to re-look at. My guess is 150 days ago it was telegraphed as to SPY spike to 212.97 on 12/18/14 for the target where the rats will have left the ship on 5/18/15.
Middle Power 53/100 and Siderograph power 31/100 on May 24-25th clustered two weeks after 100/100 declination power and 31/100 siderograph power on May 10th. last bradley clusters like this occurred Mid Oct – Dec 2014.
Scott,
Wow bold call. You think they tank it by the close?
I wouldn’t gamble, because that is what it would be, on it, but I don’t see the market makers paying out all the 210,211 calls purchased. Frankly, I still would like to see it hit 212.97 today or even 213.80 so we can hit the 1.618 extension at 2138 and get this over with. I did pick up 20 more of the 5/29 210 puts
65% of the trading day over and SPY is at 40.5% of daily trading volume. not a vote of confidence of ATHs. John Hampton has provided a very strong thesis over the last several months and great analysis. Today, issued a call to action for himself with the title “On the attack”. I agree the timing is imminent. It may take into this summer or fall, but right now my chips on the table are for a 3-4% pull back from 212. that gets us to 205.64 or lower
end game as I and many others see it if we hit the 1.618 extension of 2138 also forecast by the Spiral mentioned earlier today by Peggy by 5/25
http://www.thepatternsite.com/EWDiagTriangle.html
The ending diagonal triangle, or wedge as many call it, is a narrowing price move composed of two converging trendlines highlighting a wave 5 (many times) extension pattern. The chart to the right shows the ideal example. The ending diagonal is a special type of motive wave that occurs primarily in the wave 5 position when price has moved too far and too fast. I like to think of it as a rising or falling consolidation. Some ending diagonal triangles appear in the C wave of an ABC correction, but that configuration is rare. In all cases, the ending diagonal terminates the move of larger patterns. Diagonal triangles substitute for impulse waves.
here’s an interesting tweet I just saw, 15 times in the last 15 years, SPY has gapped up to hit ATHs only to slide back on low volume (non confirmation).
at 1:30 today CST, we have 77% of the trading day gone and 43% of the average daily volume. SPY at 212.16 down .46 cents from intraday high of 212.61
Of those 15 occurrences, the following week saw a gain 1/15 times (@+1%) 12.29.09-1.06.10
5/15 times the SPY lost at least 2% with 1 @-6.08% and another @-4.36%
https://twitter.com/search?f=realtime&q=%24SPY&src=tyah
Vix is up 1.64%, 30year up 1.76%
Equities flat…..yep looks like Risk – On to me.
56% of daily volume. 60mm on close w/ closing marginal high met. “Mission Accomplished”. 212.45. after hours volume has been running at 15-20% of daily volume. Even if the high end is met. ATHs on 56-70% avg volume. woot woot whimper thud
Scott,
Could you list those charts that show the volatility ratio? Thanks.
they are easy to do in trading view. otherwise you can see the historical ones w/ SPY comparisons by looking through his postings.
Today Closing: 5.15.15
VXV: 15.64
VIX 12.38
VIN 12.10
VXV / VIX closing 1.263
VXV / VIN closing 1.293
VIX / VXV closing .792 (John’s preferred way to show the chart)
https://www.tradingview.com/chart/?symbol=VIX%2FVXV
Thanks you.
Spiral expects a low Monday morning – time/price target = 10:00 est at 2109
Thx very much Peggy.
Hi Peggy – your twitter post mentioned not much more room at the top, is the Spiral expecting a low for Monday morning to be followed by strength into the close?
Not much more room at the top is referring to the 2132 – 2141 area where the next pullback is expected. The Spiral expects the greatest trend in the Retrograde phase which is approximately 2:20 to 11:30 est. These retrograde phases are:
5/18 down, 5/19-21 up and 5/22 down. I posted last week that I expected today’s low to be 2111 or 2109.
Lunar Chord, next week:
Week seasonals all week, combined with falling tides all week, so will be looking to find short opp’s next week and will not hold long positions overnite.
Valley, isn’t a New Moon supposed to coincide with an Up tick?
NM is often the top, and also often has a few days of rising prices following. Given recent up moves, I bet it will be the top this month.
This time, declination is bearish past equator (Thursdays nice equatorial up gap) and will stay bearish thru next weekend.
Mercury inferior conjunction on 30th acts as a reliable attractor to price on the down side as well. And 23rd Saturn opposition often is the top for the semi annual cycle.
Humbled by recent lunar chord failures, so grain of salt.
Monday low, but consolidating until Thursday. Thursday very strong day up. June 2nd likely major high. Is Mercury retrograde midpoint and 245 days after September 30th 2014 start of decline. 245 days is 2/3rd of year (is trine in solar degrees). Mercury at aphelion and full moon (with moon at aphelion june 3rd = synchronization). June 1st venus within bounds again. June 6 Venus max east = start new Venus max cycle. june 7th Mars out of bounds. June 4th Sun conjunct Uranus.
Early June has all the marks of a significant turn.
Cheers,
André
Actually, the whole period between FM at aphelion and NM at Perihelion is a synchronization period. June 13th we have Mars conjunct the Sun. And June 19th option expiration and June 10th Mercury turning direct again.
So either June 2nd or June 16th will give the high. With mars going out of bounds volatility should finally start going up. Gold up would be a diversion.
So first half of June should be volatile until we finally start the down wave into late September/early October.
Make that : June 16th will be the high for 2015.
Good to see you back!! Nicola2910
Fascinating, Andre, thank you.
the DJT has been impacted by the rebound in the OP,
however there is also a macro element at work.
It is overstating the case (at this point) to claim it’s
a clear indicator of a bull market final top.
If this is merely a marginal new high on the SPX
then that will become clear very quickly.
US longer term rates falling quickly
again following the brief spike, US macro is not
strong enough to propel longer term rates to levels
which would see equities sell off aggressively imv.
The US business cycle does not require a spike in
rates to roll over, so many are anticipating something
that is unlikely to happen.
Earnings and dividends are key and these remain the
metrics to watch as to when the bull market finally rolls over.
Prechter sees all of the current waves in DJIA, DJT & Dow Composite as 4th waves and hence we should expect a 5th wave higher.
A bullish (at the end) Prechter. Go figure.
Prechter charms snakes, but Caldaro seldom far from pragmatic sees top of Primary 3 everywhere approaching.
A reset is a reset, follow what happens when it happens.
Some charts there by someone trying hard, maybe too hard…
http://stockcharts.com/public/1577160/tenpp/2
Thanks, Peter, for sharing these charts. Very interesting.
Peter,
You don’t seem to be able to write let alone read English.
From the TC site.
As a result the Primary wave III target remains on track for SPX 2500+ by the first half of 2016. Even though it may be hard to believe the market can advance 20% in the next year, after having gained only 5% in the past eight months.
Hail winkysowatsit
Emerging from the no count zone, always another possible take on the table. But the expectation of about 100 pips correction on SPX is there with AC short term albeit with the one for a neater completion of the e-wave prior. The long term bear case for the ABC completion was never with AC and has been well nullified by related silence elsewhere. The small-if-any short term correction expectation holds good for next week atm
Ive read the prechter report dated 5.1.15 and fridays short term update. To hit a 5th wave ending diagonal, slight new highs are all that are needed for termination, so anwhere from 18290~18388, similarly for the s and p which ties to the 2138 eextension. The nasdaq already hit fifthe wave and in countertrend rally. Same as russell
A cynic may say that is a top indicator if there
ever was one purvez!.
Risks to me look to the upside short term,
that may become clear by monday so not
long to wait.
I appreciate some are looking for a sell off
next week reading recent posts.
Monday even, with a capital M.
I have a bit of a mixed bag in terms of position atm – more short than long on the whole , but I also bought some SPX July puts yesterday. I think early week could be down, but not expecting a huge sell off as there is no price action to indicate this at the moment imo.
Good luck all, I will be away on vacation for 3-4 weeks but will be active regardless.
J
Have a good holiday J.
I found a new analysis on the apo-peri table. This analysis shows an 11.8 year cycle. And that is exactly the orbital period of Jupiter.
This analysis clearly shows a major cit in June 2015. It will bring us to a low November 2016. After that up again into November 2018. This should end this long term cycle. And it would make sense that a brand new start in 2020 would be preceded by a major crash like the 2007-2009 event.
Seems like we will soon start w4 down with w5 starting by the end of 2016.
If this has any value it would confirm my belief that central bankers can’t control the market; they simply do what is required.
Still a bit experimental, but I wanted to share it – just for fun.
Cheers,
André
…experimental?…..for fun??….some of us here trade with real money Mr. Andre paper trader !
You have been wrong…repeat Wrong so far !!
Wow, Bruce. Judging from your ‘attitude’ you must have had a very ‘wrong’ week, last week.
All public charts…
http://stockcharts.com/public?category=all&sort=rank&asc=true
Trading the long term 7442 Spiral, trading the intraday 7442 Spiral and “not much room at the top” https://twitter.com/mjmateer
I don’t know where Newt’s disappeared to but one of the things I learnt from him was to look beyond EW to the underlying fundamentals. One of which is the NYAD.
The following is the ‘house chart’ for this indicator by StockCharts.com.
http://stockcharts.com/freecharts/gallery.html?$NYAD
Look at the top right hand corner. A clear 5 wave down move and a 3 wave up move (so far). It doesn’t get more ‘text book’ than that from an EW perspective.
So now I’ve got a double whammy because I’m looking at an EW perspective of an underlying fundamental indicator.
Ha!! ‘I love it when a plan comes together’ (A-Team)
P.S. Newt, come back please. Surely you can’t still be sipping wine in Nappa?
I will share this because tne guy has certainly done his research.
http://trader-moe.com/es-bullish-vs-bearish-case-with-set-ups/
In the last 4 trading sessions silver has now broken its 200dma and today its 50 wma and momentume is building……and surprise surprise Martin Armstrong may just be turning evermore bullish on gold?
Allan, fwiw, I read where after years of being bearish silver noted trader Peter L. Brandt has recently turned bullish.
Yeah…Trader Moe is a pretty good blog.
Good quality updates and commentary.
It’s just amazing how much work it is to be bearish right now, and stay bearish. He really worked hard for his conclusions.
Allan, what’s your view on the weakness in miners even as gold and silver have recaptured their 200Dma? I find it a bit concerning for the overall health of the precious metals and related sectors. UNless miners show some strength, one has to be a bit cautious.
I have no issues with seeing some weakness here in miners. Many have made substantial gains off their late 2014 lows.
Canadian and Aussie gold miners have done extremely well. US miners are lagging for obvious reasons but their time is coming as well.
I am completely at ease with my positions here and will add on any weakness.
Concerning the El Nino, Drought is being reported in Australia, Philippines, and Viet Nam.
A drying trend is also in play in western European and Russian grain areas.
Seems somewhat appropriate that a Carl Icahn Tweet and open letter to Cook create the Apple Pop to take out the fake print high of 212.97 on 12/18/14 on 5.18.15 that also coincides with Kerry 17.6 year cycle top date of today.
Market internals and economic news continue to be at 2008-2009 recessionary levels.
Spiral is 0 for its last 2 on short term market calls as today was supposed to be a down day. It will be interesting to see if we get the next 3 up days 19-21st as predicted to take out the 1.618 extension of 2138
Bradley turn dates coming up 5.24 and 5.25
Scott – maybe you didn’t read all my posts – I said that Retrograde was down today (general direction from approximately 2:20 to 11:30 est and that the price target was 2111 or 2109.
and, as I’ve already posted, the larger trend is up to 4/25, the intraday retrograde trend is up 5/19 -21 and the first price target is 2132.
5/25 not 4/25
Good call Peggy.. 2132 first price target reached ahead of time.
Interesting moment of truth for the markets…
Today’s new highs in the Dow and SPY satisfy Prechter’s 5th wave ending Diagonal.
2138 SPY is 8 points away to hit the 1.618 extension for the 2007 Market top.
5.18.15 marks Kerry’s 17.6 year market cycle top projection
Both greenspan and Yellen had participated in federal jawboning to say markets are frothy
no better time to buy a market breakout to aths
but do I admit defeat and cancel my shorts!
Closed Dow longs and gone short with small position. Euro should begin to strengthen now as it retraces back. Remain long dax as that will benefit euro weakness.
Well its rare my trades work out this well but looks like I got the general idea of weakening euro correct. My dow trade obviously is in loss but more than made up for by the DAX gains. I expect the euro weakness to continue especially if there is some form of Greek deal (it will definitely be a temporary one as a greek default at some stage is certain). As i expected the dax 10% correction was more of a panic move rather than anything significant longer term. Oil will struggle to gain as the dollar strengthens and I’m looking for a 10% decline there too. No position as of yet on oil.
At this stage I have to google “how low can the vix go”.. I think the answer is 9.31 on Dec. 22, 1993
IBB within 3% of its all time high.
DJI and SPX close at records.
Short term risk looks to the upside imv.
Today
5/18/2015 : 5+1+8+2+0+1+5 = 22 Master Number (17.6 year cycle top)
SP500 HOD 2131.78 : 2+1+3+1+7+8 = 22
NASDAQ HOD 5084.50 : 5+0+8+4+5+0 = 22
DOW HOD 18325.54 : 1+8+3+2+5+5+4 = 28 Number of Wealth #GG33
Hidden in plain site and 2 Fed Chairs have issued warnings to avoid Karma boomerang. that is my story and I’m sticking to it.
Dow close 5/18/2015
18298.88 = 1+8+2+9+8+8+8 = 44 = 2 x 22
Also the 29 is surrounded by 9 +24 = 33
Nasdaq Close 5078.44
5+0+7+8+4+4 = 28 number of wealth #GG33
i guess i forgot to mention the Russell 2000.
5/18/2015 closing price…. 1257.52
1+2+5+7+5+2 = 22
Wow….no the markets aren’t rigged
I am not sure I understand?
Hi Bluestar ….just some Numerology observations. Given there are those may be interested in astrology, fibonacci, in addition to Solarcycles on this blog, I thought I would share some additional Co – Incidences that occurred on Kerry’s 5/18/2015 17.6 year cycle top call.
Thanks,
so you still think the market may have topped today and now we go lower?
…I thought the market may have topped before but 2138 and 212.97 have been a magnet to melt up higher on no volume. so don’t go by my opinion. trust yourself and be willing to lose what you risk
food for thought courtesy of Yacine
https://www.tradingview.com/chart/SPX500/Wup6iwdJ-SP500-2-extreme-paths-leading-to-2165/
7 month cycles published 1 month ago
https://www.tradingview.com/chart/SPX500/0IhhRIs8-SP500-KEY-7Months-Cycles/
next Spiral target 2141.
Peggy – is this the expected high for the week?
Kurt
yes
Fascinating numerology Scott. However, I don’t believe the market is top today. Charts are uber bullish still, especially the IWM. In addition, SOS didn’t exist today. I think SPX may potentially top out in the range of 2140-2165, maybe before the Memorial Weekend.
The Bradley turn date 05/24 indicates a wave down imho, which would fall exactly 8 months after the Shemitah year on 09/25/14.
I continued staying long, but ready to be back short by the end of this week.
Best of luck!
I think late last week was telling folks.
Another new high on the SPX which was not
decisively reversed on Friday, coupled
with longer term rates beginning to drift back.
Risks looked to the upside following that imv
as mentioned.
All that matters to me is valuations. And this market is overvalued to extreme despite claims by many high profile analysts to the contrary.
NFLX is the epitome of this market overvaluation. Expectations in NFLX earnings growth are about as extreme as they can get.
With a current PE of over 160 they have to see explosive growth in tne years ahead just to meet current valuation and this in a sector that WILL see increasing competition and I suspect squeezed margins as a consequence. I doubt it is even worth 30% of its current SP.
We will look back upon this period and NFLX will be the poster child of the current bubble.
We are approx 5 weeks away from where
I thought the final bull market top would be formed.
It’s a 3 month window taking us in to September,
which is a generous time frame, however I
referenced this well over a year ago.
It depends now largely on macro and where the
business cycle appears to be heading.
If we get a correction within that time frame rather
than a final bull market top, then the call has been
invalidated, although a decent sized correction would
make it look a little better.
If nothing happens and markets stay around current
levels, or move higher, then it’s an awful call and just
joins an already very long line of others.
It was an estimate based largely on when I expected
the US business cycle to roll over, however like
anyone else’s attempt it’s merely a guess.
After this guess there will be no others,
I allowed myself one only.
Looking very timely!
So the window begins July 1st? How did you estimate the business cycle?
Would absolutely love to see a pullback in silver here to test the 50 dma and the for it to promptly reverse and retake the 200 dma/50 wma. That would be ASTOUNDINGLY bullish.
Allan, i really admire your conviction, I feel like breaking my screen as I see how miners are so weak as gold is rally and then gold drops less than 1.5% and then miners get hammered. The great US of A and their invincible wins again. Maybe because my whole watchlist is full of commodities and their related stocks, it’s shocking to see a sea of red/
DP, I am really perplexed by your comments and concern?
From the March lows GDX rallied 25% and the HUI rallied nearly 21% whilst in the same period gold and silver to yesterday’s close rallied 7.8% and 16.4% respectively.
What are you expecting at such an early stage?
Keep in mund that Canadian and Aussie gold stocks in many cases are up well over 100% since late 2014!
As far as I am concerned from a technical stand point it is great to see the market do the hard yards required early on to establish a sound footing by retesting moving averages and filling early gaps etc.
http://stockcharts.com/h-sc/ui?s=GDX&p=D&b=5&g=0&id=p84667788769
Look at the volume on up days compared to down days since the March low 😉
UP goes the frigging US dollars again and down with almost everything else, looks like a lot of commodities are going to zero if the US keeps on it’s path of destruction on “revised” data and “positive” data.
John, latter half of June, July.
The cycle peak usually lasts around 12 months
and I thought we would begin that period approx
last Summer.
The uber bulls consider this mid cycle still,
that looks unlikely to me, but this bull market has already
made countless look very stupid indeed,
and I may add to that number.
Phil, thank you for your reply. Regarding the economic cycle peak, what do you look at? Is it just GDP, or do you look at employment or other figures?
Something doesn’t add up; US home starts surge yet Copper sells off hard.
When in doubt GET OUT. I am no longer long any stocks.
Phil. Your timing makes the most sense compared to the rest of this board. And I recall you have been calling this since last year while most of this board was extremely bearish and dead wrong.
Not sure what tools you are basing your forecast on, but it rhymes with my cycle count. Agreed that we are heading towards the end of the top out process, where valuations don’t mean a thing. June top makes sense from a cycle perspective as well. The current cycle is stretching to its extreme, so it is more likely that the sell-off will start in the second half of June, resetting sentiment, and is a prelude for a devastating 20%-30% September/October corrections.
I believe that you will be the last one standing with the crash call in September/October. Time will tell.
Currency, Markets and trading are a function of liquidity and faith on the part of the buyer and seller. The market being supported by Corporate buybacks, ECB, Central Bankers, Swiss bank and the low volume march up will only end ugly. the question is when do they collectively pull the rug out from under you.
Look across commodity futures at finviz.com and you get an idea what the global markets will look like for an extended period when the glass floor of support is broken away
http://finviz.com/futures.ashx
18 out of 48 markets in a sea of red today w/ losses of 1.5-3.8%
ECB puts a report that they are now front loading asset purchases to goose up and support the market….when the dominoes fall and no one has any faith in government, central bankers, and markets, we will see unimaginable chaos.
Check your kit
Scott, you are preaching to the converted (mostly) here. The BIG question that we are all trying to work out is WHEN do the dominoes fall?
I keep thinking up scenarios….increasingly absurd ones I admit, which will cause the loss of faith in govt.
Putting aside my daft conspiracy theories as well as all CBs being possessed by aliens (the latter not so daft…LOL) I’m left with a ‘collective awakening’ by the populace…..which in the ultimate analysis is the daftest of the lot.
Does anyone sense some frustration here?
You captured my sentiment and caught me in a vent…my bad!
Evening purvez.
This will all end due to Mother Nature and her immutable laws, notably that of mathematics. Also, mankind’s herd instincts will ensure that once the maths doesn’t add up, the markets will turn the other way.
For now, everyone (other than the few like us) believes it can go on forever, or even into September.
I once again suggest that if you don’t own physical wealth, in non-banking system vaults or your own possession, in the next few years whatever profits you think you have made trading may prove entirely….illusory.
It’s all fucking debt, unless it’s a real physical thing.
Geez purvez you must know that only higher and higher interest rate expectations can unnerve the financial markets. Root cause analysis always better than shotgun at all possible symptoms and related myriad of theoretical outcomes.
Plus if/whenever such unnerving commences there will be a global CB reaction to calm the beast, quite unlike any other time in history. You think they have not learned a few things in the past several years?
Commodities and Currencies other than the US Dollar look fairly unnerved 20 out 48 markets down 1.5-3.8% today….
Dax Melting Up, Nikei up 1%….US equities sitting on the sideline at 50% average daily volume.
http://finviz.com/futures.ashx
Scott sorry. That was not a pop at you. Just showing my own frustration.
Peter_ ah yes been through the higher interest rates loop. However since the market no longer sets them and the CBs/Governments aren’t going to do it I discarded that one. Hence the more ‘tangential’ approach. Lol.
GM is there a way of hurrying up Mum Nature. She sure is lagging here.
Here’s a sliver lining for today…SPY 57mm shares during the session, just over 50% normal daily volume and it didn’t melt up to ATHs.
here’s the negative, it still hasn’t reached the 1.618 extension of 2138 to trigger the throw over ending diagonal 5th wave and satisfy the current Spiral target
The ES reached the cash equivalent in the wee hours last night. Does that count?
Yes… I agree. Can’t short ES at these levels either. The melt up is just too crazy.
I think ES could get into the 2140ish zone before there is some resemblance of a retrace back to 2115 – 2120 zone. Even then…this is just a estimate and may prove to be wrong. Like Purvez…I think mother nature is taking her time though I’m sure she gets there.
Adjusting price target to 2138 – 2141 by 5/21
John, I looked at profits as a % of GDP,
corporate margins and length of cycles
since WW11.
However it is ultimately based
on probabilities at best, no certainties
exist on precise timing as hopefully we
are all aware.
Thanks.
I follow this research for a while…I am sure you heard of it, but just in case…
http://www.crestmontresearch.com/economy/
Hi all ! Good news from the ECB this morning, they will increase their asset buying shortly. The central bank of China also cut interest rates a few days ago. So, everything is under control and going smoothly.
Central banks are doing a fantastic job to drive the markets higher and I applaud them.
So, no change in the strategy.
Nicolas, once again you must be called out…. No change in strategy? here was your advice 5 trading days ago… Nice call on Commodities, and your Amazon call at $448? top notch. you are on a roll. I applaud you
Nicolas
May 13, 2015
Hi all ! Looks like Allan is right about Gold. As I said before, I think the big theme for the rest of the year will be commodities, and that includes Gold. So, I think commodities will outperform going forward.
However, I still don’t see any hope for the bears. The stock market is still very well supported by central banks.
regards
Reply
Sell in May and go away….
The “top” to be this Fall and then the crash…..
The big wedge from last October has magnetic qualities:
http://screencast.com/t/fLZJIhyW3Y
Good to see that Peter_ and Nic are aligned in their faith in central banks.
There’s a sign of herding if ever I saw one.
Any expectations of more than 100 pips correction seen on SPX before more than that above latest ath? Who will give some meaning to their belief system?
There are enough 5 waves in place to call a top in both oil and gold. Both might whipsaw a little bit, but my gut feeling is that commodities have topped. If so, gold may potentially head down to its 8 year cycle low. There is strong conviction on this board that gold already hit a major cycle low last November. However, I don’t see enough evidence from the EW perspective. I continue to believe that the 8 year cycle low is due, either now or over the summer.
If the markets do sell off imminently, it is more likely that all commodities will go down with the SM.
I’m still waiting for 10 yr USTS priced in silver to hit a certain level before the bottom is in for gold erick. There’s a chart here:
http://screwtapefiles.blogspot.co.uk/2015/05/sunday-pm-pre-game-5172015.html
Thanks GM. So we would agree that the gold bottom has not been in yet? I don’t think the move up in gold last week has the characters of a bull market move. Instead, miners are acting like a corrective move within the bear market. USD is storming out of the intermediate cycle low. The only hope for gold is a dovish announcement by the Fed tomorrow.
Not yet, I agree.
I’m not expecting any dramatic plunge either, although liquidity crises might mean a gold sell-off to raise cash. It’ll be short-lived if it happens, with eager long-term buyers buying the dip aggressively. 😉
I expect the USD to make a new trend high which it now looks like it is on its way to doing. Most Commodities will decline except those that have a “weather vane” such as those that are effected by the El Nino.
I am expecting Gold and Silver to make new trend lows and continue down until this Fall.
yep, looks good for at least a longterm intermediate top made today on Merc station for SPX, and Moon max North declination early tomorrow am. Sun conjunct natal ascendant for SPX index two days ago. 2109 first target. this call invalidates at 2135.83. That’s a basement window trade for you…(upside down basement window)
Looks like consensus here on the resources collapse, but once again the consensus here has got it all wrong. Get a grip – get a more balanced and objective approach…
https://caldaro.wordpress.com/2015/05/19/europe-plus-commodity-group-update-2015/
Global growth is unlikely to be supportive of commodity
prices, coupled with supply the last 12 months strongly
indicate insipid macro is a big headway.
Crude can make headway on geopolitical concerns
as ISIL has the potential to transform the Middle East
in to a war zone, hopefully this worse case scenario
will not unfold.
The UK is now in deflation for the first time in over 60 years.
The US business cycle will not roll over because of rising
longer term rates imv, it will end with continuing low rates and
weakening end demand.
Phil, I agree. Commodities will sink from here. Like I said last week avoid the big commodity producers like BHP,RIO and VALE.
Gold is NOT a commodity, it is a currency.
Look at the CRB index, it’s already down at nearly the same levels as during the worst of the credit crunch, so the plunge has already occurred. A big red flag for investors (to ignore).
I agree, more to come, except in gold. The anti-currency!
In the White world of collapsed resources not only bountiful cheap oil but also negative population growth and optimized recycling, scant building and less maintenance.
Of course people will also suffer mega unemployment and mass starvation, but that is just a side effect. Recycling the trash will be by hand for survival.
Notwithstanding that world population is conservatively estimated to increase by over 2.2 billion in the next 35 years. http://www.geohive.com/
No homework, no references – just pedantic hoohah as usual
http://news.yahoo.com/video/abc-news-plus-special-report-220000361.html
Really? Just for show. NOthing will really be done to stop manipulation
http://finance.yahoo.com/news/banks-fined-2-5-billion-140901678.html
DP we are no longer in a democracy. It’s now an Oligarchic Kleptocracy.
Read up on the French Revolution and start building guillotines. There probably are detailed design plans on the web. May even have an electronic one & possibly a remote one too. Haha
Allan, just for clarification I was not referring to Gold
as you may be aware.
RIO I like longer term as it happens,
ultimately their strategy to take out the higher cost
iron ore producers will pay off handsomely imv.
It’s on a longer term watch list and I have traded it
a couple of times over the past few months.
Richard, I mentioned the Euro looked in
a shorter term counter trend move,
which the renewed weakness suggests is the case.
The $ run was due a temporary pause to work
off some of the dramatically bullish sentiment.
Euro area macro is just not strong enough to sustain a
longer period of Euro strength.
The US remains the best of a bad bunch and the $ may
still be in the early stages of a multi year run as previously
posted.
Goldmans have come out and stated that the trillion or so dollars US companies are looking to give out in dividends this year are approximately equivalent to total earnings for 2015…..wow?
J
J, apart from Price/Earnings the ‘other’ metric that people look at is yield. This is where GM’s Mum Nature Maths come into play. If you increase Price through buy backs then you are stuck with increasing divs to provide the same or better yield.
Mum Nature is quite amazing!!
Hope you are enjoying your hols. It’s been hailing in Watford….so good timing.
This Mum Nature thing reminds me of a joke I heard a while back: (with sincere apologies to anyone religious and may take offence…I’d happily substitute equivalent names from my religion but most wouldn’t then get the joke. Also apologies to John H for using his site for nefarious purposes)
St Peter and God had discussed the world and it’s creation a number of times. God had explained that he had created balance in the world. Black vs white, Poor vs rich etc.
Then God disappeared for some time and was nowhere to be found. When he reappeared he called St P over and said look at this country that I’ve created. It’s got amazing natural beauty, and mineral wealth and it’s people will be clever and learned and will spread throughout the world. They will be known for their intellect and compassion and knowledge. St P was amazed as he gazed down on this country.
Then he slowly said, ‘but God, where is the balance? You said there should be balance’.
And God replied…..’Wait till you see the clowns I’ve lined up to rule this country”.
=======
This was a joke about my birth country and everyone there, that I told it to, could identify with it.
I suspect that right now it is probably the same for EVERY country in the world.
Any bubble, financial or in the real world, has to burst because of mathematical limits.
When this one bursts, all that many CBs will be able to do will be to soak up the bad debts via currency expansion, but, you know, that has mathematical limits too, as we will see eventually (Zimbabwe, Weimar, and dozens of other examples in recent times, hundreds throughout history).
It’s going to be grim, so grim.
purvez, what if the real power to run a country (i.e. its money) was removed from said country, and given instead to a higher supranational authority that had one goal, price stability?
I see that as a giant leap forward for mankind, and it’s game on in that endeavour in the EZ. Next step….as governments are unable to magic up money from thin air, they will be unable to rescue insolvent banks, and said banks will feel the heat of Mother’s Nature son, Master Market, as they vanish forever.
It’s going to be great, great.
GM this supra national body has to be a benign authority. Therein lies the problem.
Human greed leading to corrupt supra national authorities is as bad as individual governments.
I understand the logic of such a system but that requires a Vulcanesque society. Logical and without emotion.
Hard to come by on Mum Earth.
I hear ya purvez.
Just defining ‘benign’ could cause many a debate between free-marketeers and those of a socialist bent.
The pendulum has a bit further to swing (left), before swinging back the other way for a couple of hundred years. Maybe. I hope. Will it ever stop in the middle?
All hale the great Fed. This is without doubt on virtually all levels, THE most puerile market I have ever had the misfortune to witness. Thank God I am doing it mostly from the sidelines.
Be fun when it unwinds though Allan.
If 3 days of ath’s cannot trigger some downside then it must be because only the expectation of higher and higher interest rates can unnerve the financial markets.
How about some numbers… http://www.worldometers.info/
Decision time today again.
The market is no doubt at a crossroads between the continued bullish case, and the potential diagonal.
1. Bullish Case: SPX takes down the 2135 level, with the potential to spike to resistance 2142. If so, there will be a more bullish structure, and potentially move all the way to the 2150 region.
I think it is less likely that this bullish case will be playing out. The bull is exhausted, tired, and ready to come down. If tomorrow the SPX falls back below 2125, the bullish case would be even weaker. That would leave us with the potential diagonal.
2. Diagonal scenario: SPX is likely topping in the (a) wave today or tomorrow, then the (b) wave will take it down to the 2085-2100 region. A break down below the 2080 level would be an indication of the top in place, and the larger degree wave 4 in place. I would target 1800 as the worst in the worst case scenario before the market starts retracing.
As long as the porridge is not too hot and not too cold and not too many people show up for the exits, the march up continues. look at the SPY volume during this “break out” fakeout over 212. last 5 days average is less than 80mm with the last 3 days around 70mm including after hours. any notable fear and the market is back in the penalty box and testing 2040.
here is an interesting chart playing out from a few days ago from someone I follow on twitter. incorporates mercury retrograde, jupiter trine neptune and the upcoming bradley turn date. and a few extras entertaining pieces of analysis
Also includes JM Hurst cycle theory (personally not familiar) but maybe John Hampson or someone else on this thread is… Kent:)?
a little more i just dug up on hurst cycles “what’s next ” dated 5.10.15
http://hurstcycles.com/sp-500-whats-next/#sthash.3jpUeHM8.dpbs
Scott – The chart is from Brad Gudgeon’s blog. I can’t say his calls are very reliable.
Generally I am finding on quite a few websites that most are calling for a short term correction (very soon) and then a new high around the June FOMC meeting. That being said, I tend to agree somewhat with this chart….any correction will be only to the 2040 zone or so and then the bounce will start….I can’t see a bigger correction anytime soon.
Price missed the next Spiral price target 2138 and is running out of time. Spiral expects a last chance high tomorrow between 7 and 10 est.
GM / Purvez
You cannot achieve these things whilst money exists. The sh@t all has to go basically.
J
We will see.
Consider…gold standard favours savers= hard money, deflation allowed.
fiat money issued by govt = soft money, favours debtors, inflation allowed
The Euro, neither inflation nor deflation tolerated, savers and debtors treated equally. I wish the ECB much luck in the battle versus dying currency/empire.
(They do have a not-so-secret weapon, it’s shiny & yellow).
GM: “The Euro, neither inflation nor deflation tolerated….”
Are you suggesting that the business cycle will no longer exist?
sorry purvez, missed your question.
My answer: no, I’m not saying that.
😉
Scott
I find it noteworthy that all the cycles and other processes I have seen do not work but interestingly all these types of processes have something in common. That is a scientific sounding explanation as to why the process failed. “inversion” is one word and there are others of course. I am open to considering new methods but they have all been wrong at times. Look at the spiral as well. ….
The thing that strikes me is that it should be accepted that there is no hope of certainty in predicting price. At best maybe probabilities….
A cycle is always a cycle until it isn’t. For some who spent decades developing or researching one, it can be hard or even impossible to let it go or accept randomness. Or of course that whilst they may have been right for a while but now just wrong. My experience tells me that I am wrong often and this will continue but generally turns out well being focused on price and price behaviour.
Good luck to all.
J
J, I’ve read a couple of semi fictional short pieces where the benevolent use of Bio & Nano techs could make that happen.
Personally I think the science needs another decade or two. Then we have to get past human greed which may take a whole generation or two.
Peggy – Does this mean that if SPX does not hit 2138 at some stage tomorrow, this is a signal to short?
Kurt
When it gets this close in time and price, best to rely on whatever trigger you use to enter.
Peggy – thanks for the reply.
Yes I think I will wait a bit and see the price action…..doesn’t look like the short trigger can be pulled anytime soon. I still think we may get a new high after Memorial Day and maybe then a small pull back (if one could even call it that).
There is little doubt Yellen would like to
begin the process of rates normalisation,
marco does not justify this.
It is not just a FED issue, it is global
weak end demand.
I’ll throw my hat in the ring with all the others that are calling a top today. I posted the indexes with some light commentary. I note the the NYSE did a double top today and all the other US indices hit my measured objectives. Coincidence? Also through in a couple of cycle analysis screens. Oh, and DOW Theory …
http://www.worldcyclesinstitute.com/forecast/end-of-the-end-ing-diagonal/
Well, this is disturbing….
My S&P system flipped to a 50% Sell signal tonight, which means cover the 50% long position taken a few days ago, and be 50% short by COB tomorrow…
I say disturbing, because it seems like everyone ELSE is thinking we just hit a major top too…. And that’s usually “no bueno”…. :-O
Regardless, system is short, and I am short already, so good-to-go…….down…
Too many people calling a top makes you nervous?
The majority don’t think that Barry, just a few here. The majority think it’s a secular bull.
Hi GM;
Well, it’s not just here, but you certainly make a fair point…
I often over-think things…. Which is helpful…..half the time…. hahaha
“China shares ralliy after poor data”………..pretty much sums up the whole world. And thus the continuing disconnect gathers momentum, which we ALL know will end in disaster.
Let’s party like it’s 1999!
There is a difference between Main St and Wall St,
worth keeping in mind.
In the midst of weak macro and generally insipid growth
corporates continue to churn out record amounts of dividends.
Even in the Eurozone skirting recession this is the case.
Ultimately there comes an inflection point where end demand
weakness begins to reduce earnings and impacts dividend growth,
are we at that point now? – as always difficult to say.
That is the key to whether the new bear market begins
this year – the cycle does not need to roll over for a correction
which can develop on sentiment shifts alone.
The FED has now effectively all but ruled out a 2015 rate rise,
longer term US rates are once again falling.
US macro now needs to come off hard to herald a new bear phase
this year.
The point that you ignore Phil is that today’s financialised world means that you have the chicken and egg the wrong way round.
It is in fact a market panic, loss of confidence, and tightening of spreads, restriction of credit rollovers etc, all of these will force the global economy into contraction. This is why the world is FUBAR, the financial world no longer fosters a sound economy, rather it guarantees its strangulation.
And our host has implicitly made this point, as the financials turned first in summer 2014, with the real world slowly catching up ever since. Macro is already on the slide, and has been for 2 full quarters (see frequent Alhambra blog posts as evidence, and elsewhere).
Phil, the facts already disprove your somewhat superficial thesis. Markets first, real world follows.
Even by the current bearish nature of this blog
there appears an almost overwhelming anticipation
of an imminent sell off – John H is on the attack and reading
through some of the above comments others are equally
expecting downside.
Said it before will say it again. liquidity holds the key and liquidity has not nearly recovered from the GFC.
Certainly CB’s are pumping the system but it ain’t working. Velocity of money is, in a word, disastrous, bond markets are a shadow of their former selves. What little liquidity has filtrated through has gone into the share market.
Real wage growth is shrinking, whilst boards create the illusion of growth by borrowing at record levels and using that capital, not to invest for real future growth but to buy back stock to improve yields
The whole thing is an illusion and yet everyone carries on like it will go on forevet.
Oh and I stand corrected on my earlier week suggestion that NFLX would be the poster child of this bubble.
That honour will now go to SHAK. Current valuation of $3.21b with a grand total of 67 stores.
If you were to divide the market cap by the number of stores it comes to just under $50m.
They sell hamburgers, fries and shakes in market that is ultra competitive and where consumers are more fickle than ever.
Nothin gonna go wrong with this market.
Oh wait here’s why. They just put all that IPO money into developing a new chicken burger.
I mean let’s face it, chicken burger development costs are astronomical and it’s not everyday that somebody or anybody, can develop a chicken burger
http://finance.yahoo.com/news/shake-shack-considering-chick-fil-135600822.html
Ha!! A company that’s putting money into R&D rather than buy backs. Looks like a sound business plan.
As you say nothing to worry about here.
Random thoughts. Haven’t posted for a while, but then sideways markets don’t need much comment. So far this year, M. Armstrong has been right about consolidation thru May, if he’s right things should get more exciting in June-Sept.
I’ve been concentrating on developing more short term indicators and picked two s/t tops using low VXX volume as a sign of complacency, which may show up today if vol 1.2. Previous occurrence on Feb 26 showed a top two days later, then a two week drop from SPX 2117 to 2040.
McHugh has posted minor Bradley turn date on May 18, and major June 9th. My feeling is that we see a s/t top Fri or Tues, then drop to SPX 2040ish by June 9. Still good chance of one last rally to SPX 2180 by end of July.
editor ate a sentence so I will spell out….
I’ve been concentrating on developing more short term indicators and picked two s/t tops using low VXX volume as a sign of complacency, which may show up today if vol lt 12 mil mid day or lt 25 mil eod. Second indicator is VIX put/call gt 1.2. Previous occurrence on Feb 26 showed a top two days later, then a two week drop from SPX 2117 to 2040.
Thanks for your thoughts I think this forcast looks good
I think we are close to a top and after a sharp sell off starting next week we will see a final top despite all bad macro news..
and august,september the CB’s have to come up with a master plan…
Cheers
John.
On pace for another 70mm share spy meltup on 70% volume and poor global economic data. Poetic symmetry to all of us cycle pundits that at 10.02 eastern time post Spiral expiration for a move to 2138, SP500 starts a 7 point move higher.
just hit 2138 then straight up to 2500 and don’t ever stop. keep printing monopoly money, issuing debt and buying moar…. and put me out of my misery so I know that the 1.618 extension from the 2007 high didn’t stop the insanity either. Yellen, Bernacke, IMF, Lagarde and Drahgi, federal bankers and central banks will need to find bunkers to hide in when this blows. there is no way out gracefully, just look at the dow transports.
argh
The MMs make sure the markets up before the holiday. They almost never let the markets correct before the long weekend. We probably all agree that the move up is all artificial at this point.
No worries. They will soon pull the rug, very soon. The sentiment has been extreme. The intermediate score has again popped back above 65%. This has been one of the longest periods in history that the intermediate sentiment score is fluctuating at extreme levels without triggering an intermediate decline.
SPX 5 wave up looks complete as of today. I am waiting for a pullback below 2125 then go in 100% short.
Yeah I feel your frustration….can’t go long cause you never know when they will bring it down and of course you can’t short it either. I shorted ES @ 2118 and was lucky enough to come out of it @ 2116 in AH trading. This is such a crazy market…..one would think that the dismal macro data would kill the markets but this is what we have as “markets” now…….
I overestimated. 53mm shares of spy in the entire regular session. 64mm shares total. who needs liquidity when 80% of the market holds and the rest is a slow melt up of hfts, algos on bad economic news. what a farce. it amazes me how this market continually doesn’t move south until panic sets in. fund managers so desperate for yield they risk billions for that extra 1-3% no where to put funds and everyone afraid to hold cash…. dumbfounding…really. remember linked in at 253….holding out for that move to 265-270? the flush is long overdue and it should be exceptionally painful. the volume and trading range has become so narrow, it must be difficult for the day traders to profit.
its starts east and moves west
http://www.zerohedge.com/news/2015-05-21/crash-contagion-second-hk-billionaire-wiped-out-seconds-after-stock-instacrash
Do you fell a chill crawling up your spine?
In the late 1960s gangs of millions of Chinese killed each other claiming to have the truth via some red book or another. There is no religion or social clue that binds either the Chinese to each other or Americans to each other. All that keeps America from socially blowing up is economic momentum which explains the actions of the FED.
Scott on Oil – it’s geopolitical risk largely,
ISIS making gains in both Syria and Iraq.
Spiral update – next low either midday on Friday or before the open Monday. Targets are 2010, 2105 and 2099. The next high is forecast for no later than 5/27 with current price target of 2141 which may be adjusted after the low is in.
First price target (adjusted) 2115.
Looks like SPX has tested 2134 twice now and has not gone past. The highs and the lows are virtually identical over the last 2 days. Seems to be a topping process but next week will be the real tell (at least that is my 2 cents).
I think the early part of next week will still be strong (maybe SPX does hit 2141 or even a bit more) but a retrace is possible towards the end of the week.
Fibonacci extension of 2138 SPX for the whole move from ’07 to ’09 still makes more sense than anything i’ve seen lately.
In the meantime i heard a couple of good ones.
Buying gold is a conscious decision to refrain from investing.
and
The only time that stocks have been this overvalued, is………… never.
To be fearless is to be either very brave or very stupid.
Ignorance is bliss, don’t worry be happy.
Once there is proper accounting for the GDP effect of illegal drugs all will be normal again. No scratch that, a normal bond market will kill everything.
Ignorance is bliss, don’t worry be happy. Promote ignorance.
Scratch that idea, market saturation reached a long time back.
What if the reason for he lack of a sell-off is Fear ….of Chaos.
Most know deep in their soles that with the next economic downturn that it will be Chaos. Therefor, they refuse to sell their stocks in an effort to prevent that Chaos that would result from a stock/economic crash.
Richard, that would suggest that Big Money was altruistic.
That’s a leap too far for me.
“Markets are forward looking”. Because markets are forward looking this market looks forward to the Chaos that would ensue should it sell-off. Because the market doesn’t want Chaos it refuses to sell-off. It is because the expected sell-off and economic collapse would produce Chaos –in this day and age– that the market refuses to sell-off and the CBs keep on printing money to keep the markets from selling off and prevent the Chaos that would result.
haha – we really are clutching at straws now?
J
A virtual circuitous argument. I love it.
We still appear to be in a sweat spot where macro is
keeping longer term US rates ultra low, it’s also preventing
the FED from beginning a process of rates normalisation –
however data is not weak enough to impact average dividend
payouts or equity buy backs.
This goldilocks scenario never lasts, it could all look different
in 6 weeks time, or it could take 6 months or longer.
Northern India usually receives one inch of rain in May and Southern India usually receives two inches of rain in May but so far there has been none. Thailand usually receives over seven inches of rain in May but, so far, there has been none. There are predictions that Vietnam is going to have a one hundred year Drought. This El Nino may be more powerful than is currently expected.
John H, is long Grain ETFs. Scroll down for May total precipitation and for monthly averages:
http://www.weather.com/weather/tenday/l/Bangkok+Thailand+THXX0002
If predictions about Vietnam experiencing the worst Drought in one hundred years proves correct then this could be the most powerful El Nino in one hundred years and constitute the evidence that the heat energy of El Nino’s doesn’t come from the Sun but from the Earth. None-the-less, the most powerful of the usual four El Nino’s of the Lunar Declination cycle is this one and it may be getting more power from the Earth than usual.
Furthermore; Southern India is averaging 13 degrees F above normal in May (115 F) and has had no precipitation. This is a clear sign that this El NIno is going to be at least as powerful as the El Nino of 2009 if not much more powerful:
http://www.weather.com/weather/today/l/Hyderabad+India+INXX0057:1:IN#!
Note: Environmental conditions of 115 F with no precipitation is the weather conditions of a Desert and that is exactly what the weather conditions of the southern half of India have been, so far, for the month of May.
JH has already displayed a full picture of the market and why it is due to come down imminently. I would like to add one tiny analysis that the EW count also confirms that the SPX 5 wave up has also been complete. I believe that the Oct type correction is due imminently, as late as the first week of June. Target SPX is around 1800. imho.
You must be joking….we would be lucky to see 2080 assuming it even gets there. SPX could continue this “topping” pattern all the way till June FOMC with perhaps a very small correction.
Kurt. You totally underestimate the correction magnitude. Obviously my timing is based on cycle probability, hence could be off a few days to a few weeks; but imv the Oct type correction is due within weeks. Sentiment has been at the highest level in the history of the SM.
We shall see soon.
The fibonnacci queen, Carolyn Boroden is a very respected technical analyst and trader, below is a video recap of her SP500 analysis 5.21.15. worth a review as it spends some time on the timing expiration this week w/ SPY right at its 1.618 extension from the 2007 top.
http://www.fibonacciqueen.com/public/SPX-updated-4.cfm
Erick, You may end up being right…..but I maintain that no one method gives great timing when it comes to going long or short these derivative instruments. ES futures are a good example…..they are probably the most manipulated right now and I think SPX will only fall if CB wants it to…..if not this topping process could just continue till next FOMC meeting and then we may get the “correction”. I don’t see any October 2014 type lows in the cards even over the next 4 weeks. Possible a retest of 2040ish or so…..if we are lucky but that would be about it. Now if I am wrong, you can call me out on it.
Scott, Carolyn describes herself as a cautious bull in this video, which is frankly the most sensible stance with the market at all time-highs. Over time, all-time highs have been a good place to buy, with high probability of gains on a one-year horizon, and lower-than-average odds of losses. Technical analysts who rely on the naked eye rather than statistics often miss this, as their attention focuses on those highly prominent but comparatively rare occasions when record highs were followed by heavy losses, i.e. 1929, 1987, 2000 etc.
The larger Spiral trend tops 5/25. The smaller one topped yesterday. The markets are closed on Monday so I am expected a low today instead of Sunday/Monday. Price targets are 2118, 2120, 2123.
US dollar at highest levels since May 5th, back above breakout of 6 week consolidation 1/15 – March 30th. nothing to see here, move along and keep buying moar stocks.
Since the DJIA ATH on Mar 19, the action looks corrective rather than impulsive……unless of course its a 1-2, i-ii in which case we should expect a third of a third.
Ha! The words ‘wishes, horses, beggars and ride’ come to mind.
Scott,
nice video, thanks for sharing
in my experience this is the most important issue for the market
Vix as low as 11.82 after Yellen sat on it like a little chihuahua. back at levels last seen on Dec 5th when it closed at 11.89. dec 12th close was 21.08. that would be fun to see again…. just sayin’
DEC 24, mkt closed at 1pm SPY 42mm shares traded closed 207.77 (nicely done for xmas) no manipulation…no way
Dec 26th 56mm shares traded spoy closed 208.44
From Jan 2- Jan 6th volume tripled and spy dropped to 199
Today? 5.22.15 w/ 70 minutes to go we have traded 35mm shares. Yellen couldn’t goose it to aths even with the lowest volume day in the last 2+years.
time for a good old fashioned false flag this weekend and grexit to give this market the correction it needs to wake people up before a real crisis begins
Nasdaq is just a hairline away from the all time high 5132. They might let it fly to resistance 5132 early next week, sucking in more bag holders before pulling the rug. This would be my worst in the worst case scenario, but I don’t think it would last more than couple days before the selling starts accelerating.
wow…check this out regarding the chinese stock market.
http://www.zerohedge.com/news/2015-05-22/chinas-tulipmania-full-frontal-shenzhens-parabolic-stocks-just-hit-67x-pe
guess, I’m no longer bearish on the US. This explains where all the macau gamblers went instead of giving their money to Steve Wynn
Chinese analyst Wai Tu Hi agrees.
🙂 Sum ting Wong just wrote an Alert bulletin that the FED and Swiss Bank are out of funds and couldn’t by Moar to day to achieve a green close for the holiday weekend. At 53mm shares of SPY traded, there was just too much selling to overcome.
I have occasionally wondered what the Chinese do with our names in their language.
😊😊
Spiral update. Low midday today at 2123 as forecasted. The smaller cycle is down until Monday so it’s possible that a lower low is ahead. Next high is no later than 5/26 at 11:50. Most likely target is 2139-41.
Betting ascend or betting descend is the same. Win or lose we are here for a moment and then we are gone. So be thankful and begone. And your trove or lack thereof has absolutely no meaning, but your true self is certainly of real meaning where you are going, but not here, not now…
And as it is, so it was. And as it was it shall always be…
Pete, can you ever just talk plain speak?
bradley turn dates straight ahead middle power 5/24 53/100 siderograph 5/25 31/100 could either be up or down….supposed to be a change in trend, so should be down. based on Carolyn’s fibonacci cycle, time is expired so there should be no immediate move to 2139-2140 on tuesday. as long as zero volume shows up again tuesday, don’t bet against the spiral. unfortunately I bet w/ the spiral last week and missed badly when the forecast of 2047 missed pre mercury retrograde
That price target was revised in plenty of time. Maybe easier to just trade the larger trend. 5/12 L, 5/25 H and 6/6 L.
Peggy, I had direct communication from Sean from the Spiral website and he suggested I front test his data. it wasn’t until 5/11 after the miss was the forecast revised and he was. looking for those targets of 2047 right through 5/8. so no, there was not plenty of time to adjust. the major miss had already occurred during the front test and I didn’t have enough faith given the significance of the miss to try again.
i’m glad you have had good luck using his system and wish you successful trading. as always I will look to incorporate the spiral with other information out there. I was hoping the spiral forescast to present this week so we could tag the 2138 extension and be ready for the throw over next week, but for now I agree with Carolyn’s forecast and believe time is up for ATHs. Have a great memorial weekend.
Scott
Thank you for testing. It is worth remembering that no system is going to be right all or most of the time. The spiral will almost certainly prove to be no exception. I generally tend to run new ideas or systems for some time in a safe environment before risking any capital.
Thanks for feedback.
J
To be clear, 5/8 was a Friday and Singularity (major turn and where the low was expected) occurred 5/11 (Monday). The low did occur there as the Spiral expected. Anyone who has read the 7442 Analytics website would look for the low there – the price projections are not part of Spiral timing but an additional method that creates price targets. Time. And. Price. You are mistaken to say that Sean expected a low past that date. To keep it simple, remember that when the Spiral is at maximum expansion (Expansion) or at maximum contraction (Singularity), there is a high or a low. Every trader has a trading system that triggers entries and exits – even a basic moving average cross will identify these turns for you. If you wait for a specific price (even if it gets close!) you may miss the turn. As it happened in early May, the low was a double bottom (5/6 and 5/11) with a low at 2056 – 9 points from 2047. I will continue to update this site with the Spiral forecasts for all interested.
just starting to build a swing short position on China with an initial tranche. Initial target around 12k on the A50. Max number of tranches 5 unless profits banked with guaranteed stops are in place.
Good luck and have a great weekend.
J
JH, re. agri ETF, do you mean to buy companies like Monsanto, or do you mean to actually buy commodiites like Corn?
Sorry I see the answer…long Grain ETFs
I don’t know enough to comment about this asset.
Hi Kurt. You are right. My guess a probability guess at best. It is based upon the big assumption that the markets have topped, or will top imminently. I think Nasdaq 5132 is too big and too risky a huddle for big money to continue dumping their capital in this late in a cycle. I am simply calling the market top.
My reason is that the breakout has been very weak. Based on the length of the consolidation stocks really should have generated a much stronger breakout imho. I would like to see the confirmation that the intermediate cycle since October 2014 has topped by early next week, either Tuesday or Wednesday. If the mild sell-off next week takes SPX down below 2125 and beyond, back into the body of the triangle consolidation, that would be a firm confirmation that the intermediate cycle has topped out. Barring the Fed intervention, I fully expect the markets to correct hard, especially if the dollars continue down to its intermediate cycle low.
I agree with you also that nobody has been able to time the markets perfectly.
Dr. Hussman, despite his brilliancy, has been calling the market crash for 2 years now. While my timing could turn out to be completely wrong a pure guess based on my cyclical count, I don’t think I am being unreasonable to expect a large correction. My expectation is that the coming correction has to be the Oct type correction, an extreme decline with large magnitude of 5% to 10% in order to firmly confirm that the cycle since Oct 15 cycle has topped. The large money then will sell into the next cycle, which should be about 45 days from this sell-off, which would fall around September/October as many folks of this board are anticipating.
From the risk management perspective, the market upside is almost capped already, while the only risk of shorting is the Fed intervention. VIX has been pushed to the level that it will snap back to at least 20, and the intermediate sentiment level at 65% is the same as the 2007 pre correction level.
Good luck to you.
“I am simply calling the market top.
My reason is that the breakout has been very weak. Based on the length of the consolidation stocks really should have generated a much stronger breakout imho.”
Although I have previously been targeting a mid-May high, the levels that got hit are far below my price expectation. In other words, the two week sell off after Apr 27 highs got hit had the effect of markets trading sideways even after the post May 14 rally. So having said that, my thinking and observation mirrors exactly what you stated above … especially the part about “based on the length of the consolidation stocks really should have generated a much stronger breakout”.
I think what this implies is that markets have reached strong technical price resistance, which now also runs into time resistance too and is possibly a prelude to a strong and sudden short term reversal.
Do what you will with trying to nail the short term flip trading game, but keep in mind that the correct medium term swing strategy (i.e. in months) would be to ultimately go long near the bottom of such a dip if it indeed occurs.
Thank you much Steve T. Agree wholeheartedly with what you said, especially “which now also runs into time resistance too and is possibly a prelude to a strong and sudden short term reversal”. Both cycle count and EW need an impulsive reversal to confirm the cycle top. A whipsaw would kill the count, and the cycle length would be stretched to the unprecedented level.
Hi Erick – thanks for the detailed reply.
Not trying to pick on you or anyone else on the board for that matter. I’ll make this short….I still maintain that we will see some selling but it will not be anything like the October scenario even though EW analysis seems to point to it. I think we get a 4 – 5% drop (at best) and that will be it before we get to new highs around the next FOMC meeting. I was short the ES futures @ 2118 and was lucky to be able to cover at 2116…could have been worse if not for the chop last week. I think the bigger correction will be later this year…..but time will tell. It looks like we may see some small dips and bounces this summer but nothing major until the fall. I believe the real fireworks will start when 10Y yields start pushing up despite the efforts of the CB. Volatility in bond and forex markets may eventually spill over into a meaningful correction in the equity markets. However time till tell if this is the case.
Good luck to you.
Kurt, have you noticed that US 10-yr yields rise during QE and fall when supposed tightening is on the cards? I believe you can’t have noticed, given your comment about yields and the Fed above.
A low in US yields lies ahead, in the middle of a deflationary mess, somewhere around the 0.3% mark is my guess.
*Things* need to happen for yields to start rising, mostly in Europe and the developing world, a cleansing fire of capitalism to allow renewed green shoots to appear.
Correction: Lots of typos in my post. Sorry. Oct 15 should be Oct 2014.
Just returned from vacation to San Diego, CA. Highly recommend this as destination especially Sea World, Balboa Park, Safari Park, Sea Port Village, La Jolla, Midway USS tour, and the beaches. Hope you all have a good summer and lots of time to enjoy the rewards of your successful trading. I am nursing a short position in the SPY which I will exit no later than Thursday at the close. Seasonals May to June transition are often bullish with moves of 3 to 4 percent to the upside.
All Lunar Chord indicators are bearish this week esp. Mon, Tues, Weds, Thurs.
‘Sea World, Balboa Park, Safari Park, Sea Port Village, La Jolla, Midway USS tour’
All sounds very American, very fake.
Glad you enjoyed it though.
Thanks, GM it was somewhat fake in the sense that SD is a desert coastal sage brush ecosystem onto which a lush oasis has been overlayed. Lots of exciting research being done there in a variety of areas esp. aviation, new energy, and materials. No work being done on transmutation of lead into gold. So, the five thousand year reign of gold as the king of monetary exchange is secure.
Kurt, what pushes yields back up?.
There is global weakness in end demand which
crimps the recovery.
I would only change my view on this if we
saw a strong rebound in US growth in Q3/4
and it became clear this is mid rather than late
cycle.
It cannot be ruled out but it’s a huge if imv.
Just an additional thought on this issue: what will start to push yields up in the Eurozone is markets selling the bonds in fear/panic, because of recessions and government solvency issues.
It will eventually reach the US, growth or no growth.
Capital flows, down Exter’s pyramid.
Yet another link to human influence by the sun. Hemoglobin chemically similar to chlorophyll allows mammals to consume UV radiation as energy instead of eating food. Link to actual research paper from below.
http://wakeup-world.com/2015/05/22/research-plant-blood-enables-your-cells-to-capture-sunlight-energy/
What they fail to mention again is how photons spin and angular momentum of those photons interact to produce said electrons upon absorption by chlorophyll in addition to bombardment by human eyes and skin tissue.
Does this mean that a McDonald’s extra value meal is really just photons? Also, is it ethical to trap photons in solar panels and make them work for humans as energy slaves?
Well yes an extra value meal according to Einstein’s equations is just that. Photons and matter and interchangeable mathematically, but only one study has ever gotten it to work and that was in recent history. Molecules and atoms specifically absorb photons that then excite the electron shell. It’s how heating and cooling work actually.
Solar activity is rapidly diminishing. Could “The Top” already be in given that the refusal of the consumer to spend gasoline savings is pointing to a major economic contraction in play?
What if the Summer of 2015 is a “summer of contraction” helped along by the collapse in Sun Spots?
It is my guess that all anyone has (even when up their sleeve) is guesswork.
But if I second guess your third guess I guess that one of us has a remote chance of being either initially or eventually somewhere over the rainbow.
But only near a new moon or high tide in Scorpio ascending with divergence.
You remind of the riddler from batman.
No more like Frank Gorshin as the Riddler on the old Batman TV series
“Riddle me this”
Not to mention the solar cycles
Or the 80 trillion km long pillars in the Eagle Nebula (as representing global debt)
So once the debt is non-payable what is it? Still unforgivable?
Is this not also a good reason why we choose to believe in God?
Because we humans are so… human
Keep taking the pills my friend, maybe you’ll recover.
Otherwise, I look forward to these brief snippets of your lunacy.
King $ back with a bang.
Spiral update – high expected no later than midday today. Low expected 5/28 after the close or 5/29 midday. Price target 2098. Larger trend is down until 6/6.
correction – low expected 5/27 close or 5/28 midday. 2098 is the price target.
Lunar Chord:
Today apogee- weak another 3 days
Post lunar green period – weak another 7 plus days
Planets – merc conj 5.30 accelerates moves up or down
Declination – weak another 7 days
Tides- falling all week, bearish
In summary, I am fully short since last week in the SP500. Not going to double up even tho’ this looks like a 4-5% correction as others have mentioned.
so this is what volume looks like, I will take a Mid day spiral high on SP500 today at 2107-2115. before the plunge to retest May 6 lows
Long on the dax 11600. Good support here so expecting a bounce over the rest of the week. Support from euro weakness as well. Hope everyone learned from the last crazy dax selloff a few weeks ago that it is just panic selling and the general trend is still upwards.
Wow Krish, I do wish you luck with this trade, but I remember your posts from April when you were bemoaning your short positions and (almost) praying for a recovery to save your account. And yet you’ve dived in so quickly once again?
I don’t think the Dax is in an uptrend any more, at best it’s consolidating, but more likely it is starting a post-bubble decline. It hasn’t even managed to regain 12,000 on the latest rally:
Not my place to offer you advice, but be very careful indeed, virtually the whole market has your mindset, that it’s onwards and upwards for ever, and a weak Euro means equities can’t decline. Very dangerous times are these.
Good luck.
Yep your scenario could happen so i’ve kept my stake small but looking at the recent explosion upwards a few minutes ago I think a move to 12000 is more likely. Stoploss at breakeven now so risk free trade. Hope some others also bought near the 11600 support. All markets moving up so this is a positive for the bulls short term at least.
Dax had an inside day on the futures, so I’m still wary of much strength there.
Well its hit my stoploss and broke below 11600. Might drop down to 11400 now where I’ll be looking to buy again. Greece leaving the euro will just create a fantastic buying opportunity as it is too small to impact the real European economy. If you maintain a slightly longer term view of a few weeks or months rather than day trading i think remaining bullish on europe will pay off. Obviously this requires being careful with leverage.
There’s a lot of gaps down around 11,000 and lower (same for many indices).
Apparently, all gaps get filled eventually.
I don’t share your optimism re Europe generally, and whilst I don’t see any country exiting, it’s not Greece that will cause the real troubles, it’s Spain, Italy, Portugal, France, all of whom are going to default sooner or later. Not necessarily this year of course, but the market is likely to start selling the govt bonds again.
Confidence: set to evaporate.
Europe will fail disastrously. I have no doubt about that. To make money you need to decide what is the best investment for your money. Bonds or stocks. The low interest rate environment is making government bond yields fall and thus stocks are a better return. For that reason I feel Europe is a buy. This won’t always remain the case but with central banks buying bonds they will not fall significantly any time soon. For that reason I remain optimistic. This period of consolidation is good and should help the dax propel higher later this year. I have reentered long dax at 11421 with no stop loss at the moment.
Arrived at price target. More downside ahead – will post price targets soon.
Spiral update – 2096.75 possible before a bounce
this week’s Spiral https://www.facebook.com/186938551317676/photos/a.194355243909340.51474.186938551317676/1013792818632241/?type=1&theater
To summarize (and simplify) – Spiral down to around 6/6. First low 2096.75 to 2100. Then bounce to 2120-2122. I am posting Spiral updates to demonstrate that price movement is predictable. Please make your own decisions and use whatever technical triggers you find work for you.
Good updates Peggy, thank you. Nice to see the bradley turn date triggered this time, we should see some good follow through
2096 was good call Peggy as that was todays low price bounced off of.
Peggy, they are mentioning time as “cst” on the post but do they mean “cdt”–Central Daylight (not Standard) Time?
yes I think so. I post EDT.
I truly, at my core, wish the BTMFD traders get completely trashed this time. I don’t think we are ready for the big correction yet as I still think August-October is that time frame, but given the melt up on volume that was at 2 year lows, the bulls are way too cocky and need to be crushed.
I still think 2040-2050 is in play for this week or next.
Price moves are not predictable but it’s good to see some additional tools that could be used for identifying possible levels and direction.
J
Yes J, my little observation of the Spiral shows it has quite good ability to define direction in the short term.
It would help to strengthen my belief if I understood a bit more of the ‘science’ behind it in general terms.
Spiral update – next price target 2111 or 2120
Another good call, Peggy. Upmove was between the two targets.
Apogee was today. By selling at close trading day before apogee, and repurchasing SP500 at close of trading day 3 days after apogee yields a 7.5% annual advantage vs. not selling. Add 7.5% if short during those 4 trading days. As apogee represents the greatest distance of moon from earths surface and the moon is a energy collector makes sense markets, plants, and people would have less energy during the days following apogee. That is why Maori people do their planting on apogee days cause the earth is so calm and good for germination of seeds.
Mercury Retrograde approaching midpoint May 19-June 11 : excerpt from Merriman mmacycles 5/25/15 prior to today’s action
Mercury retrograde may be striking financial markets again.
The trickster turned retrograde on May 19, the very day that the Dow Jones Industrial Average and the S&P nearby futures made new all-time highs at 18,351 and 2134 respectively. The NASDAQ Composite, however, is still short of its all-time high of 5119 on April 27, for a case of intermarket bearish divergence.
New multi-year highs were also in evidence in China and Japan last week. The Chinese Shanghai index soared to 4658 on Friday, May 22, right between the Venus/Pluto opposition and Venus/Uranus square. That was its highest level since February 2008. Tokyo’s Nikkei Index rallied to 20,320 on Thursday, May 21, its highest level in 15 years.
The rest of the world was rather tame, with most rallying well into the end of the week, but far below their all-time highs recorded in April, especially in Europe. An interesting exception to this was in Australia, where the ASX fell to 5580 on May 20, its lowest level since February 2, which was the middle of the last Mercury retrograde cycle.
Gold and Silver posted new three-month highs on May 18, the day before Mercury turned retrograde. This could be important, as the last time Mercury turned retrograde was on January 21. Both Gold and Silver posted primary cycle tops then too.
We now shift our market timing attention to the end of this week and beginning of the next (May 29-June 1). This will coincide with the middle of the current Mercury retrograde passage. Any market that didn’t revere nearby to the date Mercury turned retrograde (May 19) is susceptible to reversing around the middle of this retrograde period.
This was highly noticeable the last two times of October 15 and February 2, when U.S. stocks posted the previous two primary cycle lows. After that, U.S. stocks soared to new all-time highs within just a few weeks.
Mercury retrograde and its midpoint are not, however, the only important geocosmic signature unfolding now. Venus is in the midst of forming a T-square with Uranus and Pluto, May 21-25. This too has a strong historical correlation to reversals in world equity markets within 4 trading days, especially in Japanese equity markets. That high in the Nikkei on Thursday, May 21, may prove to be important.
Also important is the approaching Sun/Mars conjunction on June 14. As it moves to that important period, both will form a square to another trickster-like planet, Neptune, on May 25 and May 31. On top of that, Neptune will turn retrograde on June 11, the same day that Mercury will turn direct. With Mercury retrograde, hard aspects to Neptune, and Neptune turning retrograde all in the next three weeks, markets may be running on fumes – hopes and wishes, rumors, and all sorts of misinformation used to disguise the truth or awareness of what is really happening.
3 days after Apogee….27, 28, 29 would indicate the lows on Friday the 29th correct?
Correct, based upon Apogee only max weakness over on Friday at close.
I see said the blind man to his deaf dog
Wave e also a diagonal triangle…
http://barestbodkins.blogspot.com/
Yes Peter_ the ending diag within an ending diag does make sense.
Peter, did you study philosophy in college? What informs your world view, it is kind of unique.
Spiral update -close to first price target 2111. Could go to next price target 2120 but the trend is down – next price target 2091. Use your own technical triggers.
Spiral update – 2119 to 2120 high, then 2098 low
This is beyond any shadow of a doubt the MOST contrived market in history.
Spiral update – expects a high midday today – ideally by noon
it makes sense. 1% now constitutes a correction…not 5, 10, 15 or 20%. buy fdippers are once again rewarded as 1% is now a tradeable dip. we are trading in the narrowest of ranges in over 80 years 6.9%. well played dark pools.
next likely time for a high 14:30. Will update Spiral less frequently. The larger trend is down until 6/6 which will be pinpointed by the smaller trend. Will upate time and price as they approach.
wall street waits to hit the exits all at once, no planning, no preparation, wait until the building is on fire….in the mean time, media tells them to buy every 1% dip, bernacke tells them to buy, algos, dark pools all manipulate. this will end very badly.
http://www.zerohedge.com/news/2015-05-27/when-stock-buybacks-go-horribly-wrong
It will end in a new bear market as happens
with all bull markets.
I find the it will end badly comments difficult to relate
to as we all are aware what happens when a bull market
finally rolls over.
sorry Phil, I need to stop venting. it will be all over soon and I will quietly go away as have many idiot bears over the last couple of years. $ down, good for us stocks, $ up bad for us stocks GREAT for Japan…last 2 weeks $ up 5%…and we have continued V shape corrections after a 1 day selloff. no continuation on a pull back like we had in July 14, Oct 14, Dec 14, Jan 15, March 15…no just a small blip and off to the races again. i’m just stunned. may 6th, may 12th, now may 26th – immediate reversals. bears used to have 2-4 days to make their money, now its 2-4 hours
Vent away Scott!, and no need to apologies
for simply stating what’s on your mind.
Apologise even
Any EWers here willing to take a stab at providing a count from, preferably the DJIA ATH, but I’ll happily trade that for the S&P ATH.
Apart from yesterday’s action there doesn’t seem to be anything else impulsive here, which doesn’t portend well for a correction.
*for a bigger correction
hi all ! Yes, everytime the market goes down one day, we see strong central bank buying to prevent any correction. Quite frankly, central banks are doing a fantastic job. Everybody should be grateful. I sense quite a bit of frustration on this board. Why don’t you just give up the bear case and join the bulls ? You will feel a lot better.
Thank you
Yes mate they’re doing a stellar job. Central Bankers and baby boomers, of which I am ashamed to admit I am one. Have robbed future generations of prosperity for years to come.
FANBLOODYTASTIC!
Congrats on your assertiveness Nicolas. You have won the day. This doomer admits defeat.
Anyone using logic, reason, historical precedent, facts, and utilizing basic mathematics is declared a doomer in today’s world. The sheep would rather follow assertive idiots than an introspective wise person. We are awash in assertive idiots in control of Congress, government agencies, Wall Street, mainstream media, and the corporate world. The psychopathic lemmings will meet their demise in due time. It will be obvious after the fact.
“It has been more profitable for us to bind together in the wrong direction than to be alone in the right one. Those who have followed the assertive idiot rather than the introspective wise person have passed us some of their genes. This is apparent from a social pathology: psychopaths rally followers.” – Nassim Nicholas Taleb, The Black Swan: The Impact of the Highly Improbable
“The market can stay irrational longer than a bear can stay solvent.” – Keynes
Buying stocks as the central banks ease has worked nicely for six years. Investors who have gone along with this have made good returns – and continue to do so. Those that have consistently tried to call the top in the face of the central banks’ actions using faith-based techniques have had their backsides handed to them – repeatedly.
While following the herd and the central banks in this way may strike you as crude and perhaps even immoral, it is surely more credible than trying to fight the trend with imaginary patterns conjured up by long-dead snake-oil salesmen.
But Spanish Archer, you conveniently forget that the central banks eased from 2007 through to 2009, and the markets crashed.
You’re either a fool, or another troll.
But we’re on to you.
GM, for the avoidance of doubt, I am talking about QE rather than mere interest-rate cuts. QE has a much more direct impact on financial markets, particularly upon liquidity. I am under no illusion as to what is driving the markets. Were the liquidity to be withdrawn, I believe a deep bear market to be very likely. In the meantime, I am happy to stay invested in stocks.
spanisharcher, your knowledge is sorely lacking, typical of market participants these days.
QE does two things: it reduces liquidity, as govt bonds are sold to the central banks and collateral vanishes. The banks that have sold their bonds to the central banks just hold the cash as reserves at the Fed, it does not flow into markets.
The other thing (it’s main goal) is to force those seeking yields to reach ever higher for it, and so it creates bubbles.
But, history proves, such bubbles burst, when investors see that the economy is declining anyway (and corporate profits too). Feel free to play in the bubble, even more fun I imagine when you are ignorant of fairly basic facts.
But, soon those fire exits will be jammed full of sellers, as the fire starts to spread. Buyers….no, you won’t see any of those, not unless you look a long way down.
Hope you don’t get burned!
That’s funny. Nicolas joins thew board in Aug last year with S&P at 2000 and now it’s at 2123…up 6%. Not bad returns I guess but hardly worth all of the risk in my opinion.
Nicolas is a fraud and a troll who feeds on bear misery. He has added zero value or analysis other than chearleading central banks stimulus after every V shaped recovery. Of which he has had plenty of opportunity. other than quoting the media whores of central banking and monopoly printing. the only specific calls he has made recently was to buy AMZN at 448 and gold at 226 and other commodities at their recent top pre-mercury retrograde. at best he is a psychic vampire with very little redeeming qualities and repetitive contributions.
Ronbo thanks very much for the sanity check!!
Whilst I’m pleased for friend Nicolas and admit it’s been a frustrating 6% …. this is one slap in the face with a wet fish that I welcome.
Thanks very much!!
I refuse point blank to make profits at the expense of creating the future misery of my grandkids. I prefer to live with myself and be able to look my kids and grandkids in the eye.
Each to his own.
Hi Allan
The debt based monetary system causes this and in fact is designed to do so in some ways. Individuals have a choice to try to prosper within it or face a potentially harsh life outside it. I doubt that “Nicolas” is a real person with honest intentions. If he is he will learn the hard way as we have all done before him.
Patience is key. Be careful out there!
J
‘The debt based monetary system’
jeger, I’m curious as to what precisely you mean by the above?
Jeger IMO will give a much more intelligent answer than I, but to me debt based monetary system is global monopoly money debt leveraged at multiples we can’t imagine. Global debt/underfunded pension and medical obligations estimated to be : 3.5.2015
The Guardian reports that global debt has grown by $57 trillion dollars – to $199 trillion dollars – since the 2008 financial crisis.
How much is that? It’s a big number … but what does it actually mean?
The Guardian notes that global debt is now more than twice the size of the entire global economy:
couldn’t help but post this since it just came up on zerohedge. here is an excerpt:
History shows that it is fiendishly difficult to preserve the value of money which is backed by nothing but promises, because it is so tempting for rulers to debase their currency when they think it will help them repay their debts.
Both extreme deflation (credit collapse) and extreme inflation (which forces citizens to forego normal economic activities and become traders and speculators in a desperate attempt to keep up with the erosion of savings and value) are threats to societal stability, and we don’t actually think there is much to choose from between those extremes.
from me : not to mention underfunded pension fund managers chasing returns to keep up with 7 % discount rates. How is this accomplished? huge risk taking, derivatives, and leverage.
http://www.zerohedge.com/news/2015-05-27/billionaire-hedge-fund-manager-paul-singer-reveals-bigger-short
The system is stacked against your grandkids whether or not you seek to make money in today’s heavily-manipulated environment. Would it not make more sense, then, to exploit the opportunities as you see them and then gift some of your profits to your successors to ease their lot? Just a thought.
Barely a thought though.
Allan, and others like me, are playing a slightly longer game than bubble-players.
I can’t be bothered to explain it to you though.
Spiral expects a low tomorrow midday – could get back to 2096. Will update price.
First price target 2111
In relation to my China short position, despite being around 1k points in profit will not be added to until the almost inevitable bounce has been assessed. I wasn’t expecting this magnitude of drop so suddenly so rather than jumping in I prefer to play safe.
Good luck
J
US DoJ and the FBI can find enough evidence to bust FIFA, but not one US banker is held accountable for the Sub-prime fraud that nearly brought down the global economy and that “A” hole Jon Corzine walks around a free man after stealing clients money. Go figure?!!
I’m not sure when but the day is coming!
Can anyone please suggest a ‘suitable’ acronym for the following ‘illustrious’ people.
Janet Yellen
Mario Draghi
Mark Carney
Haruhiko Koruda
Zhou Xiaochuan
============
Just to be clear, it needs to be suitably ‘degenerate!!!’ 😜
Thx in advance.
….jmmhz….close enough to ‘purvez’ !!!
😊😊
purvez, I just noticed your question to me above about the business cycle (re inflation/deflation).
No, it won’t be abolished. I’m working on a post, it will be covered there.
purvez, within this list there are two opposing factions: China/ECB v the Rest.
The former have already moved on to the next system, the latter are just fiddling while the old system burns.
….top pickers/paper traders here still posting drivel….except for john and peggy/few others!
….nasdaq made a new all time high today….and spx will most likely make one tomorrow/Friday……target is 2138.
Bruce, please would you explain how you arrived at your target of 2138?
Thx.
from what i have read on other pages.. it is a 1.618% extension of the move from oct-2007 highs to the mar-2009 lows
Thx CW’13
Armstrong called for churning through May and that has happened. Also called 18300 as initial resistance and we got close last week.
June is a turn that either sends us past the 18550 level to a blow out into the turning point (Sept 30) or GM turns down setting up the top in short term gov’t paper.
Seasonality points to this next week as a positive even if we are in the “sell in May” time frame.
End of this week is a great place to enter a short with the 18550 as the stop loss.
Noticed that this jives with Merriman in above post.
Good luck all long suffering bears if any are left. I’m neither bull nor bear but take a swing when I like the pitch. My third swing in 4 years am I going to strike out?
Bruce, you’re a real dribbler eh…please explain to me how we made new all time highs in the nasdaq today???
Bert
On a closing basis.
J
GM
Good morning. Scott has outlined some very detailed aspects of a debt based monetary system. Without wanting to hijack the thread a very simplied reply would be that almost all the “money” that exists is actually debt – I.e. It is owed to someone else. Debt is interest bearing so there is more money owed than is available to pay it back. That is why brainless economists always talk about growth and why growth is “vital to prosperity’. It is actually vital in order to pay off interest of course. This is why companies that stand still (too long) will commonly fail or be purchased by another – almost always through use of further debt.
It is wealth transfer of course on many different levels but also shows the parasitic nature of the institutions that are the only ones who can create debt. These institutions regularly post multi billon dollar profits which are basically only made because they have been given a licence to create debt and charge interest, and not least they use others money to do so – they do not have any of their own much like the government. Who funds this theft or parasitic activity? The taxpayer, through labour. Who bails them out when this licence to print money operation which should be very simple goes wrong? The taxpayer, through labour. When you add leverage into the mux as per Scott’s post the effect can be magnified quite significantly. But basically all the money in existence more or less is debt. It is owed by someone to someone else. And on all of it there is interest accruing.
On a personal level the monetary system is not an issue in terms of how it treats me, but it doesn’t stop me from seeing that it doesn’t work for most people globally. This is why I say that the only way to progress as humans is to get rid of money entirely and move to something resource based. Not based on scarcity, competition and inequality – which is what a monetary system almost always has been and certainly will be going forward. With money in particular there will always be corruption (and I don’t just mean bribe or the simple concepts usually associated with this word).
J
Thanks for your reply jeger. Nice job on the China trade, hope you catch a full-blown crash there.
You will be very interested in a post on money/banks etc. that I am working on for the Screwtapes blog, so I’ll avoid clogging up this thread. There are changes happening to the system that solve all of the issues you raise however.
jegersmart….yes on the NDX but not on the QQQ.
I think he mentioned Nasdaq but you can check…
J
Here’s the bullish setup I referred to last week. Does it play out?
http://stockcharts.com/h-sc/ui?s=%24SILVER&p=D&b=5&g=0&id=p09530337489
One thing I know for certain is that PM’s aside from a few select stocks are the only value play left in the entire financial world and that goes for real estate, antiquities and everything else you wanna add. Commodities in general including crude are set up to collapse.
GM
Thanks, would be very much interested in reading this blog – can you share link?
J
Will do, it’s not quite finished yet.
Spiral update. nearing 2111 price target. If 2111 doesn’t hold, next targets 2107, 2102, 2098.
Spiral price target 2122
2122 IF 2111 holds.
This is the only chart that matters in regard to US markets and it is screaming bear market dead ahead.
http://stockcharts.com/h-sc/ui?s=%24TRAN&p=W&b=5&g=0&id=p32704208207
This chart may be screaming “wolf” more than “bear”. As the Hulbert article makes clear, nine of out the last fourteen of these “signals” did not lead to a bear market.
There is a significant difference this time. Hint……
The divergence that commenced in gold in tne face of significant USD strength November through March. All but completely ignored by just about everyone.
Canadian and Aussie gold stocks have been the biggest market performers in their respective markets compared to last times the metals rallied, when the gold stocks hardly rallied and gave up their gains very quickly.
I respect Hulbert but have my own opinion.
What is the record of this gold/dollar divergence signal?
Notice the “back filling” in the PM complex?This is near perfect for a market bottoming.
Not getting too ahead of itself, filling gaps, back testing moving averages.,doing the hard yards needed to build a solid base in the face of scepticism at any rise.
http://stockcharts.com/h-sc/ui?s=SLV&p=D&b=5&g=0&id=p99367461759
Allan should like this news
Direxion is going to close it’s 3X Bull Gold ETN because of lack of interest
This is how you know China is worried:
http://finance.yahoo.com/news/know-china-worried-150558108.html
V shaped rally yesterday because Greek floated rumor (lie) to stop bank run on cash – dispelled today and IMF confirms Greece may leave the Euro
Market reaction ?…. meh …buy,,,,BUY, BUY!!! MOARRR . All is well in the world of milk, honey, and lies. expect to see green on the day.
In fact, selling should just be outlawed along with cash. line right up to get the mark of the beast placed right on your forehead or embedded with a chip
Spiral price target 2122-2123.
If the market is a bucking bronco machine that is programmed to remove riders as quickly as possible of their money so that a new customer can try it out…
then any down move will be of size and most of the move will be at nighttime. With Mercury conjunction this weekend, Scorpio moon Monday, full moon approaching, and perigee a ways off, could Monday be the big day? Maybe not good to be long over the weekend. My recent attempt to be short the SP500 resulted in no net gain, and no opportunity cost since market has been net flat during the last 8 trade days. No compelling reason to be long as some astro stuff is showing a possible top soon with bottom at 8.10.15, so will probably stay in cash for a while. By the way, 8.10.15 to 10.10.15 “could” be a time of maximum gains in the mining sector (Venus inf conj to Venus west elong). If Direxion cancels JNUG between now and then I would consider that a confirming indicator.
Hi Valley,
Do you also have an astro date for the top (soon)?
Thanks in advance
John.
Venus “falls” into the sun (goes inferior conjunct) from mid June to August 10. This usually casts a pall of fear over risk assets, stocks and especially miners, on August 10, dramatic rise in equities and miners that lasts till the end of the year.
thanks.
Call me out whenever you like. I asked you what your view of recession likelihood was and you came back with schoolboy sarcasm. Not a great way to showcase your supposedly superior knowledge.
Spiral expects a low around 11:30 tomorrow.
spot on.
Spiral update – Low today by noon, price targets 2111-12, 2107-08
Peggy, many thanks for your continuing updates. You had mentioned a bigger Spiral down to June 6. Do you have a target for that one, please?
2090 is first target
low possible as early as 10:10
Good morning ! Excellent news this morning: US GDP down 0.7% in the first quarter, Canadian GDP contracted 0.1% and also the Swiss GDP was down.
All this is very good news for the markets, we should be on our way to new all time highs.
Please post some positions because I can never quite tell if you are kidding…bad economic data is good?
Sadly, he is right. In this screwed up world, bad news is indeed good. Weak data betokens more easing and for longer. The markets continue to bubble higher. Sure it’ll all end in tears. But it could take a whole lot longer to do so. Why not keep playing along for now?
Weaker data is only supportive if it continues to
hit a seat spot where earnings and dividends
do not begin to rapidly roll over.
Once that happens bad is good/supportive no longer applies.
Which in turn depends on if a recession is just around the corner or if we’re already in one. I am not expecting a U.S. or European recession for now, however. The ECRI index doesn’t point to it, for sure.
Gosh, you’re so keen to demonstrate how little you know!!
Go and research the components of GDP, then report back.
(Hint: you have the cart leading the horse, but only because you know so little).
Crack on.
http://www.bea.gov/newsreleases/national/gdp/gdpnewsrelease.htm
So you think the outlook is recessionary based on last quarter’s GDP? Or what?
Go away, troll boy.
Is anyone who dares to express a view contrary to your own a troll? I personally like to exchange views on the market with people with opposing opinions. But if you just want to swap self-reinforcing platitudes with fellow-believers, that’s up to you.
SpAr, your post are good, not at all troll like imho. Your view is basically Nicolas view with I agree with and will be most profitable longer term cause over the next decade I expect much higher equity prices, real inflation, and higher gold prices. When inflation is the goal, equities will rise longer term.
Your view, as I have explained, is based on a lack of comprehension of even the most basic facts. Yes, I do not refer to views, but facts.
You’re just here for some fun with us, much like Nic, so don’t cry that I call you out.
And I will continue to highlight your nonsense, so man up.
I don’t mind you calling me out. I’m just disappointed you don’t feel able to tell me your view about the recession and instead resort to swaggering sarcasm.
Spiral update – next high price target 2123
2103 possible for today’s low
Trade the price/trend … not the forecast 🙂
you might be surprised! watch for 2090. There’s a Singularity low next week.
what is “Singularity low” important low?
Singularity occurs when the radius of the Spiral is at it’s greatest contraction.
7442 Analytics Spiral forecast – bounce here and then 2090 https://www.facebook.com/186938551317676/photos/a.194355243909340.51474.186938551317676/1015134025164787/?type=1&theater
Sell in May and go away. If May doesn’t get you, then June will. Two fairly reliable sayings about the negative seasonal between now and Oct. Jake Bernstein, the cycle commodity letter writer, says seasonals are weak and easily overridden, thus use them to determine relative weakness or strength. So during this bull mkt the peak has stretched into late Jun and corrected but generally was sideways, indicating strength. Of course, we are hoping to see some significant weakness all the way into Oct.
Great job Peggy posting your spiral price target updates. FWIW I am currently thinking there is a short term bounce from today’s low to a temporary Jun1/2 high and then a deeper plunge from there to Jun 5/8 (back to near May 26 low). It appears May26-Jun5 could potentially mirror price movement from Apr17-30, but only if SPY 213 level gets taken out early next week.
For those who do not think markets are manipulated and do not believe there is a group of “insiders” in the know, here is an interesting conspiracy theory. Recently there have been a bunch of “fake prints” on the intraday charts for SPY.
May 26: 212.91 (occurred at least twice when price below 212 and below 211)
May 27: 210.76 (occurred >211.8)
May 28: 212.72 (occurred <212)
May 29 (today): I just noticed 212.45 print at 211.65 level
In fact, the fake prints for May 26 and May 27 both show up in the daily charts even though price never ever hit those levels on either of those two days!
The fake print for May 26 hit next day on May 27 (212.98 high), FP for May 27 hit May 29 (210.82 off by .06), FP for May 28 hit later that day in after hours (I saw 212.8 at least) …
So some group is purposely jerking around prices in an exaggerated whipsaw manner both above and below anticipated levels and/or stops before sending it to their ultimate fake print targets in the near term.
SPX chart seems to be making a Russian Doll of diagonal triangles.
But I think it could be a fake i.e. manufactured in USA.
Peter_ are you suggesting that this is not an ending diagonal and therefore won’t correct downward?
If so what’s your alternative EW count please.
No Purvez, This formation is so strange that there can be no doubt about what happens next. My count for SPX is entering Primary wave 4 (corrective) being the partner to wave 2 which ran from May to Oct 2011. The depth of wave 2 was about 280 points.
Steve T: You are right on. This is entirely an artificial market. I don’t ever recall that the intermediate sentiment indicators have ever stayed at this extreme levels without generating an intermediate degree correction. Today is a good example, the markets were trying hard to correct earlier today, but BTFD is bringing them almost all the way back, aiming to pain a bullish week.
These markets are simply on borrowed time. Patience for the bears are required and will be rewarded.
Please bear in mind that 30% of traders on Wall St today have less than 5 yrars experience. They have simply not experienced first hand what is going to happen in the next cycle. If you grow up with zirp, the markets make more sense. ….?
Imho
J
going down, baby! Thank you Sun – Mercury conjunction this weekend. Dragging down to 2050 area next week on ES
Francis Bussiere and his Astrocycle charts deserve mention here.
http://stockcharts.com/public/520756
Few words, lots of public charts
The probability conveyed in his SPX – moon chart is posted
http://barestbodkins.blogspot.com/
Because it makes the hair on my neck bristle
Reconciling the view of Nicolas CB equity support vs. GMs real economy.
Facts:
CB have printing press, can create infinite amounts of money, are actively involved in acquiring equities for their accounts, which factually was not there in years past.
Economy is changing in ways that make much less friction between producers and consumers and the costs for producers ex labor being lower due to intl. labor markets and reduced costs due to lower energy prices. Labor costs are set to relentlessly decline in next decades due to rapid implementation of robotic manufacturing.
Past economic history while relevant, will imo only rhyme with what will play out going forward, as the components of the economy will be of a completely different nature. To compare what happened when horses were the main transportation and communication was done with telegraph (which all pre 1920 economic history was defined by) is not useful.
‘Economy is changing in ways that make much less friction between producers and consumers and the costs for producers ex labor being lower due to intl. labor markets and reduced costs due to lower energy prices. Labor costs are set to relentlessly decline in next decades due to rapid implementation of robotic manufacturing.’
It’s been the same for the past 30+ years, one could argue since the Industrial Revolution. Constant advances.
What changes in the year ahead is money and the nexuses surrounding it.
Central banks have inflated since the 1600s, it always ends in tears. Nothing new there. Let them buy every equity out there, get it over and done with eh? Think that through.
Never before has there been digital currency that can be instantly transferred assuming mutual consent to the exchange. So long as everyone agrees to the value of each nations digital currency thru an exchange mechanism then the system of exchanging real goods and services can continue forever without the need for gold as a backing. For example, the dollar has constantly lost value vis a vis other currencies since 1980’s and could continue to do so the last year being the exception. I agree that CB equity purchases has limits, and can be undone at any time and that equities in US especially are way beyond valuations, however, it is difficult to time ones withdrawl from them real inflation is way above 2%, and bonds pay so little. Also, it is not out of the question that the combination or lower energy costs, efficiencies of new labor saving tech, communications, and transportation could help lower corp costs enough to keep price earnings at current levels with annual stock price increases of or at real inflation (say 6.5%).
In ten years with that scenario, and assuming global currency exchange is stable, stocks will be double their current prices, most consumer goods will also double, and gold could go up 400% or be only slightly higher than today. Productive assets like equities are going to be officially maintained at ever higher levels as they are the economic workhorses and provide the carrot to innovation and guarantee of retirement for most workers, gold is real money, is not supported officially and will only ascend in price if their is not mutual agreed upon values for the digital currencies.
Valley: “…..and will only ascend in price if there is not mutual agreed upon values for digital currencies.”
This I believe WILL happen because as M Armstrong says there will be a loss of confidence in Govt.
I also think that the ‘developed’ countries that have made social security promises, which they can only fulfill through massive money printing or renege on, will be most affected by this loss of confidence. Third World countries’ populaces already have no confidence in govt.
I don’t know what the effect on the price of gold will be, which I believe is the subject of the argument. Although history suggests it could for a while be an acceptable form of barter.
I should really say : ‘subject of the discussion’ rather than argument. That word has negative connotations.
valley, I do admire your optimism. But you shoulg go check ‘real’ returns duting the period from 65-82 for US equities. Life becomes very hard for most during periods of high inflation, including bib business.
You will see in time.
Digital currencies have been around for a long time, and will continue, that’s life.
Valley, there hasn’t been a single year since 1900 when CPI inflation went above 5% and the S&P made a positive real return. Inflation is generally toxic for equities, although is better clearly for those firms with pricing power and potentially for those with substantial debts. The key question is when today’s monetary shenanigans give way to inflation again. I guess I’m in the “quite a way down the line” camp.
GM do you have an ‘ETA’ for this thesis/report you are working on?
Definitely looking forward to it as clearly you have a train of thought that is intriguing.
I do my Armstrong models from major turns NOT fixed dates.
I split into 1/8ths as per his H&S pattern.
You turns at 2/8ths 3/8 4/8 5/8 6/8 and 8/8ths.
The chart below shows up to 6/8ths with that mid Aug 2015.
Interestingly, the full 8.6 years ends Oct 11 2017.
Yep, 10 years exactly from 2007 top and 1 day more than 15 years from 2002 low.
What a coincidence !!!
New post out
Valley makes some interesting points.
My thoughts are that it is indeed difficult to envisage or imagine the potential methods that will be used or perhaps even more importantly the motivation of institutions in doing what they are doing now and in the future.
I don’t disagree that the potential for stock markets being double or more in 10 years existS but focusing on this and a few other elements is too myopic.
At the end of the day cb’s can print endless “money” if they ignore all the negative impact of doing so, but I still would ask why QE is really being done. I don’t think that most institutions like the Fed believe they can stave off problems indefinitely. There is in theory no reason why deflation is such a bad thing in normal circumstances (expanding credit levels and then shrinking) except where the debt levels are so high that normalisation would be hugely impacting on the only driving force in the system – I.e. the taxpayer.
So if we assume that it is the case that the situation is far worse than anyone imagines, what is the motivation for example for cb’s to continue to buy equities? Whilst equity ownership is relatively high in terms of participation rate in the USA and some other countries – it is not like this would transform someone’s future retirement when money is being devalued massively. So I look at the true motivation.
I think the current discussion around this is motivated by the human need to rationalise irrational behaviour – in this case the extreme stretching of parameters compared to history. You cannot have a “market’ where no one sells. You cannot avoid demand destruction in a monetary system. Tge Fed knows this. What is the real story here?
My thinking is that debt levels are so high now that any interest rate rise will slowly become disastrous. Not just for governments of course (they can print money to a point) but the main problem is corporations. When you look at the last few decades and the legislative changes in favour of corporations over human beings I feel this is key In understanding the goal. Money is king, all bow diwn whilst it lasts.
Imho
J