
People unwittingly buy into new moons and sell into full moons (typically, not always).

People perhaps a little more consciously buy and sell seasonally, but unaware they are being guided by geomagnetism. Again this is more often than not, rather than every time.

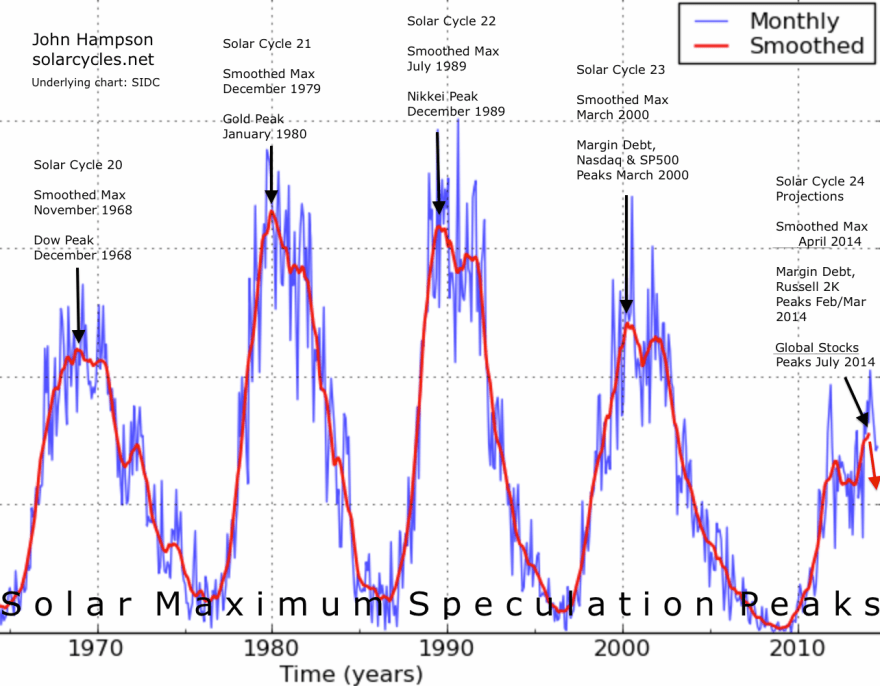
And people unwittingly buy into solar sunspot maxima, typically or normally.

Therefore, it should follow that looking for the new moon which falls closest to the inverted geomagnetic seasonal peak which falls closest to the smoothed solar maximum ought to lead us to a major market peak, in a triple confluence of ‘peak’ buying (within the month, within the year and within the decade, respectively).
Considering the last 5 solar cycles then gives us five exact dates over the last 50 years. They are:
A) SC20: 19 Dec 1968
B) SC21: 17 Jan 1980
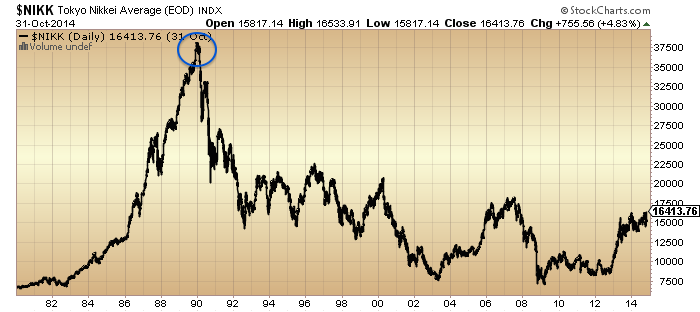
C) SC22: 3 July 1989
D) SC23: 6 Jan 2000
E) SC24: 27 June 2014
Did a major market peak fall close to any of these dates? Yes indeed…
A) Major Dow and FTSE bull market peaks in December 1968, two weeks from the date.
 Source: FiendBear
B) Major gold and silver peaks 21 January 1980, 4 days from the date.
 Source: Greshams-Law
C) The Nikkei peaked 29 Dec 1989. The new moon closest to the inverted seasonal geomagnetic peak after the smoothed solar max was 31 Dec 1989, 2 days away. In other words, the rule worked but on the seasonal peak after rather than before the smoothed solar max.
D) Major bull market peaks in FTSE 31 Dec 1999 and Dow 14 Jan 2000, both within 8 days of the date.

E) Our current scenario. Rather a lot peaked or reversed direction around the date of 27 June 2014:
Stocks:Dollar, Stocks:Treasuries, Junk Bonds and Junk Bonds:Treasuries

NYSE Composite, NYSE breadth, Volatility (inverted) and Crude Oil
NYSE Cumulative Advance-Declines, Dow breadth, SP500 breadth, Nasdaq breadth:
FTSE, CAC, DAX and Euro Stoxx indices
US Dollar (inverted), SP500 Bullish Percent, Leveraged Loans and Copper

Not only this, but the combined central bank balance sheet expansion of Fed, ECB and BoJ peaked out around this time, as we might expect given the sun should be guiding them too.
Plus, drawing on the Nikkei 1989 experience, if we also look at the geomagnetic seasonal peak that fell at the end of the year 2014, then the new moon was 22 Dec, and the Dow and SP500 peaked very close to this as things stand.
In short, if the stock market is as ‘dumb’ a mechanism as this, then there should be no new highs ahead in any of the indices or indicators listed. The three solar influences of sunspots, geomagnetism and lunar phasing (nocturnal illumination by the sun) silently guided the markets to a peak.
The caveat for this is that solar models are correct and the smoothed solar max is behind us.
So, in the near term, the move up of Wed and Thu last week should be repelled before new highs are reached. Friday’s move down may be the start of that. However, the new moon of Jan 20 is still a high on the geomagnetic model (the last high before we tumble down to the March/April lows) so falls in earnest may potentially wait until after that. The Nikkei in 1990 tumbled in earnest once February hit.

Thank you John, very much….n
Cheers
Thanks again John.
I recall that January is usually a good month as people put their bonuses back into the market. Your seasonality chart suggests otherwise — did that chart come specifically from Y2 of the presidential cycle?
Here is one chart that shows positive January returns.

Last year, the stars were aligned and we didn’t crash. With Y3 of the presidential cycle, the stars will not align for a while, but the market always surprises, doesn’t it?
The only question is whether to wait till Sell-In-May. We shall see…
My seasonality chart is the average of all years. January has a reading over 3, it’s high and positive.
Which is more important — the level or the trend?
If the level, the geomagnetism euphoric is still high though off peak for the next 2 months. If the trend, we just passed the maximum likelihood for the market peak.
I suggest with rose colored glasses that it might be the trend. The average year has little solar activity, and this geoseasonality is not a factor. This would explain why markets tend to peak in Dec/Jan and yet on an average year, Jan is a great month. This would also explain the wisdom of the January Barometer as an indicator — whether the first week of January method or the entire month of January.
Just like to add that *should* a crash occur in 2014-2015, the turn of the year is a likely window — I had said this several months ago in my previous post about year-end buying and capital gain deferrals. In the new year, if our hypothesis is right on mania, the herd would now be free to take capital gains after waiting all of 2014.
My post above was about the chart that shows that the ES futures declined in Jan/Feb for an *average* year. That doesn’t seem right. But yes, 2015 is likely not to be an average.
Got you. Yes, generally, I would say trend over level.
1/1907 was an example of a start of year peak too, and more importantly, I think the only example where it is Y3 of the presidential cycle. Note that this was also a 2nd term president.
Astounding work John. Your research should be mandatory reading by anyone wanting an enlightening insight into the effects of SC’s upon markets and you have certainly opened my eyes to one very and most likely, most important tool for identifying speculative market peaks.
I have believed for many months that you did nail the top of the speculative peak. Many argue against that because they, as do most investors, consider the major US indices to be the only market warranting more than a cursory glance.
As such they fail to see how looking further afield can reveal so very much more.
There are major moves afoot and there have been for many months. We are close, so very close to major declines.
Cheers
Thanks Allan
Allan and John, I say this with the greatest respect but we can only say the top is in with hindsight many months into the year. So saying that John has nailed the top is premature. Infact since Jan 2014 John has been calling for an imminent crash in almost every post whilst the market the market is 10% higher since then.
This post is not in any way meant to cause offense or criticise as it is almost impossible to nail the very top and John has backed up his conviction through credible analysis. However, to keep everyone honest it should be noted that the market has yet to show it is in a downtrend. I.e. lower lows and lower highs.
Duncan no offence taken everyone is entitled to disagree but IMO the evidence is quite clear and will become clearer to others with time. Don’t forget we are of course referring to the “speculative peak”.
It depends on where you look.
Lower lows and highs are quite evident on many major global indexes. Investors really need to look further afield at the BIGGER picture because from where I sit and look the top of the speculative peak is in and deflationary pressures are clearly escalating.
The US indices are going to take a massive hit very soon.
We take out the previous lows very soon and when we do watch out it’s going to be fast.
http://stockcharts.com/h-sc/ui?s=$NYSE&p=W&b=5&g=0&id=p69217458862
Cheers
Totally agree with that Allan. One of the most compelling yet out of dozens of compelling articles by John.
Thank you Simon
Technical market report for January 10, 2015 from Mike Burk:
“Leadership is narrowing. Although the market averages have been hitting new highs they have been doing it with fewer individual issues hitting new highs. This narrowing of leadership is symptomatic of a developing top, but it can go on for a long time. Last week was weaker than the seasonal average and seasonally, next week has not been up for over 20 years.I expect the major averages to be lower on Friday January 16 than they were on Friday January 9.”
October Low must not be violated or the “Second Chance” bear play will have a reasonable chance to play out.
A matter of time, John. In my opinion 2015-16 would be the time to see the 3rd crash-17-years cycle-, especially US indices, similar to 1906-9-16-19 upward structure DJI-,. Eurostoxx, Cac40, IBEX similar NIKKEI90s structure.
Best case, -0,5fib. retracement, DJI and S&P, similar to 1980-82-17-years cycle- and worst case -0,76, similar to 1919-21, even 2002 bottom.
I know your even worst scenario, but is time not yet time to.
Must wait current 17-years-cycle ends, assist to a Eiffel Model like 1720- 300 years cycle, or 1923-29 structure, what is similar.
@apanalis
John,
Your July peak is actually spot-on in all regards except one. Consumer inflation in the U.S. in 2014 was at least 8%, and in many cities and the oil boom areas more like 12%. The recent drop in gas prices has been entirely offset by a slow creep in utility prices and a sharp spike in food prices which continues unabated. i am unable to find one single securities price series which is today 5% above its July top, which means they have all been undesirable investments since July. The glaring exception is TLT, up about 25% (is that possible? is my math wrong?) since July.
The consumer inflation is the result of a bipartisan U.S. decision to finance the
Iraq conflict via money supply expansion, just as the ultimately successful Vietnam defense was financed thru inflation in the 1970’s. A whole generation of Western
kids have never heard the phrase “adjusted for inflation”, but during deficit spending binges, wise investors always look at “after-adjustment” figures. To add another direct hit to your July list, U. S. real estate listing site Zillow.com has been predicting since October that Texas real estate will not outperform inflation in 2015. That consumer inflation is approaching the virulent phase, (check out the auction prices of 60 YO Ferraris!) and that the smart money is piling into TLT, looks a lot like an economic top is approaching. Typical of accelerating in flation is the fact that auto accidents caused by uninsured motorists in Texas (where auto insurance is mandatory) hit an all-time percentage high in 2014.
On a shortterm note, February 6 is the temporal midpoint of the departing Jupiter-Uranus trine, which should bring a run-up to a top around then. Entirely coincidentally, Hans Hannula’s Overflight, which has a 62% probability of marking a top, also occurs on February 6. Note that both tops have in the past come in a bit early so the period after January 20 may well be unusually dicey.
Thank you for your outstanding work.
Thank you
john u maybe correct in your fundamental view and charts etc but price is the only thing that matters and that is what u have been wrong on for the last 12 months, eventually we will see a crash cos that’s what always happens especially after this enormous bull run, will u then claim u are right?
Can the evidence get any clearer?
Speculative peaks:
http://stockcharts.com/h-sc/ui?s=$NYSE&p=W&b=5&g=0&id=p69217458862
http://stockcharts.com/h-sc/ui?s=$AORD&p=W&b=5&g=0&id=p30615707207
http://stockcharts.com/h-sc/ui?s=$RUT&p=W&b=5&g=0&id=p09657710488
http://stockcharts.com/h-sc/ui?s=$HSI&p=W&b=5&g=0&id=p85868248842
http://stockcharts.com/h-sc/ui?s=$DAX&p=W&b=5&g=0&id=p71892876410
Deflationary collapse well underway:
http://stockcharts.com/h-sc/ui?s=$WTIC&p=W&b=5&g=0&id=p58490893660
http://stockcharts.com/h-sc/ui?s=$COPPER&p=W&b=5&g=0&id=p74302925301
http://stockcharts.com/h-sc/ui?s=$DJUSCL&p=W&b=5&g=0&id=p92661241472
http://stockcharts.com/h-sc/ui?s=$DJUSIM&p=W&b=5&g=0&id=p31035396376
TLT has been a great performer in 2014. Will it repeat in 2015? Who knows.
However, what i do know is that an epic 30 year plus bull market in government bonds will not in all likelihood end with a whimper, but with a massive compression in yields as investors stampede into them.
Great post, John. Given the obvious effect of solar and lunar upon market movements on a daily (tides), monthly (phases, declination, distance), and decadal (solar max and min), a combo of these seems to add value.
Thanks, agree more may improve it further. Do you have your method in chart form?
Only pen markings on paper price charts. I find having each indicator whether it be lunar phases, declination, or distance to be easier to understand when they are placed separately on the chart. Often they exhibit unique though intermittent price effects that would be lost by combining them into one line. Seasonals present their own problem since they are so predictive on price, especially during certain times of they year (month of April, June and September weak weeks, Thanksgiving and Xmas no sell weeks, not to mention the end of the month effect and the 9, 10, 11 trading days of the month where most of gains occur in the broad indexes). I am approaching this effort in swing trading as a stepping stone into day trading e mini futures which is where I feel drawn. I plan to use the “Lunar Chord” and seasonals, retrogrades, etc. only as a supplement to a technical and tides based trading of daily futures contracts. I subscribe to “Nightscalper” which is a renko bar based trading chat room that trades the e minis 24 hours a day using technicals only. Guessing that using their systems and including monthly lunar and seasonals and daily tides it should be possible to earn a nice daily income and have fun. There are drawdowns of course but with money management and discipline seems doable. Given the leverage of futures and the abundance of resources on their successful technical trading and their 24 hours trading that is where the action is for my trading. Thanks again for this site, and if I develop a digital version of the charts that I am working on I will be sure to share.
With opt exp this week and the ECB meeting on QE Jan 22, I would not be surprised to see a “buy the rumor, sell the news event” for ECB meeting. A move to SPX 2100+ would setup the triple top scenario I discussed early Dec. Move could be sharp down into FOMC Jan 17-28.
Duncan/Robbie, 2014 was a humbling year. Indicators stretched to the unprecedented in both level and duration. You can’t prepare for the unprecedented, and I can’t regret my analysis, but I absolutely got some things wrong. The set up for a crash has been there for getting on for a year but without delivering a crash, yet. I believe I captured the start of the topping process, Jan 2014, but ever since then the market has refused to deliver the end of the topping process, namely the hard falls. Once the hard falls hit, then we will have the requisite hindsight to label the top. But by that point it’s largely too late. So I continue to do my best to calculate developments, and mid-year 2014 looks increasingly compelling as the real top. I am not the kind of person to mislead. I will take credit where I have earned it and hold my hands up where I have failed. My thanks to Allan was for his kind praise, if you read it as something else.
John, your humility is refreshing when most seek to obfuscate their predictions when they’re not correct, but I wouldn’t be too hard on myself. Many indexes were down for the year, and even more so if one was invested in the native currency. So a mixed bag, to be sure, with U.S. markets being the strongest (the best house in a bad neighborhood).
Thanks Gary
If there is a strict relationship between SSN max and a sudden, sizeable and sustained speculative crash-
SC20 – 1968 – Dow
SC21 – 1980 – Gold
SC22 – 1989 – Nikkei
SC23 – 2000 – Nasdaq
Then it has already happened-
SC24 – 2014 – Oil
That’s true, although in those previous examples the relevant market saw major price increases before the crash, whilst oil didn’t here. Along similar lines I was thinking that given various assets peaked around the 27 Jun 2014 date, we don’t need all to peak then. However, it is unlikely we see European stock indices go down whilst US stock indices go up.
Price action in oil over the decade leading up to mid-2014 was actually similar to the 1960s Dow leading up to SC20 peak (in fact, Dow had formed a double top from 3 years earlier – so there wasn’t a single spike into the SC20 peak).
But most importantly, the argument you have presented is that there is a speculative surge, which peaks at SSN max, and which is then followed within a month or two by large declines (or even a full-scale crash).
That simply has not happened – except in oil.
Some stock markets are up a bit since the SSN max; some are down a bit. Just look at those charts above of Dow (1966), gold (1980) and Nikkei (1989) – they are nothing like current stock market action.
That’s true, but if stocks fell hard between Jan and Mar/Apr then it would be similar to the Nikkei 1989/90 example.
I believe Oil’s crash happened during 2008/9 where it ran up to $150 and then tumbled to $30. That one is more like the moves that happened in your other examples.
Mark,
I think u r correct. The bubble at SC24 was oil…and the price doubling was seen in the derivatives market. ERX doubled within a few short months. Every cycle peak is a different sector, index, commodity, or even country.
$ resumes it’s rise following a very brief lull.
everyone and their dog are hiding in biotech as the last bastion of the bull market. Everything seems to be complying to John’s analysis. Especially like the downside action in the financials.
MLPs selling off hard (AMJ) – the market sniffs out malinvestment in the energy space. First big support at 35 (current 42).
From RIchard Bernstein: In particular, investors seem to be underestimating the risks of MLPs*. These stocks are very expensive and have negative free cash flow yields (Chart 3). They offered free cash flow yields in excess of +5% years ago when we thought they were attractive. Today, they have free cash flow yields of almost -5%! A 50% drop in oil prices seems certain to have a negative impact on MLPs because of the sector’s overvaluation and increased dependency on external capital for funding.
agree
This is a useful comparison of the 1929, Nikkei and Nasdaq bubbles: http://www.chartguy.com/Bubbles/ThreeBubblesColor.pdf
The similarity of the tops (both in price and time) is obvious. That initial two-month decline in 1929 was a 47% drop – and that was just for starters, before the official crash even began!
In the lead-up to each of these bubbles, prices increased by between 450% and 750% over 7/8 years. So far in the current US stocks cyclical bull, SP500 prices have risen by “only” 200% over nearly six years. Perhaps this is just falling into the “new paradigm – this time its different” trap, but based solely on a comparison with these three previous bubbles, there is room for another doubling of US stocks over the next year or two. I’m sure many indicators were extremely stretched then too.
As for solar timing, Nikkei and Nasdaq tops were very near SSN max, but 1929 Dow top was more than a year after SC16 SSN max – and SC24 is very like SC16.
Markets would need to rally on genuine economic growth like those previous scenarios. This market has been rallying on debt and accounting tricks.
I note your use of the word “genuine”!
US GDP growth is now running at 5%, same as the late 1990s: http://www.tradingeconomics.com/united-states/gdp-growth
You might not trust the official GDP, inflation or unemployment numbers – I don’t – but the markets have so far taken them at face value.
Mark, the US was a developing market in 1929. I think adjusting for volatility makes sense, and so the drop and rise of the Dow will be less in percentage terms.
Dow 1926 lows to 1929 = 181% (Volatility ~ 20%)
Nasdaq 2011 lows to 2014 = 109% (Volatility ~ 14%)
This calculation is based on a steadfast assumption that Nasdaq topped in 2014 John.
A more pertinent calculation, I think, will be to compare the 3 years running up to late 2015/early 2016. What will the % increase and volatility be then? They could easily be higher than 181% and 20%…
Yes, that is certainly possible, although my belief is that a developed market (US today) will be less volatile than a developing market (US in 1929). My point is that the mania is beyond the broad indices this time around, since the US economy is more diversified. But there is no definitive way to prove it until after the fact.
For example, PetroChina in Shanghai is 71% premium in Shanghai vs Hong Kong. This is on par with the Delta/Priceline craziness in 2000. But PetroChina is a $327bn company, the mania exceeds that of 2000. How can arbitrage not work for one of the largest companies in the world?
So the return percentage for broad indices is less than 1929 or 2000, but internals are more crazy by some other measures. There is no way to be sure one way or the other.
I think the ramp up is with the Central Banks and QE, not so much reflected in stock prices. Crash could be just as bad because of the underlying bubble.
I love this!….it’s not even halfway through January but this will be the quote of the year!!!
“The biggest bubble out there is central bank credibility. If Draghi was a stock he’d be on a P/E of 200!”
I luvit!!!
Hehehehehe!! Nice one Allan and whoever said it.
Hi all ! Biotechs holding strong. It means new highs in all major stock averages shortly.
My reasearch predicts big central bank buying during 2015, so it should be another excellent year.
Nicolas, please may I ask how do you do ‘research’ on how much Central Banks will buy? Do you ring them up and ask them? There doesn’t appear to be any other way that I can think of.
Nicolas! Good to hear from you, buddy… 🙂
I was actually starting to wonder where you’ve gone off to…
I missed your research…. 🙂
My “research” said today was going to be another excellent day….
And it is!! 😉
Welcome back, Nicolas. Your analysis is supported by the “bullish 18” Oct of Year 4 to Mar of Year 6 having been the best months of the entire decade historically.
the older i get the more i realize that good laughs are a rare commodity
you can’t decide where they are going to come from
just take em for all their worth wherever you find them
Specie ALL GOOD LAUGHS are the cream!! I, like you, am learning that late in life.
My two cents …. 2015 on Dec 31 will close positive relative to end of 2014. However, this year will feature at least two maybe three volatile sell-offs and recoveries that will leave many investors and traders confused as to the direction and trend. There will also likely be a more severe correction greater than 10% this year too. In fact, I believe there will be one -8% to -10% correction early this year (before spring) and then a -12% to -16% correction later in the year (possibly around autumn).
The thesis that I am working around is that the bull market in bonds ends later this year, but a mini bubble forms leading up to it that likely ends in a collapse. The exit of funds out of bonds will find its way into US equities and propel that market into the next near term bubble. Then equities will eventually collapse too but not after a run up to unprecedented levels.
Steve T good to see you back here. So this time you are not going on fractals but on fundamentals? That is OK TOO.
I still think your uncanny ability to match fractals is your real strength but if fundamental is what you want to go with then I’ll ride along with you…..if you don’t mind.
Your calls have always been prescient and I’m hoping the next lot will be too.
Thanks very much for posting.
Your scenario mirrors Armstrongs at this point. There is also the potential of a cycle inversion, which will correct the markets into the fall. Based on current US valuations, this would support capital flow back into stocks as the bond markets implode. Sideways to down is the only way stocks can rise possibly parabolic until the final market collapse into 2020.
Still no crash.
Walmart long and strong, booking profits on the way up.
“The caveat for this is that solar models are correct and the smoothed solar max is behind us.”
What does it mean if it’s NOT behind us? Article is good John, I just wish we didn’t have to have such uncertainties.
Then the speculative peak is still ahead, assets make new highs, negative divergences either persist even longer or are reset to neutral, etc. But, if we look across multiple solar models, and then cross-reference with market action and market indicators, I rate the probability that the smoothed max is not behind us as very slim.
wxguru, I’m bemused by your comment. If you don’t want uncertainties then you should definitely not be in the market.
Don’t we ALWAYS have such uncertainties?? It’s the nature of the game, I’m afraid.
AAPL now clearly in a developing down trend.
http://stockcharts.com/h-sc/ui?s=AAPL&p=D&b=5&g=0&id=p07501764249
Gold is currently breaking the neckline of its inverse H and S. Target is $1350
Well done Mr Armstrong for scaring the crap out of gold investors at what could well turn out to be THE bottom! Was it mission accomplished?
http://stockcharts.com/h-sc/ui?s=$GOLD&p=D&b=5&g=0&id=p35551000307
And $1350 is just the initial target. Watch what happens when this trade unfolds
http://stockcharts.com/h-sc/ui?s=$USD&p=W&b=5&g=0&id=p42302539149
Sorry posting “on the run”. That should be unwind not unfold.
USD sentiment the most extreme ever recorded. It is going to be a blood bath!
A great synopsis of how markets today think about CBs by Ben Hunt:
We’ve entered a new phase in the Golden Age of the Central Banker – the cult phase, to use the anthropological lingo. We pray for extraordinary monetary policy accommodation as a sign of our Central Bankers’ love, not because we think the policy will do much of anything to solve our real-world economic problems, but because their favor gives us confidence to stay in the market.
I mean … does anyone really think that the problem with the Italian economy is that interest rates aren’t low enough? Gosh, if only ECB intervention could get the Italian 10-yr bond down to 1.75% from the current 1.85%, why then we’d be off to the races! Really?
But God forbid that Mario Draghi doesn’t (finally) put his money where his mouth is and announce a trillion euro sovereign debt purchase plan. That would be a disaster, says Mr. Market. Why? Not because the absence of a debt purchase plan would be terriblefor the real economy. That’s not a big deal one way or another. It would be a disaster because it would mean that the Central Bank gods are no longer responding to our prayers. The faith-based system that underpins current financial asset price levels would take a body blow. And that would indeed be a disaster.
Ever since wrinkly crinkley Greenspan, the CB’s have had their eye on the ‘God’ title.
Now that they have their faith followers, they and their followers are going to find out that ‘miracles’ are not in their repertoire.
I just returned from a trip to NYC and Wall Street. It kind of felt like a monetary pilgrimage.
ES and $/Y disagreeing again this am by over 100bps which is unusual. Cannot both be right. $/Y has back tested declining triangle break out with target 116.5.
looks like Yen is winning – that would make it 2:0
If this were a stock, would you buy it? http://stockcharts.com/h-sc/ui?s=%24JPYUSD
Second chance right now. Waterfall anytime now.
September 2008 just before the waterfalls Crude oil had a 40% 3 day short covering rally – if it starts to do the same here your call will be confirmed.
http://www.tradingeconomics.com/commodity/crude-oil
Pegasus by then we were nearly half way to retracing from 2002 low. Right now we are near ATHs.
Not saying it can’t happen, just pointing out that the timing is different.
Dance around the 50 day moving average is not a good sign if it then breaks down. Eg 1987.
Interesting explosion in the markets today. Getting annoying to see these huge retraces after we get any sort of decent falls. Looking at the FTSE compared to the DAX and DOW i feel this rally will be short lived.
More signs of a increasingly unstable market.
LMAO. It now obvious that the average Wall Street investir is about as sophisticated as a dung beetle.
Alcoa has laid off how many staff globally in the last 12 months? If it had not been for that fact along with the lower oil price rheir profits would be sunk. However the Street isn’t rallying on the result, it is rallying on the perceptiin tjat “all is well”…….and it quite clearly ain’t well……in fact it is bad and getting worse.
Let’s see how long it takes them to wake up?
If John is right, only about 6 weeks to wake up.
Credit induced anaesthetic takes a while to wear off.
Allan,
Why call the market stupid or call individual investors stupid? The name of the game is making money. I would say that the dip buyers understand that. They are the ones making money, so I would say that the joke is on those of us who sit here and pontificate about how stupid they are. Meanwhile they are laughing all the way to the bank.
did janet trip and fall?
I don’t know but if these markets close red it won’t only be really bearish candles but really bearish looking chart patterns and oscillators.
ES has caught up to $/Y – no back in sync
should read now not no
what a reversal in Biotech – on my book it has hit the trend line from 2009/10 this am.
somebody is selling copper – losing support at 2.70 – next area of support at 2.40 – another sign of global slow-down (China).
German court decision on QE tomorrow. Perhaps Nicolas knows which way it’ll go?
Hi Gary ! Well, my opinion is that even if the German court says no to QE, the ECB will do it secretly.
So far it hasn’t paid off to bet against you and your CB friends 🙂
TLT new all time high over 132
with pullbacks along the way my target is now 163
At an EW level the action from Friday through to today is a classic flat correction to the Jan 6th to Jan 9th up wave. It unfortunately almost guarantees a new ATH.
Purvez, what would “disqualify” the pattern?
Anything below the 6th Jan low would be DEFINITIVE for my call. However I try to work on much shorter ‘stop out’ points so currently anything lower than today’s low would make me want to stop and think again.
Good question by the way Gary. My apologies I should always include an invalidation point in my ‘prognosis’. I’ll try and do that from now on.
Well then Nicolas, the more intresting it will get these next days because we topped just in line with a cycle straight from the 1987 top and the similarities after the current high made in december are quite striking. Sit tight John.
If Nicolas could please comment on the recent strength in the GDX and GDXJ. Does he think that this is temporary?
Another yo-yo in SPX, though we should keep an eye on the financials (XLF) which have been the weak link since December and closest to breaking its Dec 2014 swing point / H&S neckline:
VIX also on cusp of breaking a mega wedge on the upside, and the real panic selling would only start once we do that.
Thanks all, new post is out