

The bounce yesterday in equities arrived at an appropriate point when stock indices are cross-referenced technically: channel support on the SP500 and key horizontal support on the Russell 2000:


Plus rising support on the Hang Seng – which has generated what could be a fake-out above the long term wedge followed by a breakdown (if it can break): So can all these indices break down, or are we to see another dip-buying v-correction?

Source: Stockcharts
On the above chart a positive RSI divergence was a reliable signal for a v-correction bottom. We do not have that yet, which suggests there should be another leg down of selling, even if shallow, where momentum wanes, if this were to be another v-bounce. This period into next Wednesday’s full moon is the likely window for this additional selling to occur.
However, beyond the prospects of a slightly lower low ahead, could this be the correction that does not produce another V above the 200MA, but forms a ‘true’ correction? I believe the clues are in what’s different this time compared to the previous corrections:
Breadth has made a lower low on the SP500 this time:

Breadth deterioration is notable on the Dow since the last peak, plus Vix divergence:
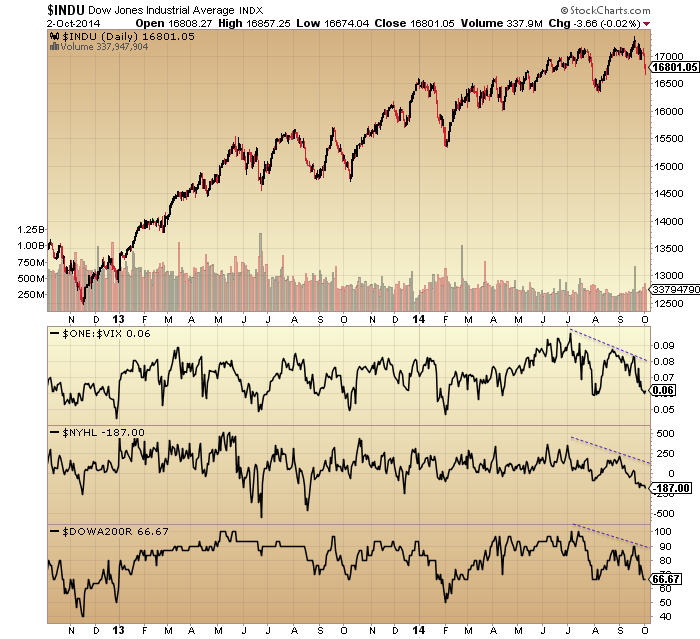
Nasdaq breadth has deteriorated sharply since the last correction:
 The bubble-end flagged strongly on technology at the latest peak:
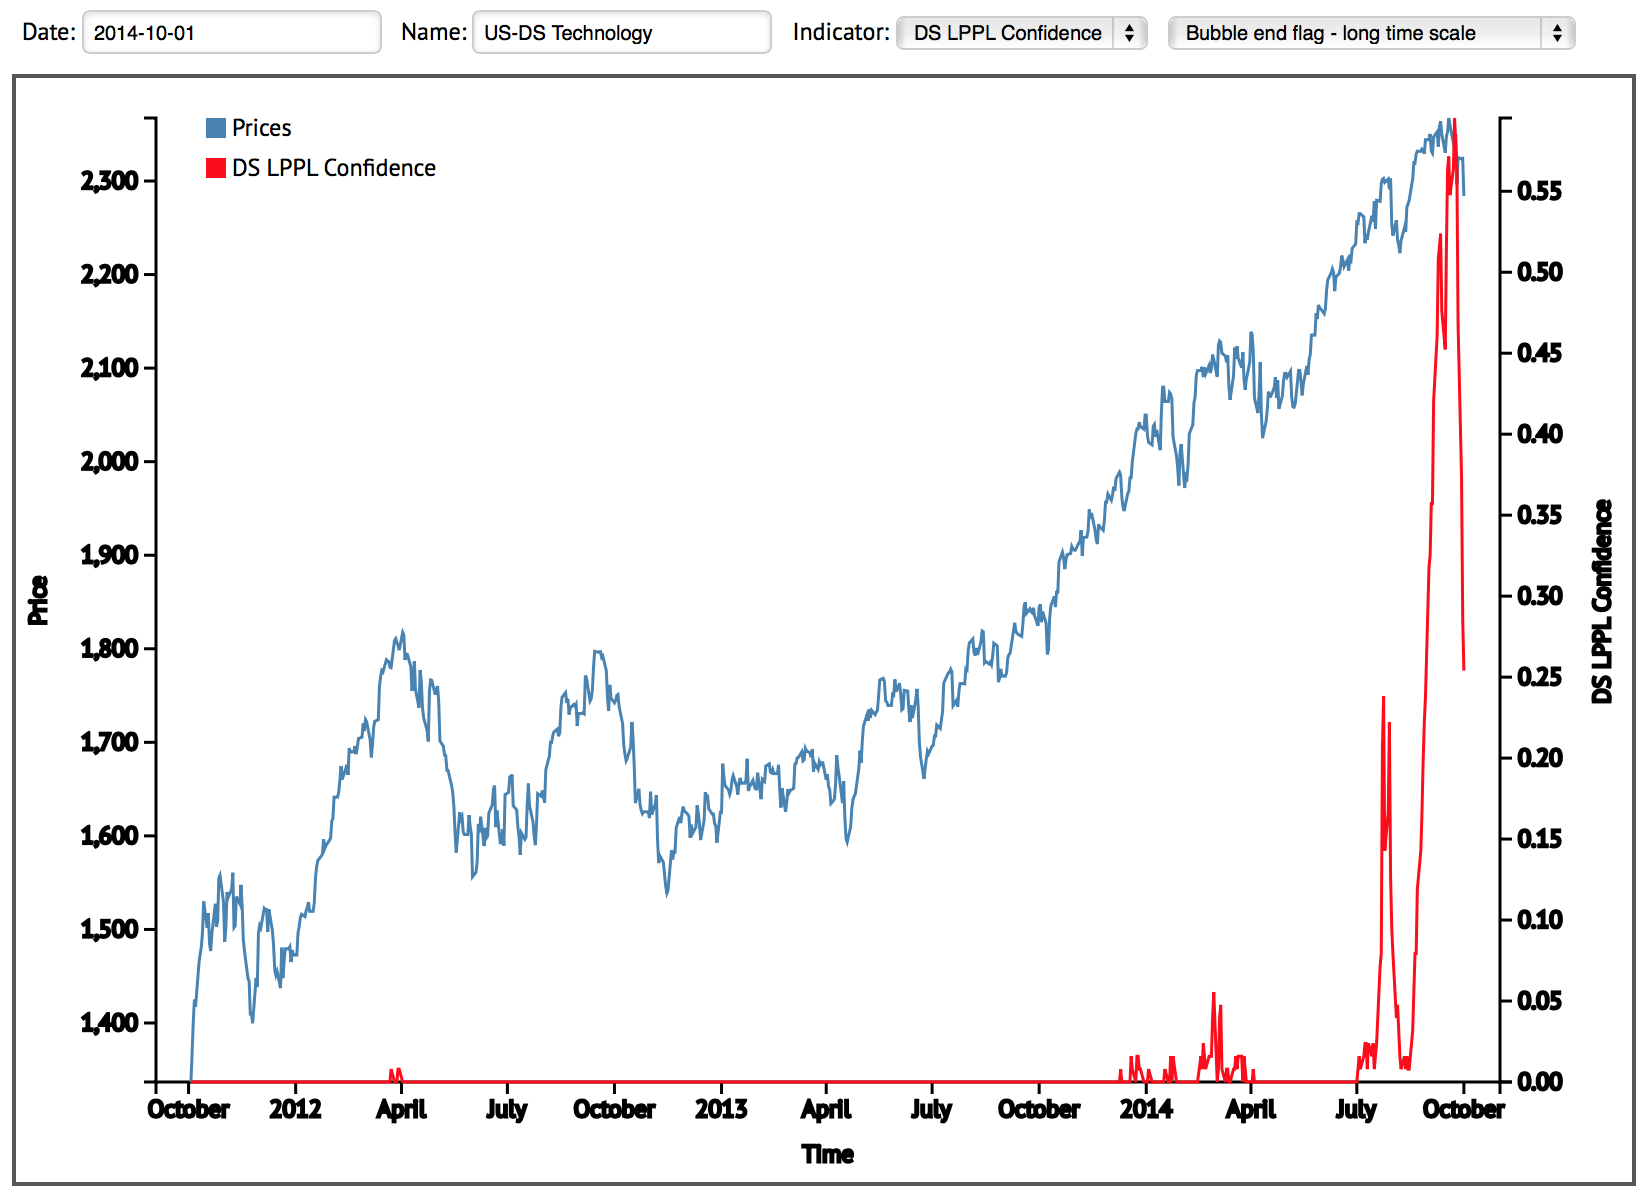
Source: Sornette
Junk bonds double-topped at the last peak and have since made a lower low:

Recent deterioration in stock market internals has been a global phenomenon:


Source: GaveKal Kapital
The disconnect between global GDP trends and global stocks reached its greatest in the last couple of months:
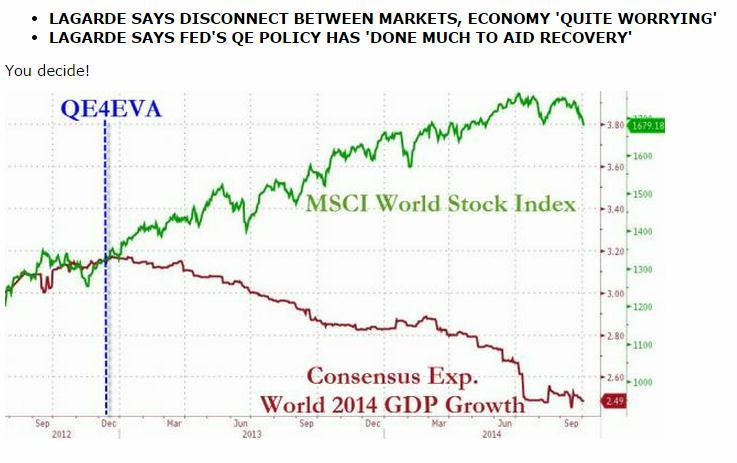 Source: Zero Hedge
And inflation expectations have dropped to the lowest since the 2011 bottom:

Source: Sober Look
By yesterday’s bounce in equities, NAAIM exposure had pretty well washed out, whilst conversely Investors Intelligence bears remain extreme at 15%. Put-call had reached a suitable extreme for a bounce whilst exhaustion signals are still largely absent. So, some case for a longer bounce here, and some case for the markets to continue downwards. However, note that the extremes in II, Rydex and Skew and the lack of fear spike in the Vix are at this point very mature and at every correction the odds increase that we see the true breakdown.
If we tie in the worst seasonal geomagnetic month of October, an earnings season beginning next week that should cement the disconnect between reality and valuations/projections, the ‘borrowed time’ clues post-solar-maximum (circa March), and the extreme positioning in gold and silver (which I believe are ripe for a short squeeze as/if stocks fall through support), then the case grows for this being the correction that becomes the breakdown.

Source: Market Anthropology
To sum up, there has been a broad deterioration over the last 3 months that suggests this should be it: namely, the correction that becomes the breakdown. Stocks bounced yesterday at necessary levels to prevent such a breakdown, but drawing on the historical analogs any attempted rally out of that should be quickly reversed by the bears. The lack of positive divergence at yesterday’s low suggests there should be a lower low ahead, which could then provide the technical break for a much more voluminous sell-off. At that point (the dawning of this being the dip that isn’t bought), I expect precious metals to finally take off, creating a sharp short-squeeze in gold and silver.

Check out the narrow leadership in the Nasdaq. 5 of the 6 largest almost all of the YTD return. AAPL, INTC, MSFT, FB, GILD running the show. Market being run by 5 stocks.
And I expect the Dow 30 to lead generally over the coming 12-16 months. This trend has been intensifying for the past couple of years…. big money flowing into the largest, most liquid stocks which also tend to be the better and most reliable dividend payers. In an era of low interest rates, or negative interest rates, not to mention currency readjustment, I see this trend continuing strongly, Cc.
Which sort of brings up the idea of the “Nifty Fifty” back in the day –
http://finance.yahoo.com/blogs/the-exchange/the-new-nifty-fifty-stocks-141801990.html
Jonathan, the tension I see in your argument is that as money leaves other countries for the U.S., one would assume it will have a negative effect on economic activity in those countries. Given how much the multinationals derive in earnings from those same countries, you might posit their profits would be negatively affected as a consequence (unlike the Nifty Fifty in the 60’s/70’s, when companies’ operations were far less global).
Since as we’ve seen reverting profit margins have historically been negative for stocks, it’s assuming an anomaly these stocks would continue to advance if my scenario is accurate.
Gary,
I think I answered this somewhere else in the past. But take a look at this. I have put a post together for this site but the formatting is awful. I’ll see what I can do.
http://www.businessinsider.com/myth-stronger-dollar-stocks-2014-9
Looking back, the S&P 500 returns are virtually unaffected by what the Dollar does. Historically, stocks haven’t really sunk on a weak Dollar or soared on a strong one. However there are certain industries that tend to suffer as the Greenback strengthens. Energy and commodity companies are the biggest losers such as mining and oil as well as consumer packaging companies who rely on oil too. A strong Dollar is bad for commodities as it makes them more expensive.
Some multinational companies suffer too as they are prone to missing earnings estimates as the Dollar rises thus affecting their foreign earnings. Coca-Cola and Philip Morris suffered in this last quarter – Q3 – mainly due to Euro and Sterling degradation, not to mention the emerging economies. The US companies with the highest international exposure tend to be those in the energy, consumer staple and technology sectors.
On the other hand, utility companies and healthcare tend to outperform in times of a strong Dollar. There are other advantages to a stronger dollar. A strong dollar means elevated purchasing power for consumers because it suppresses the cost of imports. The strong dollar also forces export-driven companies to become more efficient and find other ways to lower costs, potentially benefiting shareholders along the way. A strong currency can also be a means of attracting more foreign investment. And it is this latter I believe we are starting to see as the rest of the world slip further and further into deflation.
It’s the big questions that remains to be answered,
is this finally it.
Yep. Phil as is always the case at major tops investors ignore the continuing detioriating market internals, whilst on every bounce of weakness they are quick to pronounce new highs will soon be with us.
Investors have completely forgotten what really matters and can only see higher prices because that is what they have been conditioned to think adter years of BTD.
This market is done, small caps have broken down, more stocks are making new 52 weeks lows by the week, earnings have peaked, European indices are teetering on the edge, global GDP is falling faster than a anvil in a Road Runner cartoon and investors are as complacent as ever.
This will be nothing but a very short term bounce that smart money will sell into.
Cheers
Seriously folks.
This:
http://stockcharts.com/h-sc/ui?s=$FTSE&p=W&b=5&g=0&id=p20089937585
and this:
http://stockcharts.com/h-sc/ui?s=$RUT&p=W&b=5&g=0&id=p50927949203
and this:
http://stockcharts.com/h-sc/ui?s=$NYSE&p=W&b=5&g=0&id=p74465589377
and this:
http://stockcharts.com/h-sc/ui?s=$DAX&p=W&b=5&g=0&id=p72022816365
and this:
http://stockcharts.com/h-sc/ui?s=$NIKK&p=W&b=5&g=0&id=p72909542901
The above are some of the ugliest looking charts you could ever set eyes upon and there are literally dozens of them that include just about every major global index and major global corporation.
The crash has already begun.
Thank you John, Great detail ,
Ta
John thanks again for another succinctly presented set of facts. The one the pops out for me is ‘no positive divergence…yet’.
I guess we haven’t got long to go to find out.
Jonathan, are you suggesting that the Dow will hold up even IF the S&P folds or will it just fall at a slower pace?
No purvez, I’m suggesting the Dow will lead. The NASDAQ was the leader back in 2000/2001 whereas I see the Dow being the leader this time. All markets will rise across the world in general but the Dow, followed by the S&P 500, to lead. US Dollar denominated, dividends superior to global interest rates, capital held outside of international banking systems thus effectively hidden, and the general security/safety blanket offered by the United States / stability of government.
Thx Jonathan.
The capital flight to the United States has already started purvez. The real estate market is taking off. Take a look at these:
“For Mr. Kumar and other affluent Indians, American real estate is a security blanket. Faced with what some have considered a bubble in real estate prices in major Indian cities and a sometimes jittery Bombay Stock Exchange, they are joining a wave of buyers from other countries who see the recovering United States housing market as one of the best places to put their money these days.
The wealthy elite from China, Latin America and elsewhere have bought pieds-à-terre in glassy towers in Manhattan, luxury condos in Miami and homes along the West Coast. Law enforcement investigations have found that some foreign investors are using American real estate holdings, at least in part, to hide cash and other assets from authorities in their home country.”
Read more here….. http://www.nytimes.com/2014/10/02/business/owning-a-piece-of-america.html?_r=0
Norway jumps to No. 2 Foreign buyer of U.S. Real Estate:
http://www.bloomberg.com/news/2014-09-23/norway-jumps-to-no-2-foreign-buyer-of-u-s-real-estate.html
Russia and China gobbling up apartments like Pacman enroute to a power pellet. But one of the biggest supporters of real estate pricing these days is the Chinese buyer:
http://www.forbes.com/sites/kenrapoza/2014/07/10/these-are-the-foreigners-buying-up-american-real-estate/
Follow the Money: A Reporter Tracks Indian Real Estate Investments in the U.S.:
http://www.nytimes.com/times-insider/2014/10/02/follow-the-money-a-reporter-tracks-indian-real-estate-investments/
Overseas buyers scooped up $92.2 billion of U.S. real estate last year, driven mainly by wealthy Chinese looking for a safe haven for their families and fortunes:
http://www.cnbc.com/id/101819144
Jonathan, thanks for your response but my thesis is not dollar dependent. It’s based on your idea that monies will flow to the U.S. and my question back to you as to how that might affect economic activity in the nations from which the money is departing. (If the money is coming from the 1% and those are the ones doing the spending for the most part in those economies, well, then…).
Which in turn, may negatively affect earnings for the multinationals that do business in those respective countries.
Then we are sitting on other sides of the fence here Gary. My thesis is 100% Dollar-centred as you know. I have not really considered fully what the consequences are for the countries where capital is fleeing.
Most of the money will be ‘smart’ money…. the multinationals, sovereign wealth funds, the rich, etc. But clearly the effects will be abysmal. Bank runs will lead to collapses, social unrest is bound to ensue. It doesn’t really bare thinking about to be honest. But I’m not looking that far forward. That will come. And I think goldbugs, at that point, will see their gold and silver rise quite considerably. As well as other properties.
You have to remember that in the West, many own their own homes and these will also appreciate massively in line with the stock markets. They are tangible assets after all. People will retain wealth but currencies will get truly bombed.
As of your last point, I have nothing else to add. It’s not relevant for now. Earning are bound to be affected but my thesis is based on a stock market bubble. Bubbles don’t focus on earnings. They focus on concentrations / safe havens / hysteria. In 2001, none of the NASDAQ companies were even making any money! Look at now, they are some of the most profitable in the world. Technology companies operating overseas are usually some of the worst performers during Dollar Bull markets but I suspect the stampedes will be concentrating on something as frivolous as ‘earnings’. Did they in 2000/2001, after all?
I wish to reiterate my point. I’m suggesting we are heading into a ‘bubble’. I’m not forecasting a rise on earnings. It’s all about capital flight and safety.
Excellent piece of art John.
Like Mark Cook said it in one of his interviews…
You can step on the gas but the engine is running out of fuel
Each time the market moves up you have more sellers there’s no tick…so that has to lead to much lower prices…
I think today a litlle rally is possible if the Yob report is right but later on selling will kick in..
Monday,Tuesday and maby wednesday down my price target for the SP500 is the spring low 1815…
Thanks
If I were long, which I am not, I would be a huge seller if this gets to 1980.
http://stockcharts.com/h-sc/ui?s=$SPX&p=D&b=5&g=0&id=p55394940613
I’ve been wanting to write something on here for a couple of weeks now which explores the implications of this US Dollar bull market which is clearly taking shape. I have been a follower of John since his Amalgamator days and I can honestly say that John has been the one key factor which has led to investment success over the past three years. To John, I am incredibly grateful and this site, and his former one, have been among my top 5 daily reads since 2011. Across all my devices and workstation.
Now then, being based in Saudi Arabia, and working all hours known to man, my weekends start on Friday so this is a key day for me to contribute to this board. I simply don’t have much time during the rest of the week. But I do want to discuss the Dollar case in a little more depth as short random comments during the week can come across as being a little undermining and rocking the boat, so to speak, to other contributors and readers. So here goes.
The one thing I would like to start with is that I firmly believe we are seeing the rise of the Dollar. We’re in the beginning stages of a Dollar bull market and I’m not going to explain why as I have done it in previous posts. But I would like to address some common misconceptions about a strong Dollar, the implications for the markets, and we should perhaps be taking it a little more seriously as it could fundamentally change the economic environment for the next 2-3 years. John’s writing is, and always has been exceptional and I think I speak for everyone here. He has put together a multi-faceted argument pointing to an imminent decline in stock markets. I cannot argue with his case whatsoever. What I’d like to do, quite simply, is put across the US Dollar argument as an additional criteria to the 30 or so variables he uses to forecast future direction and events.
The most important thing to consider is that it is already up 8% against other major currencies in the last three months and this ascent could easily continue. US dollar bull markets tend to be prolonged affairs lasting for years with an average gain of 30%. This is why I believe we’ll see the Euro go to parity against the Dollar and we’ll see Pound Sterling fall between 30-50% in total. The first Dollar bull took place from 1978 till 1985 and the second one took place from 1993 till 2001. So they can last for years. For more information, see below.
Click to access Magnus_US_dollar_bull_market.pdf
Immediately, people understand a strong Dollar equates to cheap overseas holidays for Americans but it can be a mixed bag for the stock market. But before I go any further, a strong Dollar does not kill off the stock markets. I want to make that clear from the start. If anything, it tends to do the opposite. That is, fuel the markets. The first Dollar bull market (78-85) equated to sideways-to-upward moving markets, whereas the second one (93-01) equated to the greatest market rise of them all into 2001. On this basis, it is not wise to argue a strong Dollar being a stock market negative.
http://stockcharts.com/freecharts/historical/djia1900.html
Looking back, the S&P 500 returns are virtually unaffected by what the Dollar does. Historically, stocks haven’t really sunk on a weak Dollar or soared on a strong one. However there are certain industries that tend to suffer as the Greenback strengthens. Energy and commodity companies are the biggest losers such as mining and oil as well as consumer packaging companies who rely on oil too. A strong Dollar is bad for commodities as it makes them more expensive.
Some multinational companies suffer too as they are prone to missing earnings estimates as the Dollar rises thus affecting their foreign earnings. Coca-Cola and Philip Morris suffered in this last quarter – Q3 – mainly due to Euro and Sterling degradation, not to mention the emerging economies. The US companies with the highest international exposure tend to be those in the energy, consumer staple and technology sectors.
On the other hand, utility companies and healthcare tend to outperform in times of a strong Dollar. There are other advantages to a stronger dollar. A strong dollar means elevated purchasing power for consumers because it suppresses the cost of imports. The strong dollar also forces export-driven companies to become more efficient and find other ways to lower costs, potentially benefiting shareholders along the way. A strong currency can also be a means of attracting more foreign investment. And it is this latter I believe we are starting to see as the rest of the world slip further and further into deflation.
I had been holding precious metals for the past 18 months but I dumped them last month once I started to see what was transpiring. Many argue we are near the bottom but I think the washout is still to come. I am convinced all commodities will get battered into the end of 2016. Russia is preparing for $60 oil, as are the Saudis here and I think we’ll see the gold: silver ratio shoot to well over 100:1. Gold falling to the $650-800 range and silver falling to approximately $10 simply is not inconceivable. The demand for gold from countries like China, India etc. is simply cultural as there has been a distinct lack of trust in government since time began, inadequate social welfare to take care of the elderly etc. The fact is that the metals are despised in the West and this hatred hasn’t played out yet. The Dollar, I suggest, will be the safe heaven play for the next 2-3 years.
Gold and silver will have their day but I am certain right now is too soon. The only safe haven will be the Greenback as it’s the only financial instrument anywhere in the world capable of accommodating trillions of Dollars of reserves as countries, governments, central banks and multinational corporations seek safe havens. The gold market is simply too small, it doesn’t produce income and its costs money to hold. We are on the precipice of a sovereign debt crisis which now even Christine Lagarde is having to admit. See this recent interview below. In a nutshell, Lagarde states the following:
• The IMF is watching markets with a lot of hesitation and monitoring buoyant markets, weak economies.
• The U.S. is clearly one of the bright spots, although needs to invest in infrastructure
• World seeing FX readjustment tied to economies.
• Dollar, Euro adjusting to relative Growth rates.
http://www.marketoracle.co.uk/Article47581.html
Back to the stronger Dollar case, RBC Capital’s Jonathan Golub wrote: “Conventional wisdom holds that a stronger exchange rate is likely to be a headwind for stocks as US products become less competitive abroad. Our research suggests this is not the case: (1) the economy and the dollar tend to move in tandem, which means that a stronger economy should result in dollar strength; (2) a rising dollar is supportive of higher multiples.” See more in the link below.
http://www.businessinsider.com/myth-stronger-dollar-stocks-2014-9
The question is whether we believe we are on the onset of a Dollar bull market or not. If we are, it’s largely neutral to positive for stocks looking back in history but when we consider the deflationary environment we find ourselves slipping into, it bodes for a likely capital flight situation. A capital flight episode we haven’t seen since the Great Depression when US stock markets took off.
A stock market bubble is my 2nd play. I’m short Sterling, South African Rand and the Euro to the Dollar. I expect to hold these positions for at least 12 months, and showing healthy profits up to this point already. The $64m question surrounds that of US stock markets. Do they sink at this point or do they take off as international capital arrives in the USA. The real estate market in the USA is starting to take off in key metropolitan areas and it is seen as a security blanket by foreign buyers. This momentum is gathering momentum, following what has gone on in Dubai, Singapore and London over the past three years….
“For Mr. Kumar and other affluent Indians, American real estate is a security blanket. Faced with what some have considered a bubble in real estate prices in major Indian cities and a sometimes jittery Bombay Stock Exchange, they are joining a wave of buyers from other countries who see the recovering United States housing market as one of the best places to put their money these days.
The wealthy elite from China, Latin America and elsewhere have bought pieds-à-terre in glassy towers in Manhattan, luxury condos in Miami and homes along the West Coast. Law enforcement investigations have found that some foreign investors are using American real estate holdings, at least in part, to hide cash and other assets from authorities in their home country.”
Read more here….. http://www.nytimes.com/2014/10/02/business/owning-a-piece-of-america.html?_r=0
Norway jumps to No. 2 Foreign buyer of U.S. Real Estate:
http://www.bloomberg.com/news/2014-09-23/norway-jumps-to-no-2-foreign-buyer-of-u-s-real-estate.html
Russia and China gobbling up apartments like Pacman enroute to a power pellet. But one of the biggest supporters of real estate pricing these days is the Chinese buyer:
http://www.forbes.com/sites/kenrapoza/2014/07/10/these-are-the-foreigners-buying-up-american-real-estate/
Follow the Money: A Reporter Tracks Indian Real Estate Investments in the U.S.:
http://www.nytimes.com/times-insider/2014/10/02/follow-the-money-a-reporter-tracks-indian-real-estate-investments/
Overseas buyers scooped up $92.2 billion of U.S. real estate last year, driven mainly by wealthy Chinese looking for a safe haven for their families and fortunes:
http://www.cnbc.com/id/101819144
Take note folks. The Dollar is going higher.
John,
I’ve tried to post something but it requires validation on your behalf. The formatting was awful so I’ll resend it and improve the formatting.
I’ve been wanting to write something on here for a couple of weeks now which explores the implications of this US Dollar bull market which is clearly taking shape. I have been a follower of John since his Amalgamator days and I can honestly say that John has been the one key factor which has led to investment success over the past three years. To John, I am incredibly grateful and this site, and his former one, have been among my top 5 daily reads since 2011. Across all my devices and workstation.
Now then, being based in Saudi Arabia, and working all hours known to man, my weekends start on Friday so this is a key day for me to contribute to this board. I simply don’t have much time during the rest of the week. But I do want to discuss the Dollar case in a little more depth as short random comments during the week can come across as being a little undermining and rocking the boat, so to speak, to other contributors and readers. So here goes.
The one thing I would like to start with is that I firmly believe we are seeing the rise of the Dollar. We’re in the beginning stages of a Dollar bull market and I’m not going to explain why as I have done it in previous posts. But I would like to address some common misconceptions about a strong Dollar, the implications for the markets, and we should perhaps be taking it a little more seriously as it could fundamentally change the economic environment for the next 2-3 years. John’s writing is, and always has been exceptional and I think I speak for everyone here. He has put together a multi-faceted argument pointing to an imminent decline in stock markets. I cannot argue with his case whatsoever. What I’d like to do, quite simply, is put across the US Dollar argument as an additional criteria to the 30 or so variables he uses to forecast future direction and events.
The most important thing to consider is that it is already up 8% against other major currencies in the last three months and this ascent could easily continue. US dollar bull markets tend to be prolonged affairs lasting for years with an average gain of 30%. This is why I believe we’ll see the Euro go to parity against the Dollar and we’ll see Pound Sterling fall between 30-50% in total. The first Dollar bull took place from 1978 till 1985 and the second one took place from 1993 till 2001. So they can last for years. For more information, see below.
Click to access Magnus_US_dollar_bull_market.pdf
Immediately, people understand a strong Dollar equates to cheap overseas holidays for Americans but it can be a mixed bag for the stock market. But before I go any further, a strong Dollar does not kill off the stock markets. I want to make that clear from the start. If anything, it tends to do the opposite. That is, fuel the markets. The first Dollar bull market (78-85) equated to sideways-to-upward moving markets, whereas the second one (93-01) equated to the greatest market rise of them all into 2001. On this basis, it is not wise to argue a strong Dollar being a stock market negative.
http://stockcharts.com/freecharts/historical/djia1900.html
Looking back, the S&P 500 returns are virtually unaffected by what the Dollar does. Historically, stocks haven’t really sunk on a weak Dollar or soared on a strong one. However there are certain industries that tend to suffer as the Greenback strengthens. Energy and commodity companies are the biggest losers such as mining and oil as well as consumer packaging companies who rely on oil too. A strong Dollar is bad for commodities as it makes them more expensive.
Some multinational companies suffer too as they are prone to missing earnings estimates as the Dollar rises thus affecting their foreign earnings. Coca-Cola and Philip Morris suffered in this last quarter – Q3 – mainly due to Euro and Sterling degradation, not to mention the emerging economies. The US companies with the highest international exposure tend to be those in the energy, consumer staple and technology sectors.
On the other hand, utility companies and healthcare tend to outperform in times of a strong Dollar. There are other advantages to a stronger dollar. A strong dollar means elevated purchasing power for consumers because it suppresses the cost of imports. The strong dollar also forces export-driven companies to become more efficient and find other ways to lower costs, potentially benefiting shareholders along the way. A strong currency can also be a means of attracting more foreign investment. And it is this latter I believe we are starting to see as the rest of the world slip further and further into deflation.
I had been holding precious metals for the past 18 months but I dumped them last month once I started to see what was transpiring. Many argue we are near the bottom but I think the washout is still to come. I am convinced all commodities will get battered into the end of 2016. Russia is preparing for $60 oil, as are the Saudis here and I think we’ll see the gold: silver ratio shoot to well over 100:1. Gold falling to the $650-800 range and silver falling to approximately $10 simply is not inconceivable. The demand for gold from countries like China, India etc. is simply cultural as there has been a distinct lack of trust in government since time began, inadequate social welfare to take care of the elderly etc. The fact is that the metals are despised in the West and this hatred hasn’t played out yet. The Dollar, I suggest, will be the safe heaven play for the next 2-3 years.
Gold and silver will have their day but I am certain right now is too soon. The only safe haven will be the Greenback as it’s the only financial instrument anywhere in the world capable of accommodating trillions of Dollars of reserves as countries, governments, central banks and multinational corporations seek safe havens. The gold market is simply too small, it doesn’t produce income and its costs money to hold. We are on the precipice of a sovereign debt crisis which now even Christine Lagarde is having to admit. See this recent interview below. In a nutshell, Lagarde states the following:
• The IMF is watching markets with a lot of hesitation and monitoring buoyant markets, weak economies.
• The U.S. is clearly one of the bright spots, although needs to invest in infrastructure
• World seeing FX readjustment tied to economies.
• Dollar, Euro adjusting to relative Growth rates.
http://www.marketoracle.co.uk/Article47581.html
Back to the stronger Dollar case, RBC Capital’s Jonathan Golub wrote: “Conventional wisdom holds that a stronger exchange rate is likely to be a headwind for stocks as US products become less competitive abroad. Our research suggests this is not the case: (1) the economy and the dollar tend to move in tandem, which means that a stronger economy should result in dollar strength; (2) a rising dollar is supportive of higher multiples.” See more in the link below.
http://www.businessinsider.com/myth-stronger-dollar-stocks-2014-9
The question is whether we believe we are on the onset of a Dollar bull market or not. If we are, it’s largely neutral to positive for stocks looking back in history but when we consider the deflationary environment we find ourselves slipping into, it bodes for a likely capital flight situation. A capital flight episode we haven’t seen since the Great Depression when US stock markets took off.
A stock market bubble is my 2nd play. I’m short Sterling, South African Rand and the Euro to the Dollar. I expect to hold these positions for at least 12 months, and showing healthy profits up to this point already. The $64m question surrounds that of US stock markets. Do they sink at this point or do they take off as international capital arrives in the USA. The real estate market in the USA is starting to take off in key metropolitan areas and it is seen as a security blanket by foreign buyers. This momentum is gathering momentum, following what has gone on in Dubai, Singapore and London over the past three years….
“For Mr. Kumar and other affluent Indians, American real estate is a security blanket. Faced with what some have considered a bubble in real estate prices in major Indian cities and a sometimes jittery Bombay Stock Exchange, they are joining a wave of buyers from other countries who see the recovering United States housing market as one of the best places to put their money these days.
The wealthy elite from China, Latin America and elsewhere have bought pieds-à-terre in glassy towers in Manhattan, luxury condos in Miami and homes along the West Coast. Law enforcement investigations have found that some foreign investors are using American real estate holdings, at least in part, to hide cash and other assets from authorities in their home country.”
Read more here….. http://www.nytimes.com/2014/10/02/business/owning-a-piece-of-america.html?_r=0
Norway jumps to No. 2 Foreign buyer of U.S. Real Estate:
http://www.bloomberg.com/news/2014-09-23/norway-jumps-to-no-2-foreign-buyer-of-u-s-real-estate.html
Russia and China gobbling up apartments like Pacman enroute to a power pellet. But one of the biggest supporters of real estate pricing these days is the Chinese buyer:
http://www.forbes.com/sites/kenrapoza/2014/07/10/these-are-the-foreigners-buying-up-american-real-estate/
Follow the Money: A Reporter Tracks Indian Real Estate Investments in the U.S.:
http://www.nytimes.com/times-insider/2014/10/02/follow-the-money-a-reporter-tracks-indian-real-estate-investments/
Overseas buyers scooped up $92.2 billion of U.S. real estate last year, driven mainly by wealthy Chinese looking for a safe haven for their families and fortunes:
http://www.cnbc.com/id/101819144
Take note folks. The Dollar is going higher. Food for thought as in how the markets will react.
Strong bounce back on the MCX this morning,
the RUT yesterday.
This is the type of corrective action I would
expect, even if John’s call proves to be correct.
A short term rebound which is then sold off.
This is incredibly finally balanced,
bulls will not give this up easily and as many
have outlined SPX 1900 has to go before
the bearish case begins to break through.
From here it will only take one big down session
to achieve, but the last mile is always the longest
mile and this really could go either way still.
Keep an eye on the Forex markets Phil. This is what I’m warning about. The big money is coming in this month of October and next, November, from Sterling and Euro sellers. The momentum of selling is increasing.
Certainly Sterling is having another sell off today so far agains the $. Euro less so but still being sold after the massive collapse it’s already had.
Appreciated if you name other 4 website you read daily
Jonathan your views are always interesting to read
and as previously mentioned I find it very difficult to
see an end to this bull market in 2014,
have my watch list of stocks on hand.
The resilience of this market has really been the
stand out feature and any complacency on the short
side may be a major miscalculation imv.
If we have a multi day break below SPX 1900,
then the bears have this – and at the very least
a more significant correction to likely to develop.
Even this scenario does not necessarily mean
a new bear market, entirely possible to have
a sharp correction in a continuing long term
bull phase.
Yes Phil, I’ve read your posts and I’ve noted your neutral but open position here. Probably the best place to be until we see what happens. John’s writing and fact gathering is quite simply astonishing and it’s why I’ve been a follower of his site since 2011. John actually helped me make some incredible returns during the start of this bull market and I owe him a lot.
As you know, I believe the Dollar is the key here. And the dumping of deflationary currencies around the world to acquire it. I’ve been short Sterling, Euro and South African Rand (as commodities will get crushed) since July and gradually building up positions which are very large now. This is my play. My No. 1 play. But I have a strong feeling this will feed into equity markets. Look at the late 1920’s. Look at the late 90’s. This current situation has nothing to do with ’87 or ’07. The capital flight has started and is gathering pace. US markets have corrected this week and there are large volumes of Euro and Sterling sales going through this morning. Perhaps?
EURO and GBP now in free fall. Off to the United States on the back of US data.
Jonathon I enjoy reaing your posts whether I agree or not. In regard to your last paragraph
“The capital flight has started and is gathering pace. US markets have corrected this week and there are large volumes of Euro and Sterling sales going through this morning”
This is the area of contention I have with your position. Capital flight or capital chasing the highest returns?
If the latter, what hapoens when those returns go negative?
I explained this once before Allan. In Europe there are push and pull factors. Put simply, negative interest rates are the ‘push’ and the likelihood of rising interest rates are the ‘pull’. So we have bother here – flight and capital chasing. This is exceptionally powerful.
For Sterling, it’s a matter of whether you trust the UK Government. They will not raise interest rates IMO so the same applies. Capital is better off in the USA. That is where it will go. 75% of the UK’s export market is deflating Europe. If there is no demand in Europe, there is no UK economy to speak of. So I’m massively short Sterling.
And Allan, the US rates wont go negative my friend. My thoughts are these. The rise in stock markets will allow them the possibility of rising interest rates in the US only for them to be able to lower them again. But more generally than that, the US is the only economy that is really functioning at them moment. I’m not putting forward an overly complex case here. It’s the best of a bad bunch which I’ve openly said time and time again. And the US Dollar is the reserve currency of the world. It is the only financial instrument in the global economy that can facilitate the parking of reserves – be it central bank, government, or multinational capital. The Euro doesn’t come anywhere close nor does the Chinese Yuan – who would trust them?!!
The biggest threat to Europe is the banking system. It is in a horrendous state and we will learn about it in the near future. It will make Lehman, Bear Stearns et al look like unicorns and rainbows.
Thanks Jon…. good insight. I share your view, the world is deflating.
Thanks Jonathan
http://stock-market-observations.com/2014/05/27/52714-paul-desmond-on-market-tops/
Hi, Jonathan, RUT, EU mkts and EURUSD are signaling me that within 17 years cycle from 2000 have made similar structure 2007-11 (topping process) in 2014.
Even DAX, NIKKEI, RUT made 3 peaks forming the same pattern with dangerous implications.
I will not repeat the same every day, my view from here.
I said top between jul-sep´14 Dow and rebound in nov´14, don´t know if marginal highs or not, I think below.
DAX structure is pointing out a huge decline.
In best case, we are like jul´07.
In worst, in jan´08.
I have no time to explain in a better way my thesis, but I have read many times that this time is different, this time with low rates Mkts must go up.
Remember what happened in Japan from 1990.
For US is not the same case, likely for Europe.
I´m only specialyst in cycles and historical charting, I can´t add any more.
Regards.
@apanalis
Antonio,
Do you have any idee where you see a rebound in November (beginning or mid November?)
Thanks Antonio. You know I’m not really a stock market guy so I don’t really have much idea about structures, cycles etc. My day job/career is centred around foreign exchange, payments and balances so I have some knowledge here. I simply just follow the money as I don’t believe in anything other than price action and what my eyes see. What I see is a mass exodus to the Dollar. That is it. And when it has happened in the past, but combined with low or negative interest rates around the world (like now), the EU signing an Bank bail-in accord with all member states (like now) then I think most people, central bankers and company leaders would do what I’m doing. That is, getting money out of the quicksand and putting it somewhere safe. The quicker you get it to that safe place, the more likely you are to beat the hordes trying to do the same. Then enjoy the ride.
I know it’s a cliché but this time it is different. We have never experienced in the history of the world what is happening now.
¿Cómo estás amigo? ¿Cómo es San Sebastián?
Hola ,amigo. San Sebastián, la ciudad más bonita del mundo, jeje, I have just been walking in the beach with my children.
Remind EURUSD from 2008 to 2009, or 1980-82, for example.
Never experienced this before? And what about with Japan? Have a look to NIKKEI225 from 1990.
On the other hand, I distrust from macro and Central Banks, they make people change their minds for their purpuses, and cycles tend to repeat for approximation.
Un abrazo, kindest regards from Spain, Basque Country, St. Sebastian.
@apanalis
Jonathon,
“And Allan, the US rates wont go negative my friend”
That comment was in regard to stocks not rates, ie what hapoens when that huge influx of capital from Europe begins to see massive write downs as US stocks decline?
one has to consider nominal or real rates also.
Just aside, I suggest that US banks are in just as dangerous a position as European banks in fact likely more so as a whole.
The US banking system is not deflating. In fact we here in the Oil sector do not deal with European banks even if they are transacting US Dollars. US Banks only. It cuts the risk considerably. Have you read about Deutsche Banks perilous position?
Allan, I think you and I disagree on just about anything so I don’t wish to clog up this board. No offence intended but I have no idea how you could possibly think the US banking system is healthier than the European counterpart. It’s akin to comparing Real Madrid with Alloa Athletic. If you are right, I must have been on mind-bending drugs and licking windows during my time at Banco de Espana! 🙂
Sorry, I meant I don’t understand how you think the US banking system is ‘less healthy’ than the European one.
Fade the bounce … adding short SPX1957
Agreed mate.
Lehman might be a big clue 😉
They no longer exist, Allan. The US government cut the risk. That’s my point entirely. They surgically removed the cancer – Bear Stearns too. Europe bailed every single one out and now national governments are struggling to keep them afloat. I think we speak different languages after all.
Mate the US authorities did exactly zilch to cut the risk and have in fact increased the risk.
The top 5 banks are bigger than ever and their derivatives exposure is worse than ever.
We agree in one point mate, we are poles apart from agreeing on just about everything, but that’s fine. It makes me think.
Cheers
Fair do’s Allan. I’m thankful you’re on the other side here. We make the market after all. I’m not here to rub you up the wrong way – just to make you think. That’s all I’m here for too. Best of luck.
Its a travesty that taxpayers were forced to bail-out banks, and even worse that savers will be forced to bail them IN shortly.
But at the moment, one-third of all US corporate profits are “earned” by the US banks and investors have to accept that.
Gold finally broke down out of the triangle that has been forming since Sep 22nd.
This final downturn should be stopped at 1180 or even higher.
It feels like all hope for bulls is removed and this is exactly kind of psychology that creates vicious rallies. Gold to rally now but this could be corrective move only.
In my view S&P should now decline rapidly to around 1800, possibly next week . If it breaks down there, crash will ensue. If not, new highs in January/March can be expected but this will be the end of bull market.
Those bears that were not completely wiped out in last 2-3 years will take their revenge now or in few months.
my god, it’s so easy to make money in these markets. Just short GDX and GDXJ and sit back and relax. I’ve also just increased my position in IBB which should do well in the next few months.
my god it’s so easy to write the same post over and over again…lol
Nice one bbe.
volatility keeps us on track for the 1929 analog. Keep the bulls fully invested and margined up as long as possible.
It is uncannily similar to 1929. I think we are in the latter stages of 1928 actually. But same thing. And almost the same capital movements happening all over again.
European banks must be scrambling for $ right now – to your earlier comments.
It’s going to get really interesting, Pegasus. On the flip-side the strength of the Dollar will start to rip out the insides of the Eurozone as debt collateralised and issued in Dollars will become impossible to service. It’s a double-edged sword. The Dollar will eventually destroy Europe.
PART II: THE MARKET WEATHER-ENERGY COMPUTATIONS*
Object: To find three major energy curves which when applied together to Longus computations will give the Long Trend of Weather Energy plus numerous intermediate movements as applies to market actions within one day of occurrence.
Materials needed:
1. The American Ephemeris and Nautical Almanac
a. Sun (heading)
(1) Var of var. of apparent right ascension
(2) Var. of var. of apparent declination
(3) Var. of var. of radius vector of the Earth
b. Moon (heading)
(1) Phases of the Moon
(2) Longitudes to obtain 1st of Aires to 1st of Aries to obtain date spacing on base lines
(3) Var. of var. of transit of the Moon
2. Graph paper, preferably ten squares to inch.
NOTES:
Dates used will be astro dates, throughout construction of major energy curves. These curves will be denoted A, B, and C.
Base lines will be laid out using spacing obtained from Aries to Aries with standard Aries month being 8 9/32 inches
Spacing for all values of var. of var. plotting will be 3/10 inch on three ssquares of the graph (i.e. 3/10 = value 1; 6/10 = value 2.) There is a template, but for all practical purposes this scale is close enough.
Aries to Aries dates will be obtained from the longitudes of the moon. When going from 359 degrees to 1 degree, figure for 360 degrees to nearest ¼ day.
• These are the calculations shown in the book that the men worked with in order to determine market timing.
To Be Continued……
Eclectic,
A lot of meat there. Fascinating stuff, thanks. By ‘var. of var.’ I assume that is the same as the ‘variance of the variance’ of whatever is being measured, or a second order derivative. Do you see it that way?
FWIW, I had recently been looking at such a measure of ‘speed of the speed’ of a variety of celestial bodies (moon, Saturn-Uranus, sun-nodes) and saw enough positive results that it would be worth pursuing.
nicholas, when u start to think like that, the market will spank you!!
I don’t see any risk with my big short position on GDX and GDXJ. Everybody knows the miners will breakdown hard shortly. What I like is if the market goes down, the miners will follow and drop even more and if the market goes up, well, nobody needs gold so the miners will also tank. It’s like a win-win situation with extremely low risk.
You should have a very profitable couple of years Nicolas if you’re selling in US Dollars. And perhaps a fruitful year to 18 months in Pound Sterling. I wish you good fortune.
A guy named Doug Casey is taking the other side of your shorting gold stocks trade, Nicolas. Maybe you should find out who he is, if you aren’t aware already. Always good to know one’s competition.
http://www.zerohedge.com/news/2014-10-02/peak-housing-20-mark-hanson-warns-bubble-correction-could-be-doozy
US housing market stalling with foreign demand and specvestors removed. Same as 08. Sun belt should get cheap again soon. Lateral damage of a weakening housing market on the equity markets and in particular the banks should not be ignored.
Jonathan, you have written the script today.
What a $ rise and Gold being killed.
We are heading into a very volatile episode Phil as there are so many Sterling and Euro sell orders out there at the moment. But the forward orders are mounting up too and so the Dollar is really only just starting to move. Australasian currencies as well as emerging markets will get destroyed too. This will feed into the stock market at some stage if the beginnings are not today.
The Dollar index could easily rise some 30-40% in total. It has done in the past but this situation is far more serious. As for gold, I have staked my claim. It will get completely decimated from here and silver more so. Gold could go as low as $600 but $800 is my target. Silver to $10. Oil will go to at least $60, but perhaps $40 to $50 by the time this has run its course. There’s a long way to go though and nothing is nearing confirmation yet.
Just keep an eye on Sterling and Euro. The Swiss Franc is another key barometer. They are looking incredibly sick and I personally feel the former two are the potential trades of my life.
Nicholas, what if the market tanks and massive safe haven demand sky rockets gold and you cant get out of your shorts as every man and his dog is trying to escape the same huge short position
ive just started to build a position in junior gold miners 3x bull at 1035. simply cos they have been battered so much for so long and also your comments, as we know when its easy, its not
Johnathan, ive read that the industry profitability on mining silver is around $1650 how could it get to $10!!
Miners will indeed need to collapse to drive the prices higher. Prices falling to $10 will do that. Fewer miners = massively reduced supply. Thus a rebound in prices. Gold and silver will go much lower in a Dollar bull market and I predict prices 30-40% lower from here for a complete washout. We are not there yet. There are too many people obsessed and in love with gold and silver. It doesn’t smell remotely like a bottom just here. ZeroHedge reads like Fifty Shades of Grey! When all ZeroHedgers start hating it, I’ll buy it.
Great posts here, Jonathan. Thanks.
that’s profitability at today’s oil prices. If we get the kind of deflation that Jonathan is expecting (the incredible dollar rally over the past weeks is testament to that), then oil prices will drop severely. A big part of the cost picture for miners is the cost of oil, so as it goes down in prices, mining costs will also go down.
My technical work shows a barrel of oil and an ounce of silver both cresting $200. If you think we have deflation, keep your next 2 or 3 supermarket receipts (and also be sure to write down package sizes next to each item) and go back and look at them in a year. Yes, that’s what inflation looks like.
Take a look at the VIX weekly 200 MA. Resistance yet again! What a contrived bull market this is. Totally controlled. GL all.
Before all you folks celebrate the demise of gold and silver just keep in mind a few things. 1) There are bounces and in a big way 2) Armstrong noting this is a short term take down of metals…hmmm….in the same way that the June low was a short term bounce 3) Approaching maximum sigma…if not already there.
You just might be looking at a rip your face off rebound coming soon…
Alexa, the more I read MA the more I put him in the lunatic fringe. Now he is an expert on diseases as well as economics, geopyshics, geopolitics and computer science.
This man should be runnng the world, or at least he thinks so. 🙂
Allan, I think he has a lot of passion for his beliefs. That makes him wild child-like at times. But as I have said, get through the rants and the ambiguities, and one can learn a lot about the world. I like the fact that his systems are AI, and not opinion.
Alexa, don’t get me wrong he is definitely a smart man. His ECM is genius, but you know what they about genius and insanity.
Yes, this seems like an excellent trading opportunity for silver; so I’ve bought some today.
Thanks for this website, it is really fun to read it and learn about cycles and peoples opinions about market trends.
Read an interesting article by Jay Kaeppel on Optionetics yesterday who is the developer of the Known Trends Index. Based upon data history, the bullish 18 months of the decade began last friday, and will end in early 2016. Yet market seems poised for a protracted correction.
My guess is a deep correction (10 to 20%) between now and Nov 15, and then a resumption of the bull market thru next May. It will be interesting next year to see how the best year of the decade, year 5, and the 7th year of the shemitah cycle are reconciled.
I’ve been reading Caldaro’s blog regularly and your expectations are aligned with his. His tools are telling him that we’ve begun what’s like to be a 15 – 20 percent correction lasting 2 or 3 months. After that, a rally to new bull market highs. However, based on market structure, it’s likely that that rally to new all time highs will last 1 to 2 years. The caveat being that sometimes the last wave up in a bull move can fail to make new highs, may come up short, may make a double top. If that final rally does not go on to new all time highs, then it’s possible it could end in less than a year, and might dovetail into your expectation for the bull to end next May.
thanks for the reminder about Caldero. He’s stating that this is the first wave down (currently in c of Minor C I think). It should be a 5 wave structure – wave 1 was 47 pts, wave 2 was 24 pts, wave 3 (just completely yesterday) was 74 pts (about 1.618 of w1) and should end here at 1963. Then wave 5 to either 1916 or 1904 approximately. fwiw
you’re welcome.
The way I understand Caldaro’s version of EW is that he’s giving high odds that Primary IV has begun. He’s expecting it to take approx 3 months and take 15 to 25 percent off of the recent 2019 SPX high. After it bottoms, he’s then expecting a final wave up, Primary V, to take the market to new all time highs, and that will end the bull market that began in March, 2009. That final wave up, Primary V, will likely take at least a year and maybe two years.
He puts out a daily update, but his weekend updates are probably the best introduction to his current thinking. Here’s the latest one, posted just this morning:
http://caldaro.wordpress.com/2014/10/04/weekend-update-468/
dow to 17050 and then
everyone will be Kung foo fighting!
the bad lip sync is a bonus in the world of human video games!
congrats to everyone who is short gold and the miners, and who is long QQQ and IBB. Good job. What are you planning to do with all those profits ?
ayheeee WCCG for MEEEEEEE!
nick, go back to your sega system
Thank you, bbe for the video reminder. “Kung Fu” literally means “skill achieved through hard work”. It kind of reminds me of the movie Karate Kid where Mr. Miyagi teaches Daniel how to become proficient in karate through waxing cars and painting fences. Wax on wax off. Chart study, chart learn.
We are about to enter into what I would label a “death spiral” and the very near term will not be pretty and in fact will be closer to “hitten by the ugly stick” not pretty. At most maybe just +0.3% potential upside from today’s high if there is any further early morning Monday strength. But it hit the target upside range today already. I am now all-in and prepared to go broke if I am wrong.
thanks Steve T- this is forecast based on your Jan/Feb fractal? tia
Steve T we are very grateful for your insight and guidance. Please Please don’t go all in or broke….we need you!!
I’d much rather you capitulated and said…oops didn’t work than stick with it.
All the BEST with your trading.
Well I am eager to know what the next BoAML Fund manager survey reading is on the USD?
Three weeks ago it was already nearing all time extremes of bullishness. It has to be through the roof!
DEATH SPIRAL!
Steve T, can you put any numbers re your above
post?, many thanks.
17014 is the 13ema on dow so that may be it before going lower but 17050 is still target until its not
http://stockcharts.com/h-sc/ui?s=$INDU&p=D&yr=0&mn=11&dy=0&id=p08146239425&a=368645081&r=1412359883299&cmd=print
why the 17050 target and what will happen when the ED fails
Hi John, Thank you for all your diligent work, and for maintaining a nice blog.
If we look at the NDX, Dow, and SP from a strictly wave pattern perspective, unfortunately, we see the sell off from Sept. 19 in NDX, Dow, and SP is a corrective 3 legger down. This pattern is in line with a wave 4 sell off at this point. At some point in the future, ( if not right now), we will see another 5th wave impulse up. A 5th wave does have the power to make a new ATH, even tho it will sometimes truncate in a failure..
But if we look at the Rut, we see that it is showing weakness more consistent with having made a significant high. Often the Rut will top out prior to the S&P etc., creating a non-confirmation of strength. A divergence of sort. Dow theory type divergence. If the Rut continues to make lower highs while the SP continues up in 5th wave impulse fashion, that divergence would be very bearish and could give us a BIG warning of what is soon to come. Something we should be watching for.
Thanks again for all your hard work.
Kindest regards,
G.N.
Appreciated
http://carlfutia.blogspot.nl/
Here are charts of my three main trend indicators for the US stock market.
As you can see all three are well under their 50 day moving averages (green lines). If you look closely you will also see that in all three cases these 50 day averages have themselves started to decline. The prognosis now calls for a drop at least to the 200 day moving averages (red line).
The bull market which began in March of 2009 was 66 months old at last month’s top. This is an unusually long bull market, even longer that the record setting bull market of 2002-2007.
Against this backdrop we know that the Fed is about to halt the open-ended program of quantitative easing which it began in September of 2012. Today’s 5.9% unemployment rate news is the first drop below the psychologically important 6.0% level since 2007. It will reinforce the Fed’s decision to end its QE program.
This is significant because the the last two instances of the Fed ending a QE program occurred in the spring of 2010 and again in the spring of 2011. Each of these halts was followed by a big drop in stock prices.
I think the same thing is about to occur now. Should the trend indicators breach their 200 day moving averages a bear market will probably be underway.
i don’t know if anybody has posted a chart of GDOW, if not then you may want to take a look
http://stockcharts.com/h-sc/ui?s=%24gdow
confirmed double top a couple of days ago and we are in the process if retesting the neck line, if the neck line holds then things can get quite interesting and would also match some of the bottom dates some of the folks here have been posting, Oct/Nov.
So, this is positive for markets??
http://www.telegraph.co.uk/finance/comment/ambroseevans_pritchard/11137502/Mario-Draghis-QE-too-little-for-markets-too-much-for-Germany.html
I understand Jonathan’s thesis. And it makes perfect sense. But, boy, when the neighborhood’s on fire, I’m betting the last remaining house will appreciate in value?
Why not go to cash or bonds in that case, particularly when deflation is looming? In a flight to safety environment, stocks have not done well historically.
The last sentence Gary….
“Everybody wants to drive down their currency. But since Japan, China and Europe are all trying to do it at the same time, this cannot work for the whole world,” he said.”
This clearly isn’t sustainable but all that selling results in capital going one place. And that could be positive for those specific markets.
Jonathan there is a HUGE flaw in your argument. You are somehow expecting the US Markets to go ‘higher’ whilst you yourself admit that the rest of the world is heading lower.
THAT is a non-starter in my books. Good Luck.
I’m sorry but your point is a little to vague. I’m not sure I understand what you mean.
I expect global stock markets to keep rising but the US markets ones to lead. I have stated this to you directly already today. And yes, I do expect economies in general to dive, and the US economy to dive last. In fact they are all declining now. Since when do rising stock markets indicate healthy economies anyway? Was the economy healthy in the late 1920’s? But did the markets rise exponentially? I know my view is contrarian but I welcome the challenges. It helps me to consider all critiques.
Yes, it could. And I understand your play is all about time frames. i.e., what happens over the near term as wealth moves to the U.S. to escape war, devaluation, confiscation, etc. And so long as things globally don’t fall apart immediately but gradually, and the U.S. economy continues to gain traction, then people may retain the confidence to invest in equities, specifically U.S. equities / U.S. dollar.
That’s all I’m saying Gary. In a nutshell. It’s really not rocket science. Long the Dollar, long US equities. If you wanted more exposure, you could short metals. Especially the miners. They will get pummelled. I’m awaiting the mass bankruptcies in the mining sector and the m&a activity.
Trade Timeframe: 12-16 months
I have been riding short GBP/USD, EUR/USD for 4 months now selling into the rises initially. I went long USD/ZAR in August to reflect my bearishness on BRIC economies and commodities. All starting to take shape now clearly with huge mementum. I’ve just started building Dow and S&P 500 long positions.
It seems we will be seeing European pension funds seeking returns stateside just to keep the whole game alive. Pensions don’t grow in negative interest rate economies after all. The again does anything?
Trade of a lifetime underway.
wow – we may get an answer here very quick by noon…DOW is right at it’s resistance, bounce target
price might fail mightily here the last hour
Steve T., there has not been a down 4Q, of 4th year since 1920 according to:
http://www.macrotrends.net/1319/dow-jones-100-year-historical-chart
Steve S, who said anything about Q4 closing down? One step at a time, my friend …
Although 1914 was down, so maybe first decades are the exception.
Folks look past the smoke and mirrors today and study the real picture. Markets rallied today on bogus jobs data. As per data US participation rates are the lowest in decades and the majority of those jobs created were low paying.
US wages are going nowhere and this is a totally bogus recovery.
The US will not be immune, it will go down the toilet with everyone else and those foreigners that have invested bilions upon billions into US markets in recent months are going pull it all out again thus compounding their losses on all their dollar denominated assets as the dollar tumbles.
AAPL ain’t buying this rally
http://stockcharts.com/h-sc/ui?s=AAPL&p=D&b=5&g=0&id=p14153340031
I agree, but it will probably be the last country to go down the toilet
“The US will not be immune, it will go down the toilet with everyone else and those foreigners that have invested bilions upon billions into US markets in recent months are going pull it all out again thus compounding their losses on all their dollar denominated assets as the dollar tumbles.”
And invest their money where Allan? Russian Rubles? Aussie Dollar? South African Rand???
I reviewed the fractal from spring 2014 and there was a slight deviation that occurred earlier this week after Sep 26, 2014. In the spring fractal the bottom was supposed to be in on Tue Sep 30 and that would have made for a shallower near term decline and also a harder rally bounce to a higher level leading into the Oct 3/6 window.
However, the reality is that the decline took two extra days to bottom out and appears to have done so on Oct 2, 2014. The final price even exceeded lower than my extreme projection for that move. So the angles for this downtrend is much “steeper” now relative to spring 2014, yet the time frame for the major turning points (Sep 25, Oct 6) appear to be intact. What that implies is that price action is likely to continue following the fractal but the price action occurs on a more “accelerated” framework, because this current rebound dead cat bounce only has about two TDs to complete over three days (i.e. 1/2-Th, Fri, 1/2-Mon) instead of four full TDs back in the spring.
So what should you expect? The price action (both ways) moving forward will be even more extreme than what you have seen. Also prepare for a lower low than Sep 25.
Hopefully the Creator will have mercy on my gambling ways …
Steve fascinating work. Thanks
The Creator does have mercy. What always concerns me about the Creator is, I am convinced he has a twisted sense of humor that I lack.
I like your fractal analysis, kind of like Law of Vibration.
SC
Allan, it was the best of times, it was the worst of times. We are entering an absolute sweet spot of economic conditions in the USA. Every field, energy, robotics, AI, materials all poised to introduce game changing innovations. Cities located in areas where these innovations are happening are doing well and others like Detroit not at the moment. However, just like the photocopier, the fax machine, the computer, cell phones all resulted in increased revenues and profits for the companies involved the new technologies will likewise result in new revenue sources, more efficiency, etc.. I believe that 2019 will be much higher on the SPY than today, and the next decade will be 300 to 400% higher. The key is learning how to trade in and out of the market based upon chart analysis and thereby turning a modest initial investment into a substantial sum. Money doesn’t disappear so when the ex USA investors remove their money from the dollar and USA stocks, they will have to invest it somewhere, like the emerging markets. Then the USA stocks will slow, and emerging markets will move up. I see at least a few more years of USA stock price rises, and then a emerging markets move.
And Steve, who do you propose to sell all this technology to?……and yes money actually does disappear, it’s called deflation.
Allan – they could try and sell it to the 93,000,000 Americans that have left the work force but I think they are mainly broke.
Money doesn’t disappear in deflation.
But it’s velocity declines dramatically.
steve-my apologies.. but I could not let your blanket reference to Detroit pass without filling in the blanks.It is true that the vast inner city neighborhoods are wastelands.. but contrary to common belief the suburbs around Detroit are booming AND have increased in population more than the inner city has lost…My neighborhood has dozens of transplants from around the world whose corporations sent them here to take advantage of all the Detroit AREA has to offer.In a half mile radius of my home, dozens of perfectly good mansions have been torn down to build even bigger houses and I am currently taking a leave from full time market participation to in stall a wood shake and copper roof on a house that is as long as a football field and whose garage is as big as my whole house.Most of the inner city housing stock was built as cheap housing for the emigres from Europe and the american south.coming to work in auto plants. IT WAS NOT BUILT TO LAST… the neighborhoods must die.. and a new city rise from the emptiness as has happened over and over in human history…
‘
Slater, I used to live in Bloomfield Hills, MI and feel a great affinity for the area you mention.
Very well put Steve. Stock markets have seldom reflected economic reality and today is no different. But as you say, the US is in a sweet spot right here, right now. It’s a narrow window of opportunity. It is the only economy holding the economic system upright at present. Without the US, we’d be down on our knees. And one day we most likely will be but we have, and always will, survive currency and market crashes. They simply do not worry me. It’s the Mad Max, Doomsday prepper-types, hoarding their gold and silver bullion that make me feel depressed.
Jonathan,
I have been reading your posts for a while and had to respond. I have family in Europe and fully agree with you that the place is a ticking time bomb. However, I work in the U.S. and I think you are underestimating how dirty the cleanest shirt in a pile is. I work in an oil related industry and I am seeing a major slowdown. It hasn’t worked itself to 2nd and 3rd tier suppliers yet but that is just a matter of time. I see your call for oil in $60s as a disaster for the energy sector and diametrically opposed to your view that U.S. has an opportunity. In my opinion for U.S. to have this opportunity oil price can’t fall any further because it will take down the energy sector, which along with technology has been a major part of this recovery. The costs in this sector have increased substantially since 07/08 and many companies can not handle lower prices. The ensuing layoffs in parts of the country that have been doing best during the last five years would rip out a major driver of actual, non-speculative growth.
I agree with your analysis that the U.S. is in best position and will survive (even thrive once things get sorted out), but I don’t agree that we won’t get pulled under with rest of the world. The early evidence I am seeing on the ground is ugly, even worse than what I saw in 07/08. It is yet to filter through to rest of the economy and consumers though.
Thanks for the comment Steve,
We work in the same sector therefore so we do see the things going on around us. The only point I wish to comment on is your last one. I DO believe the US will get pulled under with the rest of the world. I’m not saying it won’t. The caveat being it will be the last place to go under. When all these Dollars flood back into your economy sometime over the next 12-16 months, we’ll suffer one of the largest crashes in history. The US is not immune. It will suffer and badly. Just not before anyone else. It’s all about the Dollar. It’s a parasite destroying everything else before it returns stateside to wreak havoc.
Jonathan,
Hope you see this comment since I can’t seem to reply to yours. Thanks for the clarification, your opinion makes sense. Next 12 months will certainly be interesting.
thanks Steve. It certainly will be interesting!
Steve T,
Fascinating.
I am curious. Reading your posts, it seems to me this is not the first time you skinned a fractal. Is it uncommon to be a few days late or early when a fractal occurs? And when price reacts more extreme one way, as you describe now, you have to expect more extreme movements the other way?
Peter.
Peter, a fractal is a pattern that reoccurs again, however, the exact day to day movement is not necessarily the same. It merely follows a similar pattern moving from major point A to major point B. The daily or even intraday action can be completely different as long as it somehow makes a move either up or down towards the direction of point B.
Also, when price movement amount somehow differs it is useful to compare the percentage move today relative to the past to get an idea of future moves. Maybe it only mirrors 70% of the historical move in the past fractal.
The weirdest fractal I once uncovered was last year when I was watching GDX miners quite closely. I somehow observed that it was following the chart pattern of AAPL computers when it descended into its decline below $400 pre-split and rose again from the ashes, with the twist that AAPL chart pattern was trading ahead by about six weeks to two months. In other words, AAPL was forecasting what was to occur in GDX about two months into the future in its action today. However, the close comparison only lasted for about five months before it completely diverged and probably not surprising when comparing gold stocks to a tech stock.
Steve T, fascinating post.
Many thanks for sharing your thoughts
and hopefully you will be kind enough to
keep updating.
Gold bug on this board: what is your opinion on miners today? Do you think the panic selling today on the job report news would qualify for a capitulation act? I think the capitulation phase is very close. We are due for a bounce before more selling resumes into 2015.
Hi ! Well, no. This is just a normal day for GDXJ, down 6%. Frankly, that’s a little disappointing, I expected something like -12% today. So, look for GDX and GDXJ to go down 4% or 5% everyday until the end of the year. After that, look for a couple of +0.5% days before the selling resumes, driving gold to 250$ and GDX to 3$ where it belongs.
Years ago my Zen master asked me why people would feel PAIN. …he answered that people feel pain becasue “it was not painful enough for them!”…or they would have changed their behavior or refrain from doing the thing that caused them pain.
Well, it was a valuable lesson for not keeping our finger over a fire…or perhaps we should capitulate our stubbornness to ease our mental pain. A true test of our wisdom and will.
Gold bugs (especially those late comers) are really feeling the pain these days. Good luck.
Nicolas-what you just wrote sounds like what one hears at bottoms. I would bet that gold stocks are getting close to a bottom as well as gold. If history rhymes, those shorting the gold complex at such a bottom will learn a painful lesson.
EW pattern on gold does indicate it’s near a bottom. However, I don’t believe it will turn out to be THE low. From the July high, I believe gold is nearing the end of wave 3 down. Once it completes, wave 4 will have gold prices wander around in a trading range for a while, between whatever low wave 3 gets to and as high as 1243 or so. After that, wave 5 will take gold to new lows. Wave 4 should take at least a couple of weeks, maybe several weeks.
Longer term what’s not clear to me yet is whether those 5 waves down from the July top will be the last move down in the gold bear market or whether those 5 waves will be just wave 1 of a larger pattern.
Erick – the problem for the bears is that they all think there a lots of bulls around. But the reality is that there are few if any bulls around – sentiment is at historical lows, who do the people shorting gold and the gold stocks think is left to sell? The point of the sentiment gauges is that they’re signaling everyone and his brother have already sold – that being a bear here and now is an extremely crowded trade. The dollar is overdue for a correction – the jobs data gave it a boost as well as ECB’s “QE-light not enough” reality that is breaking.
Holding support at the June and Dec 2013 lows should be the trigger for the short covering to begin. As I was just noting, I’m reading a lot of “newbie” type bear sentiment that the gold complex will keep going down forever (or back to $250). Such expectations ignore decades of economic reality.
Thank you William. I agree. If my EW count is valid, today SPX reversal has completed the wave 3 up. The coming Monday would be a start of a wave 4 down, and imv the reversal would be quite impulse. At the same time, PMs would start rallying as USD is topping.
My view is very much in line with what John has brilliantly described, that the correction is imminent, along with a major short squeeze in PMs.
Today believers were yesterday skeptics. 🙂
Erick – Call me crazy… I started with a small position in JNUG this morning. I will add if 1180 support holds or if gold breaks resistance – something like this chart:
http://tinyurl.com/ktwo9bt
Nicholas: I am glad you feel it is easy to make money in this market… More power to you. And best of luck. 🙂
William… would never call you crazy for adding JNUG… I made the same move as I think the NUGT/JNUG family is due for a bounce. We’ll see soon if the big banks decide to take gold under 1180… If so, that would be a fantastic opportunity to add more miners, at least for a short term. imho.
Allan, answer to ? one: burgeoning middle class in BRIC countries who are really interested in moving up the consumer ladder, ? two: based upon the last 100 years of history in the USA there has been constant inflation, never deflation.
Just completed a study of astronomical import:
Hypothesis: Jupiter cycle from Leo (July of 2014) to Sagit (5 years hence) is bearish for stock market. Jupiter has an approximately 12 year cycle.
Historical Leo to Sag transits:
From To DJIA returns
1919 1924 -15%
1931 1936 – 15%
1943 1948 -10%
1955 1960 20%
1967 1972 -10%
1979 1984 5%
1991 1996 60%
2002 2007 40%
Net Returns 75% over these 40 years or 1.87% year
Ludicrous? Just an intuition based upon the assumption that the leo to sag monthly moon cycle appears to be flat or down month after month.
Newt. and Nicolas, all commodities and oil are being sold at a discount right now. Just like at a dept. store they can’t discount their core inventory for too long or they will go under. Expect sooner or later this discount to end, and the miners and gld, oil, cotton, etc. will double or triple in price. My guess is next summer.
I started buying some big names in the oil sector for their (better) chances in rebounding over the metals and their miners ….when $BPENER (bullish percentage, energy) is standing at 18.18%. Oil has real economic impact/value. To me, metals is just an insurance against government policy failure.
If oil $BPENER goes to sub-10, I will buy more but I won’t touch metals and miners for now.
Well worth a read:
“The only problem with the destruction of the US Dollar premise is the US Dollar is all of a sudden the strongest currency in the world. We’ve heard these arguments many times before. Gold bugs have noted all the reasons the US Dollar was toast, yet all of a sudden the US Dollar is the one currency everyone wants to own. How about that?”
“Bull markets aren’t obvious when they start and sometimes they take a long time to notice. For me, to see books coming out talking about the destruction of the US Dollar, coupled with a major bottoming pattern taking place, this could be the start of a great bull market for the US Dollar.”
Time to think like a contrarian?
USD strength is a REALITY show in action.
Last post of the day…
Venus Retrograde Year and DJIA Returns
1986 10%
1988 0
1989 0
1991 0
1993 6
1994 5
1996 0
1997 20
1999 40
2001 -25
2002 10
2004 -6
2005 10
2007 20
2009 30
2010 30
2012 0
2013 5
Total all retros. 145% avg. 8.5%
Conclusion: Venus Retros. are bullish for DJIA, next one 6/7/2015
Retros calculated on website:
http://www.findyourfate.com/astrology/ephemeris/ephemeris.html
Steve, I very much appreciate your posts!
Can you explain how you calculate the Venus retro period as starting on June 7? Are you starting it from max elongation? If so, how do you calculate that? Using its velocity compared to that of the sun?
thanks!
Yes Steve……. Appreciated.
Slater9, I grew up in the mid west and realize that Detroit’s woes have probably been over reported or exaggerated. Minneapolis, Detroit, Cincinnati, Chicago are all very dynamic and attractive cities. I live in California, pardon me while I sip some Pinot and eat a fig, and really like it here as well. Cheers to Detroit’s glorious past and wishing a even brighter future!
Gartman blessed the dollar.
Can you say Kiss of Death
Lol
Even Gartman is right sometimes.
For gold contrarians, there’s a story about what is REAL pessimism on gold. In 1999 gold price rose sharply from $250 per troy ounce to $320 during several months. Guess what happened? A very big gold miner (sorry, I can’t recall the name clearly, but it was sold to AU at last) almost went bankruptcy because of the rising gold price. The poor guy hedged too much of his own future gold production by using gold derivatives. When gold price bursting upward sharply, the miner didn’t have enough cash for margin calls.
Today, the average all-in cost for gold miners stays around $1200 per troy ounce. Ironically, the industry standard has changed to “No Hedge” since 2009. Because most of the gold miners thought it’s stupid to hedge since gold prices would be ever rising. They had every reason to think so at that time: the whole gold mining industry had lost huge amount of money by hedging gold price from 2000 to 2009.
I guess gold price will not stop declining until at least one major gold miner go bankruptcy. So, if you really like gold, I suggest buy some gold futures or GLD. They’re much safer than gold miner stocks. Technically, supply side from miners wouldn’t have significant impact on gold price, which means the whole gold mining industry could take a rest together for a decade without causing big problem in gold market.
Yes there is a major squeeze coming in the metals. A very MAJOR squeeze and I still believe that gold will at some in the months ahead test the all time high.
And Iet me reiterate I am NOT a gold bug. I say that because I actually hate being labelled it and what it implies. I am just as happy being short as I am long.
What I do see is a complete reversal of current trends that are going to send shock waves through financial markets. Reality has been distorted beyond belief and like a beach ball being forced under water the reaction in the opposite direction when the force is removed will be equivalent.
I have never seen the amount of comlacency or risk that I am now seeing across all markets. Certainly in the past we have had one or two markets pushed to extremes, but this time it is all encompassing.
Market swings are increasing in violence and intensity and that is a warning.
This is going to be a bumpy ride and a lot of investors are going to get trapped in long and short positions, depending on the market they’re in and they are going to get their heads handed to them on a platter.
To those that think it is easy. It is NEVER easy.
Shorting Pound Sterling and Euros has been easy as the trend has been coming for months. The Dollar currencies in Australasia were also contrarian plays earlier this year as they were way over valued, and beyond economic fundamentals. The Aussie Dollar is further evidence of the coming metals washout. It hasn’t really started yet. In Australia, you will see bankruptcies across the mining sector over the next 12-18 months as China as China’s choking worsens. You are lucky being over there Allan as you will see it more vividly than any of us in other parts of the world. Keep your eyes peeled. The terrible cost of all this will be the loss of jobs.
i think most pm (silver) investors are familiar with the ongoing high open interest in silver, any thoughts what is happening there? seems to be an isolated case here, why silver? that is the main issue that is keeping me very interested in the pm market.
I’m not sure James. I’m really not sure. I was holding silver bullion until I saw the shift to US Dollars starting in August. Then I dumped the whole lot.
There may be some funny games going on in the sector but when the support level was taken out a little above $18 that was my cue to parachute. The trend continues unfortunately and I now think metals will fall for a further 18-24 months. It looks like they need to, and will, washout completely now. I’m expecting $10 dollars for silver quite honestly. There will be a time to buy but it will be when everyone hates it. There’s still too much love. We need the same amount of resentment shown to the US Dollar, in the recent past and still currently on this very board. Resentment = Rally.
For reference:
http://www.mcoscillator.com/learning_center/weekly_chart/commercials_betting_on_big_dollar_downturn/
I can’t recall who posted the nice USD/YEN chart (Pegasus?) a bit ago but if you could do so again updated, I would appreciate it.
Gary,
we are sitting on falling trend line resistance on the monthly around 110.
http://www.investing.com/currencies/usd-jpy-advanced-chart
On the weekly the pair is forming a rising wedge with a bearish overthrow currently. Tested the fall back line into the rising wedge on Thursday around 108. Once we are bellow 108 the bearish case is valid.
http://www.investing.com/currencies/usd-jpy-advanced-chart
Would expect a wild reversal in both Yen and Euro here shortly. This would tally with a positive call on the metals and commodities in general and a sharp correction for equities which was the case when the USD/Yen hit this big trend line previously (2002 and 2007).
James, Bill Holter (a gold promoter) has this theory that the huge OI is due to the Chinese. Claims they have a tradition w/silver for over 2,000 years and are the only ones on the planet with d…e…e…p pockets to withstand the billions in paper losses. Why? To accumulate more gold at cheap prices. Mind you I think Bill is sounding like a lot like someone who is sitting on big paper losses on the metals; but that’s just my opinion.
Gary, try googling ‘matrix + usd/yen.
Cheers
considering the size of OI, billions in losses indeed and still holding. i hold a small position in silver and will try my best to keep holding it until this plays out. i realize that most commodities have been hit by the rapid appreciation of the US$ but the selling of silver have been relentless. i also notice the rapid drop in Shanghai silver inventory, where are they going to get their silver when it runs out?
Bob Hoye of Institutional Advisors on Goldseek Radio you tube video says widening credit spreads between BBB bonds and US credit is widening just like 2007 and 2000. He says this is irreversible and will effect the economy and markets. His predictions:
1. USD can go a lot further higher
2. Gold and miners can go a lot lower
3. DJIA is going to go down medium to long term (2 weeks to 1 year)
4. Gold and miners may be 10 baggers starting in a few years
For gold bugs, look at a long term chart of Hecla (HL) the miner with the a record going back to the 70s. Long term it has been a losing investment, yet thru effective market timing you can make a lot. My advice, only enter when MACD 12, 29, 6 is positive, or the RSI daily 14 is above 50, exit when these fail. This simple strategy of entering on strength and exiting on weakness has great returns.
Other notes: Rises into full moons, Rises Perigee to Apogee, Rises during Merc and Venus Retros, most gains are during calendar days 10 to 20, and losses during calendar days 1 to 10, and 21 to 30, Rises into Valentines Day,
Sells off April 15 to May 2. I have lost a lot and made back some on the miners and my take away is use technical indicators such as MACD and RSI and don’t vary from their application. Right now the MACD and RSI are on sell signal, but a few large up days may change them into positive. Thanks for reading this.
Another interesting trading idea regarding GLD and the miners is a strong correlation for them to rise from about 3 weeks before Diwali and Chinese New Yr, until a day or two before. This makes sense cause there are buyers during this time, and the demand is inelastic meaning buyers will pay whatever the market price is because they have a tendency to give gold related gifts during these holidays. Also jewelers probably have a mark up that is more favorable with higher gold prices than if gold prices are lower. Diwali this year is October 23, with perigee on Monday, and FM eclipse on Wednes., maybe there will be a strong reversal in the GLD sector until the 23rd.. Perigee to Apogee cycles imo tend to favor the GLD sector.
James, good point. My understanding is that the Chinese have only about one month supply of silver. True or not; I can’t say.
I can tell you how the US equity market plays out… Credit markets which we perceive to have low default risk get smoked and equities follow. Why?
Strong dollar and weak commodity prices. We are already seeing it happen – Recently issued coal names are trading at 50c on the dollar after met coal prices collapsed. Just the tip of the iceberg IMO. Drillers, miners, E&P all will be in the same boat. As the credit markets go, so goes the equity markets.
This isn’t the breakdown. My gravitational analysis predicts a final high on nov 16th. I get this date from the tides and it coincides perfectly with the apo-peri cycles that are still up.
This week I think I solved the puzzle of the inversions. So from now on I will include this in my analysis. To give you a taste of how this looks like I’ll explain how gravity ruled the market last week.
Friday the 26th the tides gave a regular low. So the market bounced. Sunday the European tides started an inversion that ran until Oct 1. After a low the trend should be up so the inversion turned the trend down again. So European tides gave down until Wednesday. US tides were up; no inversions on Monday and Tuesday. So we had a conflict in trend, producing a consolidating market early in the week.
On Wednesday an inversion started in US tides until Thursday. So Wednesday the downtrend intensified as US tides gave down.
European tides gave a low on Wednesday and Us tides on Thursday. The low came Thursday as US markets are leading. But the strong recovery on Friday reflects the tidal inversion in Europe.
As you can see, analyzing European tides separately from US tides gives additional insights. The stunning fact is that with major turns all tides are in sync. Even the intraday timing of tides is almost identical, despite a 6 hours difference in time zone.
So what to expect now?
The European tides give down, with a regular low on Oct 10th.US tides give an inversion on Monday and the low on Wednesday. European tides start an inversion on Thursday, until the 15th. Combined this tells me we will see a top on Monday and then a nice decline into the lunar eclipse on Wednesday, for US markets. European tides start the inversion on Thursday, so European markets will bottom on Thursday.
In the week after that I have no inversions in US tides. EU tides give a regular low on oct 17th, But the inversion ends Oct 15th – producing a high. Us tides give the top Oct 17th.
So this 2nd week – starting Monday 13th – will be a strong wave up until Wednesday, a retrace down on Thursday and the top on Friday.
The week after that the trend will be down again, but within an uptrend that extends to Nov 16. As this is a Sunday the top will be on Monday 17.
Inversions are a sophisticated aspect of tidal analysis. They reflect the complex nature of gravity. But we need them to get perfect timing. I am amazed how inversions help in synchronizing European and US tides. My analysis of last week shows – at least to me – that gravity is indeed the major force that drives the markets.
I can’t stress enough the importance of choosing the right tidal stations. I had to repeat my station-selection analysis now inversions are part of the equation. And I ended up with 3 new stations. Two of them in the US and one in Europe. All are around the same latitude as Wallstreet. But now the inversions are excellent timers.
My analysis of the 18/9 year cycles hasn’t changed. My long term AP-avg trend preceded the 2009 low by weeks, and has been up ever since. It gives a major – multi-year – turn first part of December. The yearly AP trend and the 3-6 month Ap trend all turn with it. So we are on the verge of a new long term cycle down. The tides narrow down timing to mid November, within weeks of the long term AP-avg pivot.
Have a nice Sunday.
Andre thanks very much for taking the extra time to explain last weeks action with the inclusion of inversions.
Looking forward to following this during the coming week.
My pleasure.
Cheers.
One more fresh observation.
Staring at my new tides I notice that the tides follow the lunar month (29,5 days). At the start of a new lunar month all tides are in sync.
The apogee/perigee swings follow the Apogee month (26,5 days).
Every 9 lunar months these 2 are in sync (as 9 times 29,5 = 10 times 26,5).
It is clear that between October 17 and November 17 the months synchronize.
This means there must be a 9 lunar month cycle. Remember the low in Februari ?
This changes my cycle structure. The current multi AP-avg trend turned by the end of 2008 and runs until the end of 2014. That is 8 ‘9-LM’ cycles. I assume this number 8 is variable, creating the variable 4,5 year quasi cycle. Mmmm; could it be there is always a whole number of 265 day cycles (=9 LM) within the 4,5 year cycle?
265 days is 37,9 weeks. 3 times 37,9 weeks comes close to the 120 week Kress cycle.
Damn; thought I had covered everything. And now this. But can it be coincidence that the 265 day cycle ends – as signified by the LM-AM synchronicity – with extreme readings in my tidal force indicator? This idea is still warm from my brain. Anybody any thoughts?
Of course; some people say there is a 118 day/ 4 lunar period cycle. But this is just the half-cycle under the 9 LM cycle= 132 days.
The full moon cycle is 412 days. 14 265 day cycles are equal to 9 full moon cycles. this is 10,1 year, close to the 9.5 year cycle. 14+9=23. 14/23 = 0,61 = golden ratio.
The eclipse cycle =177 days.3 eclipse cycles = 531 days. 531/265,5=2.00000. This can’t be coincidental.
Andre’
Great work, I always enjoy. If you don’t have ‘Sun, Moon & Earth’ by Robin Heath, you should get. It is easy, fun read & not long. But you might find some ideas to help connect dots on synchronicity, plus other fun insights that will open up new avenues of thought. Additionally, you will come away with an appreciation for how good the ancients were at this.
I need to think a bit on your thoughts above. However, are you sure about the 26.5 day Apogee Cycle? I have thought it to be 27.2122 days (going from memory here). This is an important number in my work, and I don’t want to screw it up.
I do have a question. It appears that the purpose of Inversions is to sync cycles up. Is it you belief that there is an Inversion window at the 9 month Lunar Cycle, or are there other windows, but in any event they must occur during specific windows. (My view, without sufficient proof at this time). Also, does it make sense that if Inversions sync up cycles (so they start together), then must they also come in pairs within a larger cycle? Kind of like nodal pairs, or eclipse seasons. Thanks in advance for any thoughts.
SC
Steve,
Lots of numbers going around about the moon. The anomalistic month is 27,5 days. Still, I didn’t make up the 26,5 days; I must have read it somewhere. The key issue is that I can see in my system that tide synchronicity – indicating the start and end of a lunar month- start to synchronize with the apogee/perigee turns in October/November. This indicates some cycle must be ending and we will see a significant turn. A new cycle structure takes more than a few minutes to develop and I guess I got carried away with enthusiasm and jumped to conclusions. Still, I am certain there is something significant in this analysis.
I have just reached the point that I can see the inversions, predict them and have seen they are accurate. Now I see the inversions are perfect, I can devote some time to analyzing the inversions. Some weeks you have no inversions and some weeks you have them everyday. I just noticed that with the inversions the different tidal systems become consistent. That doesn’t mean the inversion have a purpose. There is only one moon, one sun and one earth. So it could very well be that this has to do with how tidal systems are built.
To conclude : inversions are a special subject for analysis At this moment I can’t see any structure; they just pop up seemingly random. But they time perfectly. So something is happening. And I need something to post on next Sunday 😉
And thanks for the reading suggestion.
Andre,
This is very nice work thank you very much
I live in Holland so I watch the european markets very closely and I was already surprised that the US and european markets are not so synchronistic anymore..
I m curious wich staion you use for the european tides do you have a link?
Have a nice day thank you very much..
John.
http://tides.mobilegeographics.com/locations/1849.html
thank you very much this is the one I use for fishing the Nordsee..
http://www.watersportalmanak.nl/getijdentabellen-2014/ijmuiden/10
thanks Andre. I’m finding the same inversion in the low tides for Brooklyn Bridge and Battery Park (same as Euro tidal station data) fwiw.
Nice!
André
I wonder if Elliot wave would have liked your tides
Ben,
Ralph Elliot never gave a reason for his waves. I think he saw gravitybut didn’t know it.
But that’s just me 😉
Hi Jonathan,
Any great site you can suggest for me to read and follow daily??
Thanks.
I ask the same question but John so busy to reply. So I go to his facebook , hope I can get response from John
Honestly cd, Solarcycles right here is probably my favourite site. John’s research and writing isn’t bettered anywhere. Now I know I am opposed to John’s view but only on this occasion. I’ve been with him the past 3-4 years. And I don’t completely disagree with him as his analysis is difficult to fault. The only thing I disagree about is the time-frame as I believe we have another 12 months till markets roll over, or worse still, collapse.
John’s site is great for a couple of reasons. Firstly, even though he takes a position and is currently favouring the short side, he is never 100% fixed to such an outcome as his pieces point out. This article is an example. I admire his conviction, but I admire even more, his flexibility and willingness to adapt. The second thing to note is that he has a growing number of followers and each article seems to average 150-200 comments. I use this as a sentiment reading as most are supporting the bear side and one or two of my posts have been met with assertive/frustrated criticism which give me one or two signals about over-bearishness. This really makes me think!
I’m not a stocks guy but more of a money markets trader. This is my day job. That’s why don’t think markets are turning down just yet. The money markets are the lifeblood of the global economy. Foreign exchange and the bond markets make the world go round. Without these, there simply wouldn’t be a stock market. Therefore, the signals and messaging are in the currency markets and there is a huge shift taking place, right here, right now. It cannot be argued. Look at the charts. This will have a huge effect on the stock markets and the question we have to ask ourselves is this: Will a stronger Dollar be an additional factor in the imminent fall in stock markets, or is it throwing a ‘swerve ball’? Clearly, I fancy the latter case.
Most sites I follow have turned incredibly bearish over the last 12 months to the extent where I’m not seeing anyone consider markets can possibly go any higher. That’s telling me something. Since when did markets crash when everyone was expecting it? Who is there to pull the rug from under? Retail participation in US stock markets has fallen from as low as 7% to now 5% – this is an historic all time low! Who is going to sell?
There is wide-scale, poorly researched propaganda out there regarding imminent stock market crashes and gold and silver going to the moon. Working class folks following this drivel are losing money hand over fist as they are fighting the trend. Until we see the S&P 500 break and close below 1,900, the trend is firmly up.
Back to the point, sites I read or gauge for general sentiment include Zeal Essays, Arabian Money, Money Week, Business Insider, the long side of short, Alpha Capture, Gregory Mannarino’s Instablog, Econocasts, Niall Fuller’s Trading, and Stocktwits. But these have been overwhelmingly bearish for a year now. This is really making me wonder.
The most balanced sites in addition to Solarcycles are Financial Sense, the FT, and the Market Oracle which pulls together many excellent articles from different contributors. Financial sense tends to keep a balanced view of the markets with an even number of bullish and bearish contributors. Jim Puplava is an excellent writer, just like John.
Jonathon I am really enjoying reading your posts and thoughts. Thanks for sharing. I concur that this blog here is a really great read.
Thank Jonathan, you list familiar with me. I like mots of them except Niall Fuller who bashed me when I pointed out his Pin Bar strategy actually from Larry Williams concept of Smash Day in 60s. I wrote to ask Larry for his confirm then Niall blocked me from his commercial facebook. And Gregory Marino wrong about sp500 from 2012. But all remaining sites are good. I believe SP500 still moving up. Gold will down fast. TIPS SPREAD (deflation dominated) and EFT holding for gold go down as well so no chance of gold rightt now
Last but not least, anyone who trading based on Pin Bar especially in forex market, it would be suicidal. That what I believe
I certainly don’t use Niall’s system. Every trader has their edge and that is his. But there is a fantastic community of traders on there and despite being In this game for years, I never stop learning. It’s a great community for sensing currency shifts. I’m a macro trader I guess. I like trading the larger swing moves. I seldom trade from anything other than a monthly or weekly chart. There is too much noise on lower timeframes in my opinion. Even the daily charts! 🙂
J,
Just curious, if I may, what financial advisor do you use?
I am seeing a lot of push pull (volatility) right now and more so as we approach the end of QE. We are trendless until we get throughout this period. As you know I am a proponent of the ideas you express which mirror’s Armstrong’s perfectly, but I am also aware of the risk of a cycle inversion. This is where John’s theories come into play. A cycle inversion would correct this market to the degree John speaks of, perhaps even more, and then the bull would resume stronger.
Interestingly, the jury is still out on which direction the market will go at this point. Could the dollar be anticipating a Lehman monument in Europe? Or is something else out there we are, once again, we are unaware of?
The next few months should be interesting to watch.
Hi Alexa,
I’m not sure what you mean as I dont, and never have used a financial advisor.
Again, this proposed bull market theory of mine is just a theory but I’m positioning myself for it. In a trade portfolio, I’m never more than 25% weighted into equities as currencies are my focus. I just follow the money. Pound Sterling was the trade of the past year and now we are swinging back to the Dollar. The dollar trade always throws up some interesting opportunities. Especially when the index is breaking out, thus against all currencies and not just against a few.
I’m not sure what you refer to by a cycle inversion? You mean the Dollar gets dumped across the board? Or are you referring to a stock market cycle inversion specifically? I guess that could happen I don’t know. If Dollar buyers choose treasuries rather than stocks then sure. Why not.
But I refer back to my previous posts. There are numerous problems in Europe which are worsening by the week. The UK is also not immune. With such low interest rates, income is the priority to hedge against loans and debt servicing, to overcome falling tax income as unemployment rises and then we have the pensions crisis which really started back in 2007. Major pension funds have black holes and these are generally unfunded liabilities. It is for this reason I think we’ll see capital flood into the stock market no matter how short term this avenue is. Humans don’t act rationally at the best of times anyway!
But you are correct Alexa. The Dollar may very well be forecasting a Lehman moment but my money is on it for seeing a deflationary collapse in other parts of the world.
And by the way Alexa, I believe the strong Dollar is factoring in another Lehman episode but this will be in Europe this time. Take your pick from a selection of European Banks but there will be a big one that pops. Look no further than Spain, France or Germany.
Much appreciated again Jonathan
Many thanks Jonathan. I frequent some of your suggested site. I do agree fx and fixed income moves are something I value more important than equities. After all, as in your business believes bond and fx trader possess better insight than equities trader. Your dollar view indeed provide bearish equities trader a good insight into selling emerging market rather than US market. I think the risk reward profile is better.
Andre,
Conformation: my next important turn, based on cycles, november 17.
Peter.
Thanks.
Nothing much with any semblance of sustainability abounding. But that’s what was thought of QE until it continued.
Will the EU lose the disinflation battle, it looks increasingly probable and then the EU foundation crumbles. Just another failed experiment in power politics.
Ever stronger dollar pundits also have fracking import reduction sentiment on their side, but this tends to help the competition also.
But tanking resource & commodity prices not exactly good for any bullish.
sentiment.
So must be time to buy again, specifically anything and everything.
Well worth a read….
Source: http://www.financialsense.com/contributors/guild/investors-pay-attention-causes-implications-u-s-dollar-strength
Enter Foreign Buyers
“Other nations and currency blocs are still on the QE path. Japan’s vigorous QE is ongoing, and may increase. The European Central Bank (ECB) has so far been prevented from implementing outright QE by the resistance of Germany; but it is likely that Germany will eventually relent and the ECB will start QE as well.
All of the money created by the world’s central banks is looking for a home where it will earn a return — without being eroded by inflation. And right now, its best option is to buy assets denominated in U.S. Dollars. To some extent, this will be U.S. stocks, especially large-cap, high-quality companies. However, much of this money will flow into U.S. Treasury bonds.
A U.S. Dollar that is increasing in value may draw global financial flows into the U.S., support the demand for U.S. Treasuries, and help keep the U.S. government’s borrowing costs low.”
Support for U.S. Equity Markets
“A strong Dollar will also increase foreign demand for other Dollar-denominated assets — including U.S. stocks.
We would anticipate that foreign demand would especially support big-cap U.S. stocks. Since the Dollar’s breakout began in July, large-caps have decisively outperformed small- and mid-cap stocks. During the third quarter, the U.S. S&P 500 Index fund (SPY) returned a positive 0.6 percent. Meanwhile, the U.S. smaller company index, the Russell 2000 Index fund (IWM) returned a negative 8.0 percent. Note that the U.S. stock market is in a correction phase at present; bulls will buy after price declines. Support for the U.S. stock market has been a hallmark of the government’s QE programs so far. The idea is that national psychology is improved by the “wealth effect” — the feeling of those who own assets that they are becoming wealthier will encourage them to spend and invest, creating a “virtuous circle” of growth.”
S&P 500 CFOs will be scrambling their heads over the weekend on how to revise Q4 guidance with the $ at 1.25 against the Euro.
You are pointing to the reality while many posters are thinking what should happen next because of their bias. Thank you Sir!
I rather be adaptive in trading the market. than to be out of touch.
Just like bear said the S&P wouldnt get over 2000 … they were wrong.
Just like bulls say gold wont crater below $1000 … i believe they will be wrong.
This market likes whole numbers and there are still plenty of gold bugs that need to throw in the towel. IMHO.
Silver should get below $10 IMHO too.
I 100% concur, Duncan.
A good article supporting your opinion on PM.
http://www.marketoracle.co.uk/Article47492.html
SPX weekly: http://scharts.co/1lJphXW
First close outside of the channel.
Against that, we have the a confirmed VIX buy signal and a rather perky-looking weekly Dow: http://scharts.co/1tCgGOI
Meanwhile, oil interesting here – weekly: http://scharts.co/1sX38xO
… and daily: http://scharts.co/1vCxwdy
For a contrary take on on the effect of the $USD on U.S. equities:
http://www.effectivevolume.com/content.php?2388-Weekly-Comments-for-October-6-2014
what happened to the stock market during the 90s when USD was strong?
I don’t understand your point.
stocks and the US$ rallied into 2001/2002.
Good chart by Spring heel Jack.
Stocks rallied into 2001/2 – I beg your pardon??
agree – the rally and line hit in the US $ index therefore is a lagging indicator for a major peak in stocks in place. FX moving in place perhaps was the last piece in the puzzle missing for stocks to finally jump over the ramp.
Interesting Pegasus. Thank you. Great chart overlay.
This an amazing blog.
Besides the many different angels our host presents, I have to thank Steve S for digging into astro, Steve T for explaining the behaviour of some fractals, Slater for his pitchforks, Banned by Elvis for his many charts, Jonathan Scott and Allan for their different views, Eclectic for posting notes on the market weather (has it actually been used on trading markets?), the evolving story of the tides and so on.
For those who trade the semiconductor index (SOX), the +-1035 TD cycle is due october 10th.
As far as the S&P is concerned from a cycle perspective, I keep a firm eye on october 13. The 9/10th should be a low just like I expect the SOX to have a low by then, but when a short term bounce only, the 13-14th to give more clues if this ends the way John thinks.
.
Carpediem: for the AEX the same date comes into play, although derived by using ‘obscure’ math. During 2007-2009 the AEX tumbled 368,99 points. The bottom was 194,99; 368,99 divided by half of 194,99 (being 97,495)= 3,78 and 378 weeks from march 9, 2009 = october 13, 2014.
October usually cements solid bottoms. With or without a panic. I rather be long than short after the 13th, but I will be on the lookout for shorting during november 4 if the market gives me the signals I want to see. The date André mentioned halway november is also my next important potential turn date- as I don’t trade expectations or cycles for that matter.
Peter.
Thanks Peter, and I concur about the quality of input on the board
Agree. The third week of Oct is a good chance to buy sp500, seasonally and cyclically
Someone talking a lot, gluing here to respond like full time, and constantly giving out his targets on certain asset prices, chances are he has an agenda. People should understand why.
how can we possibly “understand why” without knowing the person and what his motives are? Making assumptions about motives is just that: making assumptions. Jazzman, you seem to be assuming the worst when it comes to motives. Are you making those same assumptions about the motives of our host as well?
Me, I just take what’s been written here with gratitude. And with a grain of salt. Lots of folks here are putting in a lot of time doing research, and that I certainly appreciate. Whether their research will play out in real time in a way that actually nails future price direction, that remains to be seen. But it’s fascinating to watch and see how it all plays out. And see whose research is on the money and whose needs more work. Good luck and good trading to all.
jazzman, confirmation bias exists for everyone,
no matter how objective we consider our outlooks to be
From TradeTrekker.com:
The monthly SPX charts show a TD Sell Countdown “13” recorded in August. This has placed both TD Sell Countdown and TD Combo Sell with their final “13” counts. What is missing is confirmation by registering a bearish price flip. That can come this month with a close below 1960.23. This will provide the initial framework of prolonged selling or bull/bear indecision.
The Dow and the Nasdaq can record reverse price flips with an October close below 16826.60 and 4408.18, respectively.
May I jump in ? Love TD Sequencing but IMHO TD Monthly Countdown just stands at 7.
LHL, I know the TradeTrekker blog owner, so if you have something I can show him that details why his count is incorrect, I’m happy to pass it along. Quite a difference in your respective counts…
It also not correct in terms of TD CountDown but still way early
LHL, what system are you using to calculate the DeMark counts?
Just a code from my broker giving to me
Steve T, I hope the ..I’m prepared to go broke comment
on your large short position was said in jest.
Never any guarantees in timing the markets,
probabilities yes.
In brief: You are correct John, about both the major U.S. stock market indices and the precious metals. Many thanks for sharing your exhaustive analysis with us.
I said last week that i would be huge seller around SPX 1980 and I see no reason to think differently.
Long GDX today why?…DIWALI later this month. Gold rises 80% time up until this holiday.
Great recent data on the tides. I am still trying to figure out how they effect intraday price moves.
PMs to rise into the end of the year then major downtrend resumes from January by my calculations. PM bottom nowhere near yet IMO.
looks like 5 down on the 65 min chart may have completed at today’s low. If so, a bounce to 22.40 or so would be likely, possibly higher if gold bounces into the 1240 price zone.
Need more Yen and Euro strength to turn equities over the edge – early action in FX is supportive of the short side.
Euro needs to clear the 1.26 area…maybe the market is figuring out that there will not be much QE from Draghi as Germany, Austria and possibly France may be against it. Anybody knows what the real interest rates are for Europe and the US? I think Axel Merk mentioned a few weeks ago that real interest rates are higher in Europe vs US and without any big QE, the real rates may dictate where money will flow.
http://www.futuresmag.com/2014/10/06/mercury-retrograde-with-a-blood-moon-oh-my
50dma which has previously been support now appears to be becoming resistance in SPX and Nas, DOW is next as the R2K has formed a bearish flag and looks set to contine its on-going plunge.
And from the article Jonathon kindly posted on the USD confirms what I have been saying all along. Capital flows both ways. So if capital has flowed to US stocks from foreign investors, thus strengthening the USD, then it makes perfect sense that weak US stock markets will see a weakening of the dollar as foreigners liquidate US assets with losses on stocks compounded by exchange rates.
Look at what happened in 00/01 to both the USD, gold and gold stocks with a bursting of dot com bubble.
“A strong Dollar will also increase foreign demand for other Dollar-denominated assets — including U.S. stocks.”
Agree
“Peter, from the book. “In order to test the theory, Stapleton and Maxwell brought together some money and invested it in wheat futures. We did not aim for a killing but we did want to own automobiles. We made money right from the start. Successful in their stock market speculations, the two friends began to make plans to establish a market forecasting service. They might have gone on for years, making just enough money off their hypothesis to keep them both in comfort, but then tragedy struck. Stape backed his car into a freight train’s path. He and all his family were killed. A sorrowful Maxwell lost all interest in setting up a company.
I went on alone but the grim tragedy never left me. Instead, I played in astronomy and weather perhaps subconsciously waiting for my grandsons to grow up.”
End
====
I know nothing further except what I have/will post here. I think the answer is knowiing someone who understands the details on how to use the NA. Only then would it be possible to devise a trading system. More on John’s next post.
So sad.
I stopped buying, took 35% of profit. Going for walk in Rockies.
Fewer varmints there than the 2 leg variety in any city you choose
Dollar index chose path to 82.88?
No matter, 90.00 etched.
Expect road to a topping of P3 via the 5th. for surviving Ellioteers,
Whilst trail following there should be a trailing stop
Now that the US unemployment rate is (supposedly) back under 6%, and the peak Smoothed Sunspot Number is almost certainly behind us (April/May 2014), I’ve been looking to see if there might be a connection between them, and also US stock prices.
Looking at the strongest solar cycle (SC19, which peaked at SSN 200 around February 1958), the Dow doubled between September 1953 and July 1957 but then lost 20% during the six months leading into the SSN peak. That must have seemed like the perfect shorting opportunity – a waning SSN and a new bear market.
But instead, the Dow rose by 63% until it double topped during August and then December 1959 – that’s about 18 months of significantly rising prices after the SSN peak. During that 18 months, US unemployment almost doubled from 4% to nearly 8%.
In fact, the US unemployment rate has risen sharply following every SSN peak since the second world war: http://time-price-research-astrofin.blogspot.ie/2014/03/sunspots-and-stocks-big-picture.html
So it is far from certain that speculation must decline after the SSN peak (even in a strong solar cycle). And it seems that the likely forthcoming increase in US unemployment will not necessarily prevent US stocks from rising further.
Is dollar having a intermediate top at 87? The attached article had mentioned 87 as a top for the dollar, well, it hit 86.87 last week … good enough …
http://www.kitco.com/ind/Tanashian/2014-10-06-US-Dollar-is-Extreme.html
If dollar craters, the entire markets will follow suit, along with a strong reversal in precious metals, which needs to be confirmed tomorrow. All we need is another strong gold bounce day to keep the October crash scenario alive.
I am still of the opinion that the dollar doesn’t have to affect gold prices. I know everyone is saying that story, but ignoring the riots in Hong Kong, war in Ukraine, Iraq, etc.
Interesting:
http://stocktwits.com/message/27614948
Thanks tony spot on again.
The tick data => http://bit.ly/1fMcakI is indicator the pros use, and has been deadly accurate lately, and hinting more dowside on Russell and Nassie soon. Short term.
With all this syria, ebola, fed speaking coming, this week is sure setting up to be a beauty. 🙂 helmets with chin straps required yes?
I think market will consolidate until 10/17 and give up the ghost sometime before 10/31. (Moon in Leo on 17th). There is too much money in play right now so maybe 8 percent correction, big move down not until 2015 (shemitah year).
TZA-John’s largest position is short RUSSELL… If I can show a key pivot based on the tools I use I will. The pivot at red arrows shows price being rejected at the coming together of lines from four medianline sets based on some simple rules for drawing…for a selloff to continue.pivot needs to be negated….
http://stockcharts.com/h-sc/ui?s=TZA&p=60&yr=0&mn=11&dy=0&id=p51336545100&a=204387578&r=1412656062255&cmd=print