
On a longer term view, these all fit together, and understanding their relationships can help us predict what’s coming.
The grand solar minima correlate with clusters of war:
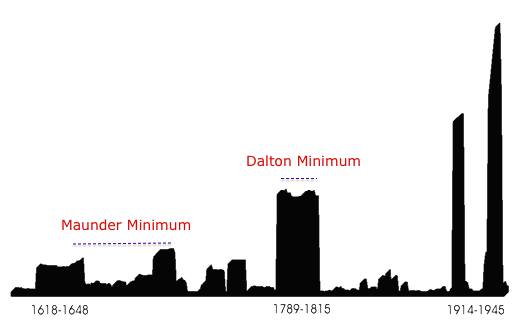
War clusters / cycles
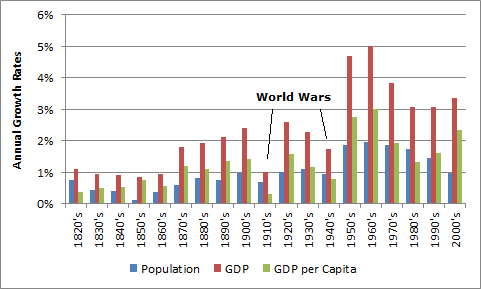
The grand minima were periods of lower population growth and lower GDP growth whilst conversely the grand solar maximum of the 1960s-70s was a period of peak population growth and GDP, shown here:
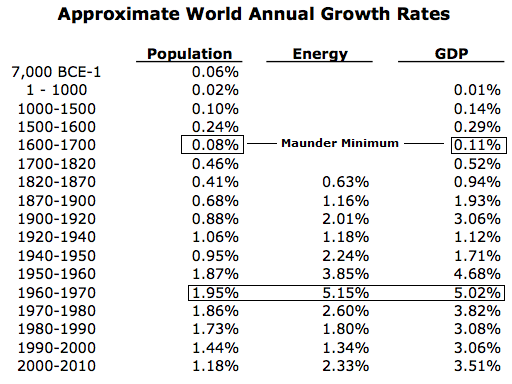
So, broadly speaking, the grand solar minima have equated to war, low GDP growth and low population growth, whilst the recent grand solar maximum was the opposite.
Benjamin Friedman established the correlation throughout history of declining economic growth giving rise to war. Extremists are brought to power under economic suffering. Revolutions occur when people are struggling (most recently, the Arab uprisings when food prices had risen to price people out of the basics).
World wars 1 and 2 were periods of low GDP growth, and WW2 occurred out of the Great Depression:

The end of that double great war period gave rise to a global baby boom that produced a young adult price-inflation swell in the 1970s then a middle-aged stock market boom swell between 1980 and 2010 (phased across individual countries).
Since then demographics are united in downtrends in the major nations producing this sobering composite:
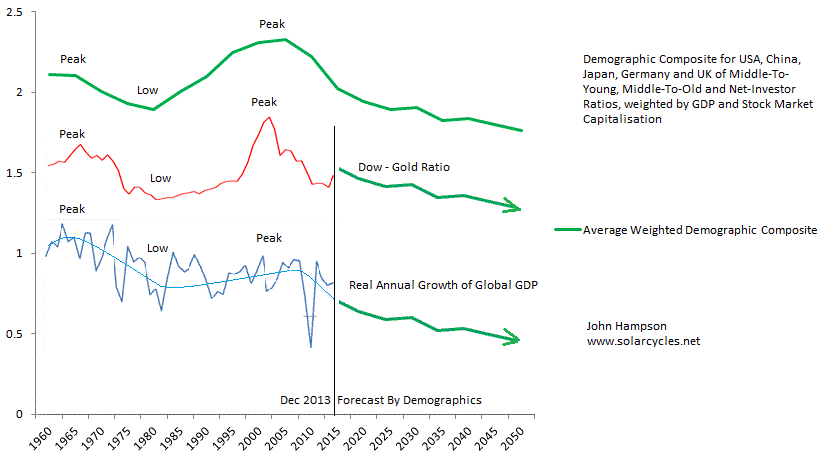
Global GDP growth is struggling and should do so for an extended period, and stock markets should suffer likewise.
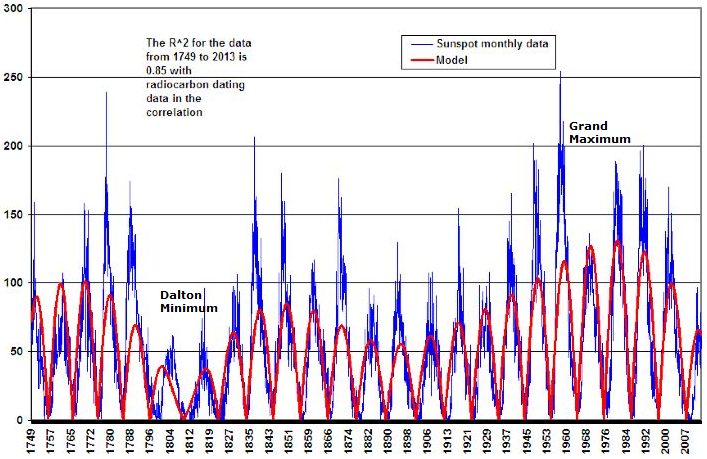
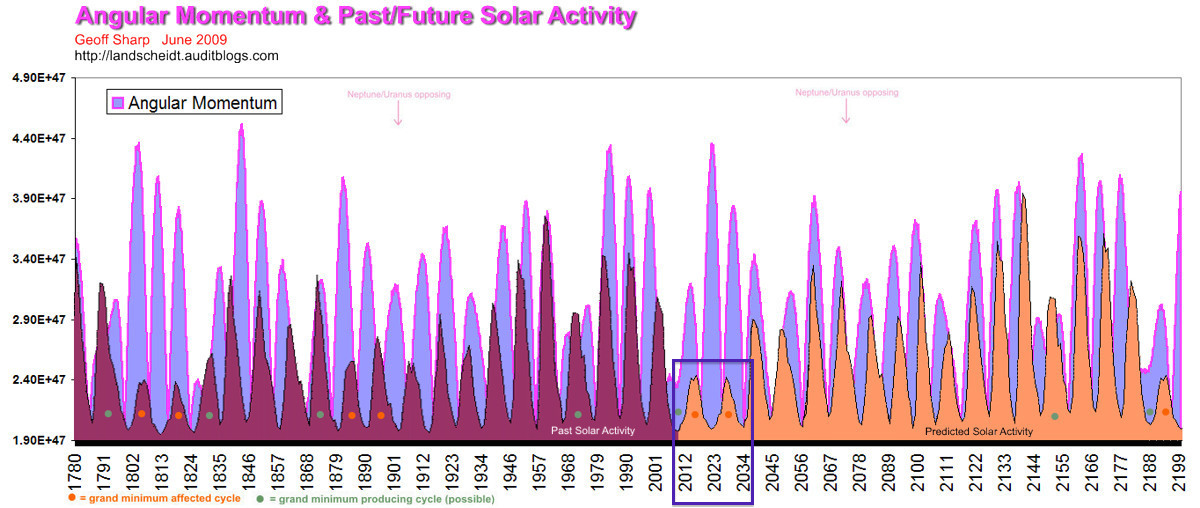
Meanwhile, solar scientists predict that we are tipping into a new grand solar minimum. The predicted low GDP growth above fits with the grand solar minimum predicted below, making for a compelling cross-reference.
 The last piece of the puzzle is debt. Debt is prosperity taken from the future and has been increased with each war and each major recessionary/depressionary period, to pay for or offset those events:

The resultant long rising debt trend means more productive receipts have to be spent on servicing the debt, which crimps the economy beyond that of demographics.
The end game for debt is QE. Printing money to buy your own debt is the policy of last resort. The only way out of this is if demographics point to much higher receipts ahead, but in fact they show the opposite.
Drawing all these relationships together, the outlook is grim. The next couple of decades will be characterised by low global GDP (as written in demographics), which puts the world at risk of war (at both national and international levels). The debt situation threatens to accelerate out of control in certain countries (Japan is at highest risk) as central banks offset even lower GDP and potentially have to pay for war additionally. Major war would cut both GDP and overall population further, making for even greater per capita debt burdens.
These are the major themes. The specifics by country and by timeline are more difficult to predict. But at the global level, the negative feedback looping between solar, population, GDP, debt and war, suggest the crunch is unstoppable for the world.
Eventually, these interconnected phenomena will turn into a positive feedback looping. Out of the ashes of a grand solar minimum with a purge of population, the devastation of war and bankruptcies should come a new solar normal with another baby boom and some anticipated revolutions in systems and organisation (financial, economic, social). True new ways of doing things only occur when circumstances force.
Set against the bleak outlook of the next couple of decades is the continued parabolic rise of technological evolution. Developments in nanotechnology, biotechnology, artificial intelligence, space exploration, geonengineering and renewable energy may produce paradigm shifts that assist with GDP and debt, and accordingly could ease the conditions for war. However, the negative feedback looping captured above extends its grip over this too, as corporate investment has been shrinking across the world in recent years, in accordance with lower economic demand and higher uncertainty.

Declining levels of investment and R&D worsen the outlook for the future and add to the downward spiral.
We could argue that the global secular bear in the economy and stock markets began in 2000 and that as yet we have avoided major war. However, collective demographics have worsened since then, as Europe and China tipped over to join the US and Japan. With a comprehensive case for stock market peak here in 2014, the next leg down both in equities and the global economy should be the worse yet. To add to this, a large percentage of the population has seen little improvement in personal finance for some years (as the cyclical recovery since 2009 has been very unevenly distributed), which creates bubbling trouble.
The situation in Ukraine and between Russia and the West may be a fruition of these themes. Economic troubles were a major factor in bringing about the revolutions in Ukraine. The sanctions against Russia are hurting both the Eurozone and Russian economies, which are already struggling, thus worsening the situation for both parties. Protectionism was a theme of the Great Depression, and is a self-defeating policy, but it will most likely increase here with the anticipated next leg down in the global economy and markets, as nations turn to helping themselves and trying to prevent domestic unrest. There is the risk that China and/or Russia sell chunks of their large US treasury holdings and destabilise global markets in a major way. Both countries have been increasing gold holdings in recent years. Indeed, ‘war’ could take a new form in this era of global, interconnected and instant: financial markets may be targeted, adding to the risks for traders.
Putting such speculation aside, the trends in debt, demographics and solar variation combine to make a compelling case for a period of serious economic trouble. That period kicked off in 2000 but is now strengthening in intensity, and stock market indicators assess us to be on the verge of the next leg down, which should be the worst yet. The conditions for war are in place, and it seems fairly sure that trouble around the world will intensify. The question is to what degree and how matters unfold. The recent deterioration of relations between the West and Russia is an ominous development if we are now heading into a major breakdown in the markets and global economy at the end of 2014. Major international conflict is by no means certain, but if we were looking for the appropriate conditions for it, then they are in place.

The variety of topics you cover make this site truly unique – great work John.
Interesting article on home prices, the CPI and interest rates:
http://globaleconomicanalysis.blogspot.com/2014/09/housing-prices-real-interest-rates-and.html
This is totally consistent with the scenario I painted yesterday where I see a real low in 2018 and the weakening 18 year momentum. But timing comes from gravity. So John is right and has been right from a longer term perspective. But I still believe the final turn will come in q1 2015. We’ll see.
As always a very interesting read.
Cheers,
André
Hi Andre,
In reply to your previous post, I ahdn’t thought of taking the average of Ap/Pe and so will do that and see what I get.
Thanks for pointing me in that direction.
Kerry
My pleasure.
André
to continue the discussion of sub-cycles to the 4.5 yr ap/per cycle… Both new moon and full moon create the highest high tides. I used tidal station Brooklyn Bridge (East River) and looked at highest high tide measurements at both new and full moons (and extremes of year for first and last quarter moons) for 2014. Full moon with highest high tides and full moon with lowest high tides created:
1/15 FM/LHT
2/8 Q1/extreme LHT
2/14 FM/LHT
7/12 FM/HHT
7/25 NM/LHT
8/10 FM/extreme HHT
9/8 FM/HHT
9/25 NM/LHT
10/9 FM/HHT
12/16 Q4/extreme LHT
Keep at it; lots to learn. I know I did!
André
we shall see
http://stockcharts.com/h-sc/ui?s=$SPX&p=D&yr=1&mn=4&dy=0&id=t16428867960&a=243353372&r=1411985251181&cmd=print
Youza!
Thanks gents
thank you, John
similar messge from a different angle is described in the works of two Harvard professors:
http://seekingalpha.com/article/119927-the-great-awakening-boomers-your-crisis-has-arrived-part-1-of-3
This is a fascinating day for equity markets.
If bears can take this lower today building on
last week then downside risk is increasing.
On the flip side if early losses are reversed once
again it strongly indicates incredible strength remains on
the bullish side, following on from Friday’s US close.
Phil, Target is 200sma at circ SPX1900 IMVO. Should be a sharp move down over the next week or so.
I know I keep saying it, but truly astounding John and so generous of you to share your research for free. One can’t really say thank you enough. Your research has certainly held me on the straight and narrow and kept me focused.
I was tempted to unload my recent TVIX/UVXY purchases Friday but decided to stay long after rereading your recent articles which solidified my conviction that this market is due a huge plunge.
I now think the stage is set for a massive surge in volitility and I am looking for a target of VIX 40’s initially, perhaps weeks, but longer tem targets 90-120 before it tops out in conjunction with a market bottom.
Cheers
Roger that, Alan. I personally can’t thank you enough John. Your work is top notch to say the least.
Thanks both!
100% agree Allan, I have said this a couple of times about John
and I am sure it’s a sentiment felt by about anyone else who
reads solarcycles, just not always expressed by others.
Cheers Phil
The ASX droped out of its large rising wedge two weeks ago and the downside possibilities are frankly, horrendous. I believe the ASX will likely be the hardest hit market globally and it is a shorters dream:
http://stockcharts.com/h-sc/ui?s=$AORD&p=W&b=5&g=0&id=p64733008460
Duncan, do you see today’s price action and
how that develops are being particularly significant?,
or not, TIA.
Yes daily lower lows. Watch out below!
Thank you John, you are like a light in a dark night !!! THANKS……
Appreciated
The following is a slightly revised e-mail I sent to John, who gave me permission to post it to the board. I don’t wish to ‘hog’ or overwhelm the board with my posts, so I will post this first; to be followed by three (III) parts; whenever John posts a new topic. I hope the group will find this of interest and use. Thank everyone.
=========================================================
THE GRAVITY PROJECT: INTRODUCTION
SELBY MAXWELL AND THE SCIENCE OF WEATHER FORECASTING
(From pages 18 – 27 of: “A Roadmap of Time”. By Brad Steiger)
http://www.amazon.com/roadmap-time-Maxwell-Wheeler-weather-energy/dp/0137813856
John, since this is your blog; I wanted to ask permission to post, for group use,
the theories of Shelby Maxwell and a trading system purportedly used by
Arthur Cutten based on gravitation.
I don’t think copyright is an issue since I have talked with the author Brad Steiger. I asked him some questions about the system details and he said everything he knew was related to him and appeared in his book. Maxwell’s work was eventully combined with that of Raymond Wheeler.
My part would be to post a summary/cliff notes version of the concept outlined
in the book. Given the information, the individuals in our group could then test the application of these ideas on their favorite market to determine it’s usefulness to them for trading.
But I would need to ask a favor or help from anyone in the group on how to apply this information. The system was developed from calculations which appear in the Nautiucal Almanac.
First I think one would need to understand the information contained in the NA;
then try and interpret the methodology on how the calculations were derived.
If everyone who is interested in this project works together; individual goals and
ideas could be accomplished very efficiently.
Let me know your thoughts; and if this is not acceptable; I understand.
Thank you.
yes, Eclectic. very interested.
Interesting…….
interested. first we need Explanatory Supplement(http://asa.usno.navy.mil/Intro/Exp_Sup.html)
Interested. Have known of Maxwell since buying this book several years ago.
thank you John. Very good long term guide.
More short term the Usd/yen has broken its uptrend on the daily chart this morning. Let the games begin.
Because the group is discussing the topic of electrical, the following is a piece by Bill Meridian about the work of astrologer Charles Jayne. I haven’t gotten around to doing any research yet on this topic. I might not be able to understand the correct application. And, it may not practical.
“The Vertex
Jayne once received a letter from Johndro explaining his work with the newly-developed electrical ascendant. Jayne tested this new point by running solar arcs to it. He concluded that the opposite point in the zodiac was more sensitive. Johndro followed this conclusion with more testing and found Jayne’s finding to be accurate. Today, we know this point as the vertex. Jayne felt that this point was fated and represented matters beyond our control.
The discovery of the vertex was based upon his GEM dynamic field theory where G stands for gravity, E for electrical, and M for magnetism. The meridian and the midheaven correlated to gravity, the electrical ascendant (antivertex-vertex axis) to electricity, and the ascendant and horizon to magnetism.”
War cycles.

Interesting. ,And pi=3.1416 * 1,000 days~=half of above cycle (and related to several other cycles).
I’ve entered several trades “short risk” including short both USD/JPY, as well CAD/JPY hunting longs in both EUR/USD as well GBP/USD.
Now is not a time to consider the individual “data” of any given country as currency markets are currently concerned with the pure play of “risk on” vs “risk off”.
You pit the safe havens against the commodity related currencies for some of the largest moves, and watch closely to see the obvious correlations of a stronger yen / weaker dollar and lower equities in both Japan and U.S.
Nikkei rejected here at “double top” 16,450 area as planned.
Thank you John for your update:
This is what I want to ad today when I took a closer look at the bradley and reading Mahendra Sharma’s report today…
Well Mahendra is still very bullish longterm but for now he is warning things be volatile till oktober 25… Mercurius retograte from Oktober 5-25 might give us some clues..
The bradely has a turn on Oktober 8 and another one on the 15..
So possible a decline till Oktober 8 a false move up till the 15 and straight down again til oktober 25…. the graphic shows a line down till November 22 but I think we will see an inversion by the end of Oktober..
Interesting fact… both bradley’s geo and helio have a low on Oktober 8 and a high on Oktober 15..
http://time-price-research-astrofin.blogspot.nl/2013/12/geocentric-and-heliocentric-bradley.html
And we have two eclipses this month on the 8 and 23th..
Here is also an interesting update from an astrologer for Oktober:
This is wonderful Carperdiem. Much appreciated it.
Am I wrong or doesn’t the Bradley work only evidence a turn and not the direction of the turn? So lows/highs don’t apply here?
That’s my understanding Gary. Bradley doesn’t indicate the direction to the best of my knowledge.
Duncan, I asked you in the previous thread but you obviously missed it. What proprietary/timing indicators do you use? TIA
Damn things getting very UGLY if you’re still long.
Yes, good timing call by Duncan – I was wondering about this too.
John,
Awesome clarity of perspective. Great job.
Thanks Alexa
Good morning to you, too, John. The elegance of of the long term conditions and the immediate bearish conditions are beautiful in a dark way. Too bad it isn’t showing the inverse like after WWII. We aren’t pessimists, we’re realist. Ref the hope that new technologies offer. In the early 20th century, we had industrialization, electrification, radio/communications, oil, autos/airplanes and we still had the 1930’s and 1940’s! On a positive note, for spiritual reasons I am as certain as one can be there will be no WW III. For practical reasons, nukes make it very difficult without total insanity. That doesn’t mean it will be a rose garden. President Reagan was elected in similar astrological conditions to Lincoln and Kennedy who were assassinated so many were very concerned. Reagan occurred in an air sign vs an earth sign so it was a close call but 3rd time was charm.
there it is!
It looks like we’ll get a chance to test that supposed liquidity in the bond markets. Thank you Mr. Gross!
Gold not able to break out and small scale triangle has formed since Sep 22nd. Immediate test of last major low at 1180 should follow. I would expect gold to subsequently rally from that level.
ok, correction is voer, time to back up the truck. I’ adding IBB, and QQQ and shorting more GLD and GDX. This market is so resilient.
1,964 is the line in the sand today and tomorrow in my opinion as far as the S&P 500 is concerned. This is the major monthly pivot. A potential rally under way from here. Watching with interest.
Nicolas, going long IBB and Q’s here is really risky amd you’re shorting one of THE most shorted markets ever!”…………..be very careful
http://stockcharts.com/h-sc/ui?s=$BPNYA&p=D&yr=0&mn=11&dy=0&id=p06544106151&a=367906801&r=1412000869507&cmd=print
http://stockcharts.com/h-sc/ui?s=$NAHL:$NATOT&p=D&st=2014-01-14&en=today&id=p39086876268&a=369189956&r=1412000966399&cmd=print
For dollar bears, beware:
A third US dollar bull market getting underway
28th September 2014
http://www.georgemagnus.com/viewpoints/
Gary what is the go with that link?…….it keeps getting hijacked!
Georg mentioned there were problems with Apple users – don’t know if that’s been cleared up.
Great posting, a theme covered in my book, that will be free to all when it is done. Quote you and some of the same sources. 😉
Anyone has any other material to weigh in, please feel free to post links.
Thanks wxg
US markets bounced back strongly on Friday,
be careful folks in case today follows the same trend.
It will make an all time high this week.
0r going up for a couple of days then down
these rallies are doing my nut in
Regards the dollar, from tradetrekker.com
The daily DeMark US Dollar index (DXY) is recording a pair of “13’s” and though this signals price exhaustion for that timeframe, longer term strength looks to continue as the weekly DXY is on a TD Sell Countdown @3, along with an uninterrupted TD Sell Setup @9 + 2. The monthly DXY tells a clearer picture with the Keltner/Bollinger (TTM_Squeeze) volatility indicator showing positive momentum.
Demark said it needed INTERSECTION to valid any setup or countdown
possible 2.5 billion pomo today so watch to see if selling into resistance occurs
1976 50 ma
Adding Short SPX1976 …. Allan got to run but will answer your question above shortly.
put your stop just above 1982…
This is an excellent advice for the novice shorters who read a lot from bear sites such as safehaven.com.
yes but the stop triggered would not mean a continuation of uptrend or CIT…this is very important to get.
for now 1993ish would have to be breached with conviction to confirm that a possible bottom is forming
The positive moon cycle full + 3 to new + 3 is over. Maybe now we will have a correction.
Total Par Amt Accepted (mlns) : $2,135 POMO
POMO
POMO
watch the fade
John – if there really is no PPT then how do explain pomo, back door pomo through
surrogates in Europe (Belgium), central bank illegal buying of the futures markets,
the dumping and misappropriation of gold stocks (including deposits from other countries), the missing WTC gold on 911, etc, etc, etc…
Thank you John for your fantastic work as well as your ability to attract and manage such a great group of mindful posters.
I am truly thrilled at the optimism and maybe even arrogance of the bulls, the result should be really memorable.
The dollar bulls seem to be lining up in the same vein. Bullishness on the dollar seems almost as universal as bearishness on treasuries at year end.
Here is a chart that tells me the dollar rally is very likely over. For my work over short and long, long term. (the author even seems to cheat the trendline to show it breaking)
Thanks specie
specie, have a look at yearly usd chart well and truly broken out
Hi Ben,
I’ve really studied the dollar charts including the pairs. Can you post which you are talking about. When the sediment gets all crazy one side or the other and people focus on shorter term trends like 1 to 3 years and ignore the really big ones like 8-10 years, i likes my chances. I’m not short uncle buck just watchin charts.
go to Robert main prop trading futures.
its on his blog
im confused cos I missed that your chart is actually yearly too!!!
his chart goes back to 1994 that maybe y
HI Ben,
I see. It looks like he’s using monthly bars. I’m not sure why he draws the line like that. It doesn’t look like closes to me. It looks more like trying to get as many touches as possible. To me three touches makes a trendline. Closes are more important than intraperiod but i try and weigh them all. I’ll keep an open mind but when i see universal bullishness like i am seeing i’ll believe the opposite until proven otherwise. Been long long long long treasuries since the end of last year and it’s been the easiest position to be in. Universal bullishness or bearishness eventually works. (gold)
Go to the following link to see USD, GLD, OIL back to 1980.
Notice that 29 years ago (Saturn rotation is 29 years) USD spiked over the period of a year while GLD and OIL sold off. Then USD went down for 15 years along with GLD and OIL while equities soared. One possibility is that history repeats and the GLD bull is over and the SPY will go up relentlessly more or less for 15 years.
Makes no sense based upon how dismal the economy may be but you always need a wall of worry for markets to climb. Maybe the reason the USD is going up is that money is moving out of non USA assets into the USD as a prep for massive allocation into US denominated equities, to be followed by a rotation into non US equities in a few years which will then bring the USD down as money flows toward the favored markets. Just to name a few technologies that are coming (not to mention the super cool sequestered ones, imo) superconducting materials, drones galore, smart everythings, smaller and faster and more captivating electronics, mining industry innovations, and more and more usages of electrical devices in lieu of liquid fuels. Based upon this world view (sorry Mr. Goldfinger) one should go short GLD, go long the USD for 2 months, switch into the SPY after its October lows for 3 years, and then move international incrementally starting in 2016.
http://stockcharts.com/h-sc/ui?s=$NAHL:$NATOT&p=D&st=2014-01-14&en=today&id=p81015573630&a=369189956&r=1412013056244&cmd=print
spiced up this trade system (and it IS a mechanical trade system that works) showing how to use nasdaq NH/NL’s with net line trading
use this with the elder chart and the 13ema and you cant go wrong.
then use a bull/bear indicator like the weekly 50/10 ema’s and the monthly ROC…
KISS
or a bull/bear system like this
http://stockcharts.com/h-sc/ui?s=$INDU&p=M&yr=20&mn=0&dy=0&id=p69494817865&a=367908471&r=1412013341130&cmd=print
cycle is clearly ready to rollover
deploy the last of the billions!
Allan / Gary
You asked a question about a how i time my trades. I generally make use of multiple indicators but my favourite and most reliable are using graphs on mulitple timescales. I try and identify previous levels of importance such as a intraday high or closing high. These enable me to identify horizontal trendlines which i find more useful. I pair mutliple indicators such as risk indices against broad indices. I use the vix to identify a potential bottom – for the past two years market declines stop when vix gets over 200sma. And that brings me onto moving averages. These are very important in my trading and it confirms my trade bias. There are other indicators but those seem to be the main ones.
I never look at volume as it has been declining since this bull market began. I also have a personal view as most where the market is going medium terms but whether it plays out is another question.
Hope that helps!
Duncan
It does, Duncan, thanks. So is it fair to say, nothing proprietary (I don’t mean that in a negative way) but using commonly used TA tools wisely?
Duncan, good luck with your short.
Any decent sized dips continue to be bought back.
One dramatic down day may change this trend,
but as yet equity markets are still to crack.
for the longer term sets to take precedence, the lower red line
must give way… once again it was defended….
http://stockcharts.com/h-sc/ui?s=$SPX&p=5&yr=0&mn=0&dy=16&id=p43183431046&a=338320968&r=1412032547232&cmd=print
I think everyone has said everything about everything. I am just re-reading the same views over and over. And so we wait. Will it be 10/2014 crash or 1/2015 crash? (Or later?)
John Li, current price action is repeating,
it’s difficult to say much different with
dips being bought back.
The increase in comments is reflective of
the time period, it’s make or break for the
2014 bearish case over the next few weeks
and posters sense that.
My projections point to an October 2015 crash but more likely, an April 2016 event. Whichever one it turns out to be, it’ll be nasty.
100% agree with you Johathan – i favour Oct 15. However, i still think we correct here for a couple of months.
I’m not factoring in much of a correction or retrace here Phil due to the reason I’ve outlined in previous posts. The Institute of International Finance brought to my attention the increasing flows of capital into the the United States during Q2. During Q3, capital flow velocity and volume has gone through the roof, predominantly leaving areas such as Australasia (the Aussie and NZ Dollar are being hammered!), Malaysia and Indonesia, Russia, India, Ukraine and other Baltic States, North and Central Europe, SE Asia including China and notably, the Middle East GCC countries including Saudi Arabia and UAE.
Quite simply, capital is seeking the higher than likely possibility of interest rate rises in the US, greater political and financial security, and the lure of US equity markets where non-institutional participation is at all-time record lows. This is all underpinning the stock market right now.
It will get very interesting once the big money arrives from Europe including the UK, Switzerland and the Nordic countries. This will lead to a stock market bubble in my estimations. A research paper I have from Jones Lang Lasalle paints a very similar picture of these capital flows. Quite simply, the USA is the healthiest horse at the glue factory. Talk of US Dollars being sold into AUD, NZD, GBP, and EURO before 2016 are of pure fantasy in my opinion.
Quite simply, this market is going higher, as is the US Dollar, even if the fundamentals don’t add up. But then in bubbles, fundamentals go out the window! Long the S&P 500 from yesterday and building Dow positions for a general stock market rally and bubble heading through 2015.
“… non-institutional participation is at all-time record lows”.
And Institutional has also been largely standing aside: http://www.zerohedge.com/sites/default/files/images/user3303/imageroot/2014/05/20140501_rotation.png
This so-called smart money has missed out on the US stocks cyclical bull, and will have to join back in when the indices break higher. The fuel for a US stocks bubble is substantial, to put it mildly.
I’ve been looking closely at the South Sea Company and tulip bulb manias recently, and the thing that strikes me most about both is that “all classes of society” had fully invested in them. US stocks markets, frothy as they might be, are nowhere near a manic stage yet.
Yes Mark. This doesn’t susrprise me whatsoever. The problem we have around the world is that of sovereign debt especially in South America and Europe where much of it is collateralised in US Dollars. This has been done due to the ECBs refusal to print Euros and various South American states operating akin to banana republics with defunct currencies thereby relying on the US Dollar. As the US Dollar gains strength, the more and more difficult it is for these countries or regions to repay or even service the debt. The Dollar is parasitic.
These countries will therefore have to purchase US securities to hedge this comingimplosion and also attempt to fund bloated, unfunded pension funds and the like. They are pushing elephants up stair cases here as they are facing an impossibly task. We will have economies blowing up left, right and centre before long.
I predict the latter part of 2015 will reveal this. Until then, foreign central banks will have no other option but to jump knee deep into US equities where even the dividend payouts are greater than interest rates on offer in the periphery economies. The EuroZone has gone to negative interest rates!
I would also see late 2015 as the likely
end to this bull market, may possibly stretch to
2016.
That has been my view since early 2014 and
see no reason to change this.
The prospects for the bull market ending this year
are utterly remote imv.
Posted again above Phil. I share your thoughts wholeheartedly.
While you are on a philosophical note John, I think Gail Tverberg is a very sane voice right now. Irresponsible debt creation by governments is one thing – its not their money so they don’t care, but personal debt is quite another thing, people are up to their eyes and won’t go deeper – anyway you or I go to prison for non payment of debt. From what I can see the west is mainly driven by luxury buying, which we are having to learn to do without. The countries (at least 80% of the world) where people still struggle to pay for food have less access to debt therefore have spent less of their future, in Africa for example people have to survive on nearly nothing – can we? The rich complacent nations will have to change or die – right now the drowning ones are lashing out and probably the markets will sink with them until some new order slowly emerges.
Makes sense, thanks
From George Magnus’ article:
Be warned: the two previous US dollar bull markets were associated with profound shocks. The 1978-1985 uptrend brought down Latin America, the 1992-2001 version brought down Asia. It’s quite likely that EM will be in the crosshairs this time too.
Euro near free fall this morning.
I think we will see wider scale Euro dumping in October Phil. The reality of the situation in Europe hasn’t hit home completely yet. Pound selling to pick up pace in November. These are my personal projections only of course. The Pound is showing some relative strength across the board but it will follow Euro and I expect the declines to be as bad, or even worse throughout 2015.
For those that foresee new highs into 2015 consider the following. The Fed is taking its hand off the spigot in Oct.
The only thing that has fuelled the indices to rally to these extremes is QE. That imo is undeniable. One only need to do a comparison of POMO and the SPX over the period since QE began.
What happens when POMO ends?…….simple given the history.
So if markets are to climb to new highs or at the very least see a significant rally into 2015 then simply, more QE is needed.
How do we get more QE if the Fed are going to end it in Oct?
A market collapse of 20-30% would be the trigger required to send the Fed into a frenzy and back into QE mode.
I believe this is what will happen, I however don’t think the markets make new highs in 2015 but put in a double top and then collapse into 2017 to below the 2009 lows.
Just aside, I know John see no correlation between QE and the bubble, I however believe that John has proven that solar cycles do indeed have an impact upon the markets and speculative mania and therein lies the reason for QE.
QE was the fuel for the mania………cause and effect.
The central banks are passing the baton Allan. QE will never end. The ECB will start next and all that loose capital will end up in the USA. You need to look at the bigger picture mate. Where are all those Dollars going that are down to the dumping of Australian and NZ Dollars? They are not staying in your neck of the woods mate. You need to look at the bigger picture. This is not about the US. This is about the global economy and its in big trouble.
POMO will not end. QE will not end. There is always someone doing it. And that will continue. Good luck mate but be careful.
Enjoy your posts, Jonathan, keep them coming!). Just as a sidenote, I am working on stress tests for european banks and we are joking with teammates that we can all go home as the CBs of the world will take care of things. As a matter of fact, all bankers can now go home and enjoy ever growing markets as risks are gone, thank you Ben.
In the meantime, HK looks like a twin bother to Kiev in December, back then nobody took Kiev students seriously and we all know how it went. Needless to say, HK is not irrelevant Ukraine. But hey, who cares, we will just print our way of any trouble!:)
Jonathon sometimes I wonder whether I am speaking another language?
I am saying that QE will never end. It is exactly for that reason that that I am bullish gold, although you see differently.
And we have been over the flight in capital to the US? I see that differently as well. The USD is losing its world rsserve status. Now China and Europe trade without it.
Just to clarify what I did say. iF POMO is to continue, which it will, there need to be a reason to continue it. That reason will be a stock market decline as John has indicated of 20% minimum but more likely 30-40%.
that will ensure that QE is increased into 2015 and not ended in Oct.
Yes Slim. I’ve seen what you’ve experienced too. I worked in international operations for the Spanish Central Bank from 2008 till 2012. Only you would believe what I witnessed during that time. No one else here would. Denial is an understatement. I was so afraid of where Europe is going, I fled to the Middle East and now work in the Oil industry. Central Bankers and Politicians don’t live in our world.
I don’t see the end of POMO as a big deal. The Fed has been reducing POMO gradually over the past many months. Ending POMO is just one more small reduction.
Jonathan, I’ve been following your contrarian point of view with great interest and a lot of what you say makes sense.
However you predicate all this on the basis of an economic collapse in the World (Europe, Latin America, Asia etc – if there is any etc left) so how do you then suppose that the US equities markets will survive? Almost all of the Medium to Large Caps have as much foreign earnings as at home and are therefore vulnerable to the World Economy collapse.
That’s the paradox that I’m trying to reconcile here.
Thanks very much for your well articulated and statistically supported POV.
As I have said numerous times purvez…..
The US is the healthiest horse in the glue factory. It is the best of a bad bunch. It will not withstand collapse. It will simply be the last one to collapse.
Would you jump onto any of the life boats that are sinking or would jump onto the one which still ‘appears’ the most buoyant thereby enabling you to survive just a little bit longer? I have never stated anything other than this concept.
Only when the US faces collapse will precious metals, oil and other commodities rise in value. I don’t see gold or silver rise across the board till 2016. Anyone long now will lose their shirts.
It’s the Dollar, or Dollar denominated equities. We will see another 1999/2000 event next year. Dollar bull and stock market bubble. Then a huge crash making 2008 look like a picnic in the park.
Thanks Jonathan for that lucid explanation. So you do see a destructive end game….just that yu see a hyper ramp before that in US Equities. Gotcha.
Yes Purvez,
We have entered a slightly different paradigm as our normal and usually accepted monetary parameters have been artificially mismanaged and altered. We will still arrive at our usual destination of a crash after years of equity gains but the timeframes and severity have been affected.
It’s akin to the Mississippi River. The economy is pretty much a closed system. If you change something somewhere, something else in the system will change or be affected. The engineers, for decades, tried to change the course of the Mississippi river so in order to prevent it from cyclical floods. In order to do this, they tried to straighten the river and make it deeper. This was meant to reduce the velocity of the river. They then built levees on the river banks to further protect the hamlets and town that existed on the flood plains. But as with all closed systems, Mother Nature decided she wants to take her natural path and so the system reacts violently. The river began to meander and cut into its banks thus increasing the direction and speed of flow. The next flood was vicious and claimed many lives. It destroyed settlements in a way it never did before. Amazingly, engineers attempted various different approaches to prevent the river flooding but every time it did, the severity worsened. Eventually they conceded defeat and stopped.
What we are seeing with the economy is playing out in a similar way. QE and foreign currency collateralised debt has skewed the system completely. The current cycle will last longer as did the time between the river floods after the river engineering projects. But when the floods, or the next market crash comes, it will be horrendous. Always worse than the previous.
It’s all about mean reversion. The more a system is manipulated or re-engineered thus not allowed to flow naturally, the worse the Snapback will be to the mean.
And yes we will see a swan song for the Dollar. It will be a ramp. This is not yet a bubble but it will be. Again, I’m just following the money. The end game will be destructive in my opinion as politicians and central bankers are no different to those 20th century hydro engineers. They think they are God and can actually alter and control the system. They cannot and we will see this play out.
Jonathan,
Your views mirror Armstrongs. I assume you follow him?
No I dont. He’s overly political and he bases forecasts, predictions whatever on war and conflict. I don’t agree or disagree with his assertion. It’s a field of study which simply doesn’t interest me. He also states gold manipulation does not happen when I’m convinced it does. There is no reason to study the why and how behind everything. The price action is all you need to follow. I am witnessing a dollar bull market and it’s in the charts. I also track the flow of currency for 40 hours each week and there is a pattern arriving which an analytical heat map makes so incredibly obvious.
Until the US stock market corrects, there is no crash. Until gold and silver reverse their long bear decline, there is no change in direction or fortune. Until a currency or nation emerges where global institutions can park their reserves, offer greater security than the US, a better rate of return and such access to a esteemed assets markets, there is no short term threat to the U.S. Dollar.
Equity markets rise for 90-95% of the time. Timing the shorts seems to stressful and fraught with danger to me. I simply prefer the obvious trends. The trends are always the obvious play. Why try to second guess them?
Jonathan I don’t know where in the heirarchy of posts this will appear as the ‘Reply’ link disappears once we are inset by 2 comments.
Sadly your ‘paradigm shift’ and Missisipi river example are soooo true.
God save us from politicos and bureaucrats….and it would seem well meaning Civil engineers too. Lol.
Haha purvez. Too true mate 😉
Allan, look at the Eurozone inflation figures today,
the ECB will be forced in to more aggressive measures,
China can act further at will.
Of course the equity party will end as they
all do in a new bear market, it is increasingly difficult
to see the beginnings of that this year imv.
I expect volatility for markets, we are right at the
prime point for that now.
Let’s see if the bears can finally gain some traction.
Mate European QE just announced is a miserly amount compared to what the US just did.
The fact is that US markets rallied on Fed QE, that is undeniable. The second fact is that Fed QE ends in Oct, also undeniable.
Without any other reason to continue past Oct the Fed WILL end POMO in Oct.
A market collapse would, on the other hand force the Feds hand and this is what I believe will happen Just as John has indicated markets will see a waterfall decline very soon.
The Fed will be forced into action, however this time around QE will not have anywhere nearthe effect that it had last time amd I don’t see new highs in 2015.
Either lower highs or a double top at the most.
The USD will not rally with further QE just as it did not rally last time. The ONLY REASON that the USD is rallying now is due to the anticipation of the ending of QE and speculators driving it. That is fanciful IMO.
Certainly not because of some perceived flight to safety. Watch the dollar collapse when US markets collapse and the increased QE via QE4 is back.
Just to add I would suspect that any further announced QE into 2015 and beyond would likely have less impact due to wanning solar influence just as per John’s research.
Andre.. Spot on track….
🙂
purvez, with all due respect Jonathon IS NOT a contrarian. Every man and his red dog are all over the USD, down on gold and bullsih US Stocks!
THIS is the contrarian play.
http://stockcharts.com/h-sc/ui?s=$GOLD&p=D&b=5&g=0&id=p62619993711
The ONLY reason the USD has rallied is due to speculation and perceived ending of QE and an inflow of foreign funds to buy US stocks on the theory that US GDP is going to support the rest of world…..to wit I say FAT CHANCE.
I agree Allan. My colleagues see what I’m seeing. I feel that I’m neither contrarian nor part of the herd. The jury is out here as sentiment is mixed across the media too. But I’m stimulated by this board as it offers me a different perspective. It’s always very healthy to see both sides and provides a reality check.
Jonathan, I’m curious about your perspective on European banks and QE (there). I’ve never understood why people have so much confidence in any QE type action the ECB takes there, when the banks ostensibly are still in such bad shape. Now if the ECB plans to buy back ABS from the banks at 100 cents on the dollar, thereby effectively recapitalizing them, then I understand how positive that action is. But merely acting to lower interest rates further (they’re already low) does little so far as I can see.
Precisely Gary, they don’t know what they’re doing. They should have let banks collapse back a few years ago and that would have been the best option. QE would have been a poor second choice but they chose the third option. To wait to see what happens leading to the now deflationary episode and scrambling to reverse it by issuing debt in a strengthening Dollar. Clueless. And this is what will bring down Europe. Too little too late. Mass unemployment throughout the PIIGS and rising throughout the core countries now too. Record low interest rates everywhere and no incentives for your people to start businesses. QE will achieve nothing. The capital will leave Europe immediately to seek positive rates elsewhere. It’s like pouring water over a drowning man.
J,
While it may be true that M Armstrong is political and has strong views, it is because he has a grave intolerance for those who are running this country…and for that matter the world…into the ground. But politics aside and gold manipulation aside, your views are identical to his. He has taught me a different and healthy way to view the world, as long as you can get thru some of the rants. As far as the SM goes, MA is very bullish. The dollar is rising due to capital flows from outside the US. This will likely continue as long as the rest of the world is imploding. Whether we get a SM parabola remains to be seen. I have no opinion at this time.
Thanks Alexa. I’m not against M Armstrong in any way. I simply regard him as a Historian of the financial economy, which is fine. But I find he contradicts himself on certain issues even though it could be down to his writing. To be honest, there are a plethora of individuals who share my view as I’m certainly not contrarian… only on this board perhaps. Any good trader will follow the money as will gamblers betting on sports events. My approach is no different but my work in Europe gave me a great insight into what is happening. You have to trade your edge, as the saying goes. I’m also awaiting the newspaper front pages we used to read back during the dot.com days where everyone is buying stocks, and all taxi drivers are offering tips. Until we get that, there is no froth in the market. We are simply nowhere near.
I only meant it in the context of our hosts point of view Allan.
Allan, I remain 100% in cash.
A market correction would be beneficial
on a personal level.
All my hope is not gone, yet )
but I try to remain objective as much as
possible, and the strength of buying on any
real dips is indicating big resilience currently imv.
Market dynamics can alter very quickly
and that is what I am hoping for,
but you can’t always get what you want,
as someone once said.
Phil, you said “The prospects for the bull market ending this year
are utterly remote imv.” If that is true, you should be long SPY even if the speculative IBB could be avoided. And on a correction, buy even more since the bull market is not ending.
Something tells me that you are giving a higher probability of the bull market ending this year than you are stating.
Somebody important didn’t like that 5am gold hit.
the game may be over soon
Allan, ref your bearishness on the $. It truly looks like the beginning of a major bull mkt, a 3 of a 3 in Elliott terms. Speculators are the buyers on the margin that drive the price. A good example is gold. After years of commercial speculators and producers trading being in a narrow range, the specs started buying heavily, and the producers started selling heavily. This trend continued until it topped out in 2010-11. Since then, speculators are buying less and producers are selling less than in the previous 8 years. As for the $, the speculators have started an accelerated buying program similar to what the gold speculators started in 2002. That is correct, it could last years. During that time sentiment, overbought conditions, etc are confirmations of the bull mkt, and the occasional oversold situations are strong buy signals. Another bullish aspect of the $. Think of all the QE’S, Zirp, deficits, etc and the $ bottomed 6 years ago in 2008. To me that is very strong relative strengh. Finally, the majority is correct during trends, and wrong at both ends.
Appreciate your thoughts. Firstly I don’t hold much regard for EW, it is way too interperative for my liking.
Secondly you are correct, the lows for the USD were 6 years ago, but let us not forget what has transpired over that time aside from QE and how the dollar has performed.
We had the European bond crisis, wars along with massive Japanese QE and the USD except for the last few months went basically zig zaged sideways to slightly up.
So QE appears to have definitely kept the lid on it whilst the above factors put a floor under it. That is why now, with QE ending the dollar is rising. The question that now remains is which way it breaks. At present most would say that is already decided andthe breakout is done and dusted. I think it is a fake out.
Cheers
That is one ugly monthly candlestick on the DAX. Ofcourse it could all change in the next 1 and a half hours …
I find it amazing the number of H&S patterns I am seeing that have already broken the neckline (DAX included), and yet I do not see pundits talking about them. This, to me, is a sign that it might actually work this time around.
John, don’t worry, I’m lookin’ at ’em.
I peronally can’t believe that people still think that the major indices are going to go to new all-time highs either later this year or in 2015 given that the R2K bubble has burst.
That was THE bubble market this time around, just as it was the Naz back in 2000 and before that Nikkei …………….etc etc.
That’s it folks….hold on to your hats! Get ready for all hell to break loose once we take out this level
http://stockcharts.com/h-sc/ui?s=$RUT&p=D&b=5&g=0&id=p91826779780
Duncan, in fairness you have made some astute short
term calls recently.
Steve T’s views are worth reading,
whatever your personal view.
He has just been so on the money recently.
I couldn’t find a Steve T. There is a Steve S lurking around and commenting though. 🙂 Is that who you mean?
Steve T last posted on John’s market breadth topic,
from memory.
Thanks for that Phil. Yes I’ve looked up his post and he is expecting an ‘ugly tuesday’ …. around the 1954 or worse mark.
I wonder if there is some way of searching across blog posts for a certain commentator?
John any chance of such a functionality? Quite often people refer back to an earlier comment on a different blog post and it would be nice to be able to dial in a name and get their last ‘n’ comments regardless of which post they were against.
Second that…
I have that functionality but wordpress doesn’t allow you to have it, for some reason. However, if you google solarcycles plus either the comment author and/or something specific they said, you should be able to locate it. If not, you can ask me and I can search for it and republish.
Perhaps I’ve answered my own question:
http://www.ft.com/intl/cms/s/0/7bd06522-48ad-11e4-ad19-00144feab7de.html?siteedition=intl#axzz3EoTUSSZi
Any one familiar with trading using the effect of high tides, low tides. Seems like the SPY moves in response to daily tidal volume, rises with low tides, and falls with high tides. Bullish on days with no hi tide during the trading session, bearish on days with lo tide during trading session. Like 80% correlation. Thanks.
Interesting. 80% correlation? That’s quite amazing actually. How did you arrive at that number? Did you review the data yourself? If so, how many trading days does your sample include?
Thanks for the tip! Good trading to you.
I post my tidal forecast every Sunday. And the correlation is higher than 80%. Key is to find the right station for analysis because most stations have so many harmonic adjustments that you can’t see gravity anymore.
Steve S which tides would you be looking at here? Near NY?
take at look at this link
http://time-price-research-astrofin.blogspot.nl/search/label/AstroFin
Thanks Carpediem for the link. It’s a bit mind blowing to take it all in, but does look very interesting.
prepare your souls for the reckoning is upon you!
just keep telling yourself that this is all real, full of meaning and NOT a video game! lol
I think the current price action in the commodities sector is giving more clues as to whether we’re in the early stages of a bull market or not. Key commodities trend-lines are being broken down this month. Take care those who are long.
Silver is in crash mode now which puts it on target for $14 and possibly $10 in 2015. The game is changing in front of our very eyes. $5 or $6 in 2016 simply isn’t out of the question.
As for gold, I can see $950 or $600 as a worse case scenario.
at least if youre going to plagiarize other blogs, give the link
http://blog.kimblechartingsolutions.com/2014/09/new-deflationary-ball-game-just-starting-to-pick-up-speed/#sthash.ejPk6NhX.dpbs
you know original personal efforts are the only way to survive THE VIDEO GAME!
lol
http://stockcharts.com/h-sc/ui?s=$GOLD&p=M&yr=13&mn=10&dy=0&id=p43817265112&a=367902834&r=1412098509853&cmd=print
the myth of the metals bottom persists
Calm down dear. It has Kimble Charting Solutions watermarked all over it. I’m using a mobile device.
elvis is always calm
except when he runs out of pills!
if you had clicked on the little box below Jonathan’s text, you’d see that that is a link to the Kimble charts. And yes, they do have their logo all over their charts. No plagiarism here, just a lot of sharing of info (including yours 🙂 which I personally find very helpful!
Hahaha!! ‘Calm down dear’…. that is sooooo Team GB!! Although in ‘bbe’s defence the watermark doesn’t show up on my screen at least. Best to give URL credit as well Jonathan.
Hey I hail from just south of Watford myself.
‘bbe’ you are ‘THE ONE’ here who shows a sense of humour….”elvis is always calm
except when he runs out of pills!”
And IMHO it ADDS to this site’s vibrancy. Thanks for your efforts as well as our hosts.
correct, keep shorting the miners and gold, they are just starting a bear market. Also, keep buying IBB and the QQQ and ride the trend. It’s very easy to make money in these markets.
Interesting to read you’re long NASDAQ Nicolas. Are you literally expecting a repeat of 2000/2001? Do you have any time or price projections?
Boy, take a look at the cumulative A/D for the Nasdaq – $NAAD – over the past year. Not a pretty sight…
what’s in a bear is IWM…metals will fall with the markets at first and then rally hard and fast long before the equities put in a bottom
mobile devices = VIDEO GAME!
anybody trading metals better have a really accurate short term mechanical system OR be willing to hold through further losses of up to 50%
http://stockcharts.com/h-sc/ui?s=$BPGDM&p=D&yr=7&mn=9&dy=1&id=p03108448056&a=367887989&r=1412098890185&cmd=print
How can one be misrepresenting work that is not their’s as their’s when the
address of the creator is in the image.
I really appreciate Jonathon`s contribution, and it cant be said enough: John’s incredible generousity.
Why did elvis ban you?
I was elvis and I banned myself for taking myself too seriously like you just did…
this is a video game, NOT direct experience
there is NO meaning to be found here
prepare yourselves, all who think there is meaning here chasing federal reserve notes
the sudden awakening will open you like a chasm and you will fall through your fears like cracks in the ice…
ELVIS NEEDS WHIP CREAM CAN GAS!
http://stockcharts.com/h-sc/ui?s=$GOLD&p=M&yr=13&mn=10&dy=0&id=p43817265112&a=367902834&r=1412101795474&cmd=print
And in went the 2:30 charge right on cue just as the R2K was dropping under critical support and the other indices began to follow. Wash, rinse, repeat.
whip cream gas and RED BULL!
Lol
Elvis, hon, get ahold of yourself!
http://stockcharts.com/c-sc/sc?s=%24SPX&p=D&yr=1&mn=6&dy=20&id=p55383512146&a=198771802&r=200
can’t remember who I plagiarized this from! about the only thing I can find in the confirm bull continuation file…
Andre – the tidal station I use gives:
9/20 H
9/25 L
9/30 H
10/9 LL
Peggy,
Not bad at all, but I have the high on 10/3 and the low 10/10. You’re doing well!
Cheers,
André
Andre I have no real knowledge or understanding of tides here but surely tides are associated to certain areas. So on that basis which tides are you guys watching and would the results ‘change’ if like the tides were on the other side of the ‘pond’?
Thanks in advance.
Purvez,
I think the location of the station on the planet is irrelevant. What is important is to realize that tidal stations were designed to calculate local tides; not gravity. Harmonic calculations are adjustments to reflect local circumstances. So what we want is a station that has as little adjustments as possible. Generally we find them in places that are close to the ocean; that’s where the water is coming from.
As gravity can take a few days to make a turn, I use 3 stations now that reflex this period. Sometimes they are in sync = sharp turn. But sometimes they are not = round turn.
Cheers,
André
Hey Peggy,
Do you have a link to that site?
Thanks for the explanation Andre. So its not the tides per se that you are looking at but the underlying gravity which affects the tides.
Is there something/somewhere for a beginner to start looking at this please?
http://tides.mobilegeographics.com/index.html
Purvez,
You are right. The tides are a proxy for gravity. It’s not the best way to measure gravity, but it’s the only one we have. And a big advantage is that the tides can be predicted, much better than with forces like magnetism or electricity.
But it is extremely important to find a station with as little adjustments as possible. The moon affects the entire planet and the earth is spinning all day. So every part of the earth ‘feels’ the same gravitational pull on a specific day. That’s why I consider location less important.
The link above is a great site with all tidal stations in the world. Just test a few all over the planet and look for the station that correlates best with the market turns.
Cheers,
André
Thanks very much for the explanation Andre. I also read yours and Kerry’s communication and that too is interesting.
Hi Peggy,
I factor in the distance as well as FM or NM. Have a look at this site which has the distance data. Note that the FM date coincides with the highest expected tide as per NOAA. I am using The Battery and have a low on 8/10/14.
https://www.fourmilab.ch/earthview/pacalc.html
Andre/Purvez – from what I have read the latitude has an influence over the circadian rhythm so I chose a tide station on the same latitude as the NYSE.
Regards,
Kerry
Kerry,
The stock exchange is a computer. Computers don’t feel gravity. It’s the humans that do. So you have to ask your self : where are the people that are electronically connected to the nyse, as they make the decision to buy or sell. And they are all over America or even all around the world. The stock exchange could be on the moon; it wouldn’t matter. It’s the location of the traders that does the trick.
Cheers,
André
Hi André,
Yes I agree that the NYSE is a big computer and it is the location of the traders that matters. But the majority of traders who control the big money are concentrated around the big exchanegs; Wall Street (lat 40d), London (lat 50d), Frankfurt (lat 50d), Paris (lat 48d) Tokyo (lat 35d) and Hong Kong (lat 22d).
Wall Street is the biggie and the other mains ones are +/- 10d. There may be a lot of traders outside of Wall Street in Connecticut, but that is 42d North so is in the range as afr as I am concerned.
So I believe that it does matter which station you use. But as you say, local geography influences tides as much as than the moon does so you need to pick your station carefully.
Regards,
Kerry
Kerry,
This info is new to me; something to think about. Thanks.
André
Kerry (also Peggy, Andre etc) – you mention the full moon coinciding with the “highest” expected tide. Is there a similar coincidence between lunar perigee/apogee and extreme high/low tides?
The reason I ask is because tides are not caused by gravity strictly speaking – but by the DIFFERENCE in gravity over different distances from the moon.
Also, the position of the sun accounts for one-third of ocean tidal movements. So it is all very complex, and your approach of looking at both tides and apogee/perigee seems to make sense.
Hi Mark,
It is complicated as you say and it seems to involve all factors and then some. There was a supermoon on 10th Aug (closest perigee of the year + full moon) and there was extreme tides around this period peaking on 13th Aug.
Also once we pass the autumn equinox then latitude (measured relative to Earths equator) is getting closer to the plane that intersects with the sun which I am guessing makes a difference?
So to answer your question, I don’t know 🙂 But I try to include a variety of variables and see how they pan out in real time.
Kerry
yes Mark – complicated but back testing it for the last 10 years is providing insights. There is a full moon/high tide cycle (FM/highest HT, FM lowest HT). The tides at FM have greater correlation to market highs and lows than do new moons, Q1 or Q4. Additionally as Andre has introduced – the perigee/apogee cycle has at least the 4.5 yr cycle but there are sub-cycles as well.
Thanks Peggy, that’s very useful. I have my own variable lunar cycle but don’t know why it works – hence the questions!
Kerry,
which site are you using for The Battery tides? also, you mention 42 N latitude – George’s Shoal (ocean tide) is very close to that latitude and I have found that it is useful to time the bigger turns but that Brooklyn Bridge East River (also am thinking that The Battery tides are very similar) are best for honing in on the exact time.
tia
Kerry – also 42N Provincetown is in agreement.
End of month and end of Q3 is upon us. If S&P 500 can close above 1964 (monthly pivot), as I mentioned in my earliest post, I will regard this as quite significant. And it may spark a reaction in these equity markets. I would love to stay up and watch the action but it’s late over here in the Persian Gulf. Bed time!
Carpediem – fwiw am using http://tides.mobilegeographics.com/calendar/year/752.html?y=2014&m=9&d=21
Peggy,
Have you also watch the correlation how high en low the water tides are…
This fishing timetable shows it very clearly..
http://www.tides4fishing.com/us/new-york/new-york-city-east-41st-street
So if the tides are right all hell breaks loose next weekt
Sorry,
I see it’s part of the correlation ,I will take another cup of coffee..
technically, the “high” is 10/1 but very early am.
Thank you very much I will compare it with the Nordsee haha…
I watch the bradley very closely because even the sligthest change in the graphic can make the difference today the line was a little flat but tomorow the down trens continues..till oktober 8… so there is a synchronicity..
I like the way the Bradley turns reliably mark changes in market sentiment, so I keep a chart of SP500 showing all 17 major Bradley turns (and whether they were a high or low in the siderograph) going back to early 2010.
It confirms that they often coincide with market turns (but definately not always). But out of the 17 turns, only 7 got the direction of the market right (8 were wrong, and 2 were arguable).
Mark, correct me if I’m wrong, but the Bradley doesn’t signal direction. It just indicates a turn is at hand.
Yes Gary, it only got direction right about 50% of the time (out of the last 17 anyway). In fact, it doesn’t reliably indicate a major market turn at all (it often does, but not always).
But it definately indicates that sentiment will change, so the periods between Bradley turns exhibit their own particular market characteristics.
Some ETF Fund Flow data: http://www.etf.com/etfanalytics/etf-fund-flows-tool.html?task=showETFFlowsData
Not too surprising to see QQQ with the biggest fund flow of 2014 so far at $7.3 Billion – but that is OUT of the ETF! Also, IWM (Russell 2000) outflow is $1.6 Billion. The overall picture could be argued to be mixed, but these are not the sort of figures I would expect to see near a top.
Close below 50sma on the SPX? Hard gap down tomorrow? We shall see …
VIX – a close outside the daily BB(20,2), followed by another today. Over the past few years, a close outside has mostly been swiftly followed by a fall-back inside. Not the pattern that we are seeing right now.
http://scharts.co/1mwE65U
SPX – second knock-back at the daily median line.
http://scharts.co/1mMUcbB
RUT – new low, look out below.
http://scharts.co/1qF8wBA
Thanks John.
So far the bounce off the 1963ish spx low appears to be corrective. Probably a “short lived ” wave 2. If so, it won’t last much longer before the powerhouse wave 3 down begins. I don’t have access to any breadth readings. If you have the time, is that something you could provide us on these bounces? I can see the pattern is correctional, but if the breadth was also weak, we would have a double reading confirming the rally as a dead cat bounce. Thank you.
Battery Park today high tide at 12:45PM, and market low at same time, clockwork?
Thanks Peggy for the link to the tides data.
Hi John, I’ve been less than enthusiastic with the direction took since early this year until recently. This is one of your better recent articles as it aligns with some major themes I’ve been following for quite some time.
I don’t know if you’re familiar with Piers Corbyn. He’s an astrophysicist based in the UK and he focuses on weather patterns. Interestingly, he believes solar cycles influence weather patterns. You can find out more about him with a internet search but, he’s been predicting a mini-ice age starting about now for quite some time. Some people don’t like what he has to say but, I do.
I haven’t been paying close enough attention to your blog to know if anyone has mentioned the book “The Fourth Turning” by Neil Howe and William Strauss (which was published in 1997). They believe there are four generational cycles, which repeat and the fourth turning is a crisis period that has been characterized by war. Not all wars occur in 4th turnings but, from a US perspective the previous 4th turnings were during WW II, the US Civil War and the US Revolutionary war. I believe a similar cycle has been documented with respect to England. It’s not clear when the 4th Turning started but, 2001 is one date some people use for obvious reasons.
I any event I think you’re back on the right track.
All the best….
Thanks
Russell 2000 Total Return Index: -4.41% YTD
Thanks all – new post is out
The rise of extremism has nothing to do with the economy in Sweden. The economy here did not suffer during the crisis and is the most equal. Why then is extremism such as Nazism rising?
Maybe someone can do a chart over new media and the rise of war etc. I think there is a correlation such as newspapers in the past and now Facebook etc.
I will give you that war seems to correlate with the sun but think it is way to simplistic to say it has something to do with the economy. Many wars started without the economy being bad. And there has been wars going on all the time.
The idea that Russia and China CAN sell their holdings of US treasuries is based on blog reading. First they need to get it out without crashing the market. Good luck with that technically speaking. Secondly, do you want to own the Rouble instead?
Or gold that will crash down to 600?