

The stock market topping process began at the turn of the year:


Speculation peaked in Feb/Mar along with the likely smoothed solar maximum:
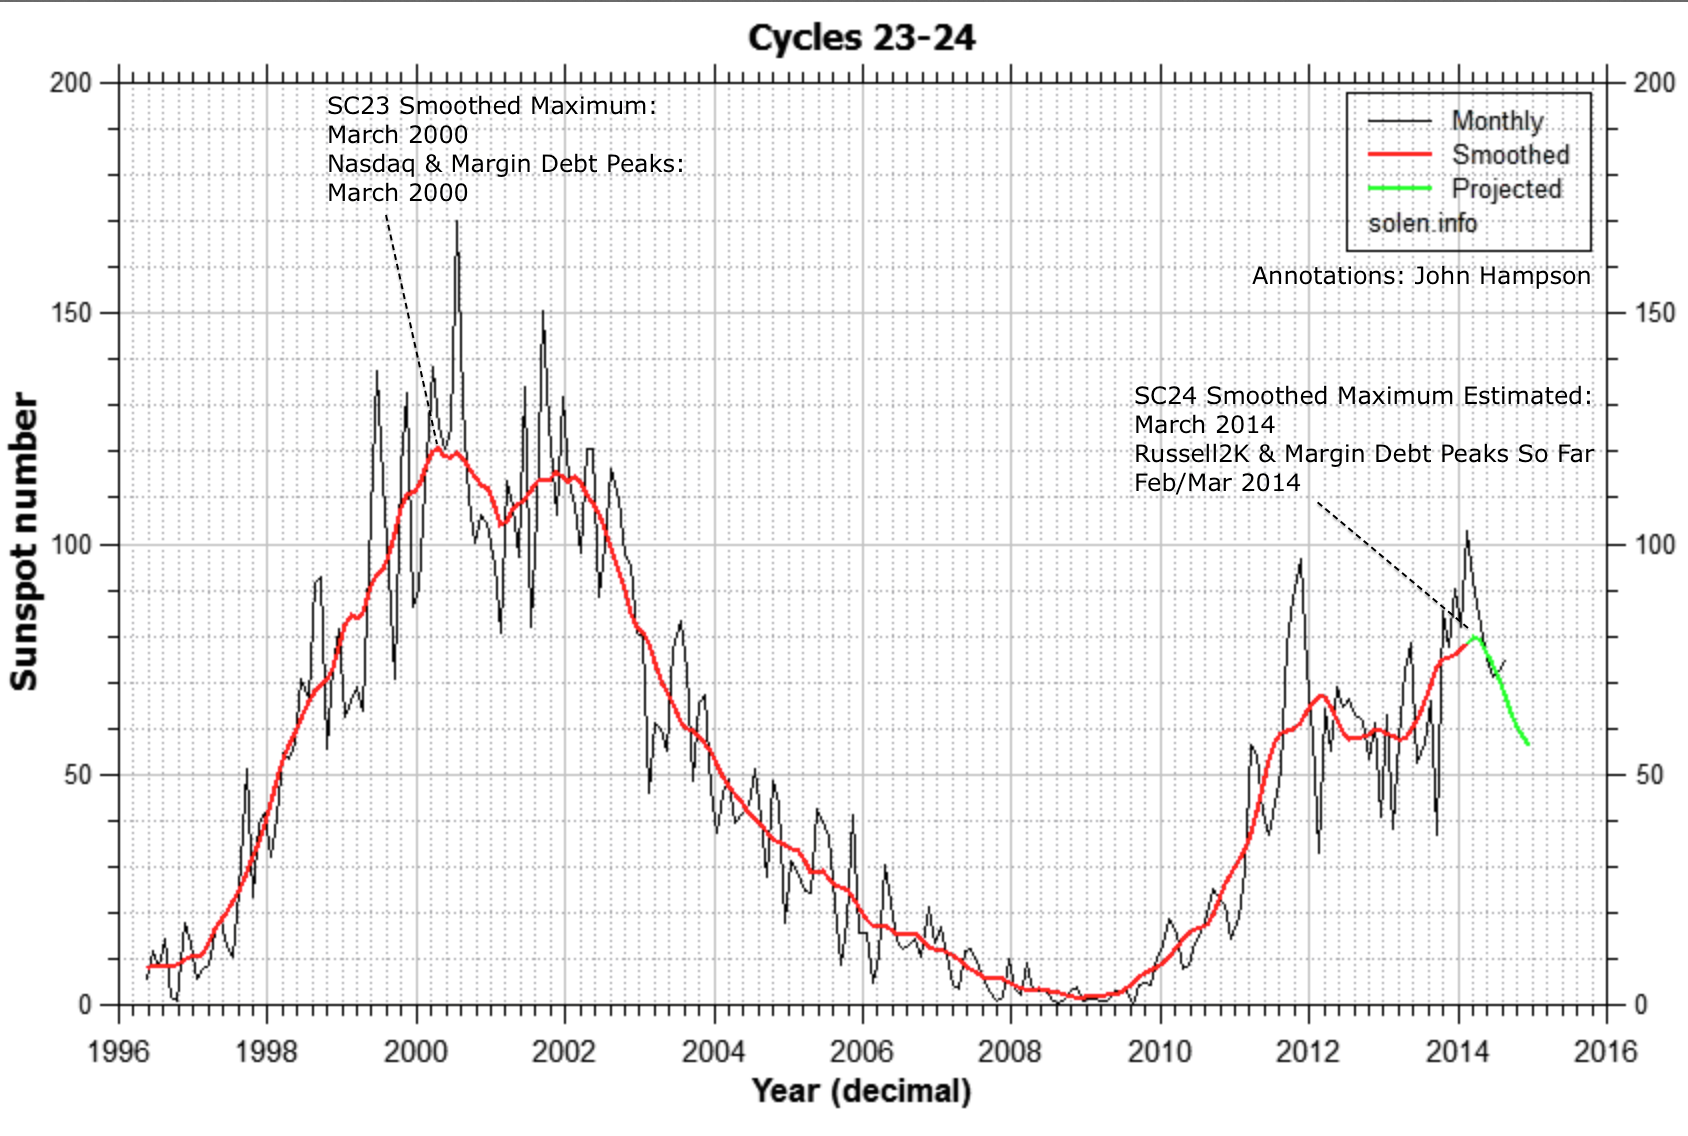
So, topping process phase 1: turn of the year risk peak; topping process phase 2: Feb/Mar speculation peak. Topping process phase 3: mid-year bubble end peak:
The major stock indices peaked suitably at the seasonal highs close to new moons, either side of the speculation peak epicentre:
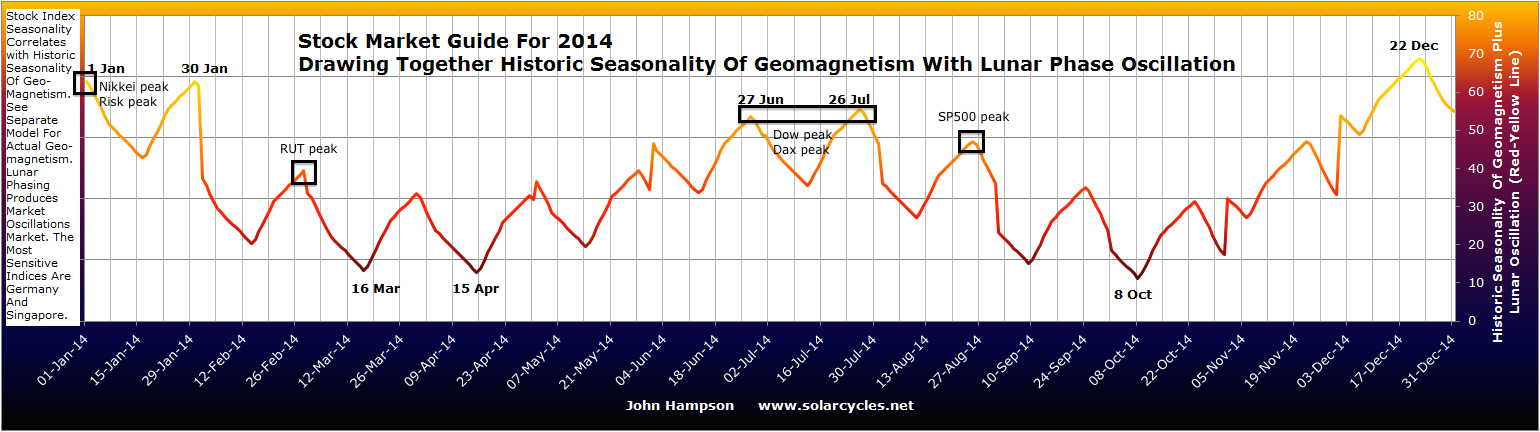 The SP500 and Dow peaks are tentative at the time of writing but the signals are promising.

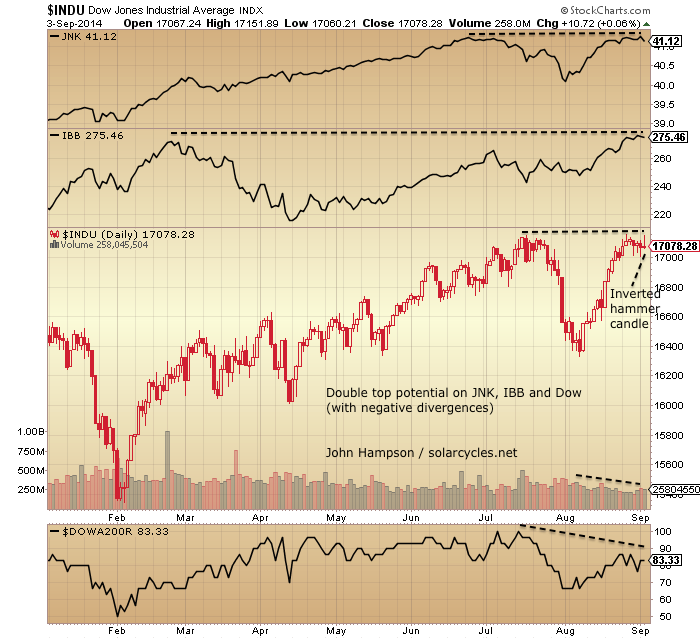
The Nasdaq has been the leader but also put in a potential topping candle yesterday.
Has normality now been resumed? By normality, I mean negative divergences, volume patterns, sector rotation, lunar phasing, excessively frothy sentiment and allocations would all typically pull down the market. But the power of the solar maximum has trumped all, keeping the market levitated despite these being in play since the turn of the year. If the market still continues higher from here, then the sun’s influence isn’t through. But if the solar effect on humans is now waning, then the market should return to respecting those indicators of an imminent correction, and in doing so honour the phasing of the topping process as outlined above with a final roll-over here, into the typical period for market falls, Sept-Oct.
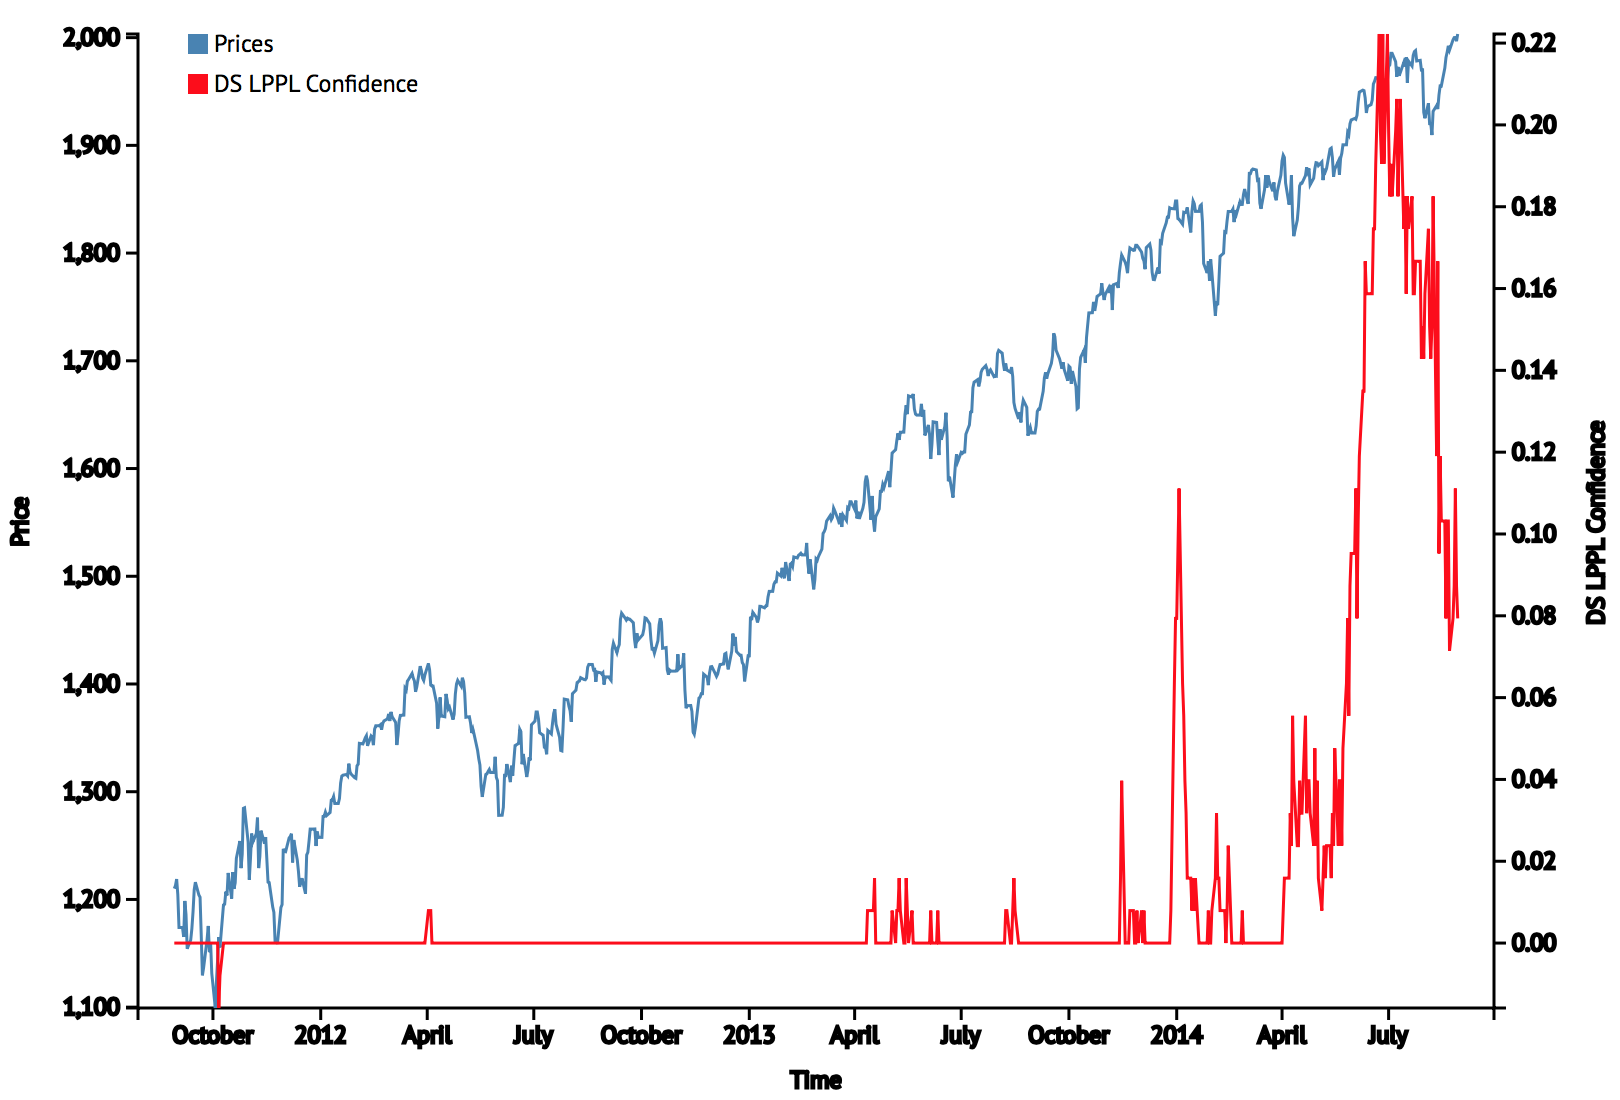
As previously noted, the aggregation of indicators and analogs suggests we should be in for a minimum 18% correction but most likely a bear market, and here is one more chart in support of that:


Thanks again John.
http://tallbloke.wordpress.com/2014/09/03/brightpoints-new-clues-to-determining-the-solar-cycle/
Interesting post on the latest thinking on the solar cycle.
LMAO, this is getting as ridiculous as 2000 in every sense of the word.
How many contradictions are in this article?
http://finance.yahoo.com/news/jack-bogle-fed-not-reason-203217043.html
And soon we find out what the walking contradiction Draghi delivers. European markets have rallied and currencies responded to his comments last month at JH.
Talk about back yourself into a corner. I wouldn’t trust this guy with my dog!
Either this reverses now on that spike or
many of hose short are likely to be pulverised
imv.
UKX looks to have hit about 6,900, incredible.
I think a reversal is on the cards today Phil. FTSE has been range bound for a couple of years now. Im not seeing anything technical that has altered this view.
I wish there was an edit function here,
as usually spot typos afterwards.
READ::::: anyone who has ever followed Princeton Econometrics (the grand daddy of cycle forecasting), he is forecasting the next major turn TODAY.
Paul, we were discussing MA amd his ECM a few days ago under another of John’s articles.
Yesterday’s MA’s blog entry on Fascist states has a couple of comments from Thomas Paine (1737-1809) and Cicero (55BC) which resonate very well in today’s age.
http://armstrongeconomics.com/armstrong_economics_blog/
Interesting. Is there a link?
John
http://armstrongeconomics.com/2014/08/27/phase-transition-cycle-inversion/
Thanks!
European QE is here! Draghi announces “to commence buying asset-backed securities”…
Yes. Closed my Dow shorts and just hanging onto my ftse short now. Complete sidelines with Dax although should have stayed long from 9200 rather than closing out for a small profit!! This probably marks the top for the Dow as is usually the case when I capitulate but oh well.
DAX is actually down in USD terms today. I guess it doesn’t matter from the contract that you trade?
Yes it is. I can see the euro weakening heavily against the dollar which will boost Europe growth and negatively affect US growth. Maybe the US will shift into eu style decline as their QE ends whilst Europe growth accelerates. It will become a battle of QE as to which economy is growing!!
“European QE is here! Draghi announces “to commence buying asset-backed securities”…
OPPS:)
The Germans will not allow any significant QE, UK and US had three huge rounds of it and expecting Europe to do the same, picking up the can when the FED cut off supply in 4 weeks giving a seamless flow of cash to prop up bad banks.
Saying that I was expecting a bigger rise pre press conference, and I would expect some kind of spike soon before the plunge.
See what the next two days bring.
But why is the size of the program not given?
John, how did you get a minimum of -18%? That seems rather specific, versus say -20% which we did get (-20.4%) in 1990 for SPX.
Dow 1929: 3 weeks 44% declines
Dow 1937: 8 weeks 38% declines
Dow 1968: 8 weeks 18% declines
Dow 1987: 2 weeks 34% declines
Nikkei 1989: 6 weeks 27% declines
Nasdaq 2000: 3 weeks 35% declines
SP500 2011: 2 weeks 18% declines
The divergences in risk measures, such as HYG:TLT, are 9 months mature and under previous such divergences we saw corrections of at least 17% (2011, 2010, 2007)
II sentiment aligns with 1987, 2011, 2007: i.e. at least a 20% drop
The readings and progression in both Rydex assets and margin debt position us in Q3 2000, i.e. at the end of the topping process. The SP500 lost 18% from there into the end of 2000 and then continued in a bear.
The last such period of levitation above the 200MA ended with a 19% drop in 1998.
Interesting! I knew there has to be a reason. Overall, -18% for the rest of the year (or to next bounce) makes sense, but certainly the panic lows should be lower.
I am looking at the same thing, but because I use retracements, a smaller percentage, The graphs that compare 2014 to 1929 scale the Y-axis for fit, for example. I am seeing smaller percentages, inline with the smaller volatility of the market. I am sure some indices such as IBB will get those large numbers.
I don’t understand why John was so obsessed about Volumes. His Volume data, probably, is from NYSE, which accounts for 22% of US stock market volumes. The biggest guy among US trading places today is the Off Exchange Markets as a whole, which accounts for 38% of US stock market volumes. http://online.wsj.com/articles/iex-to-apply-for-exchange-status-1409709842
However, I don’t think trading data in those so-called Dark Pools is easy to get. I figure this is why people are caring less and less about NYSE. Time has changed. The NYSE data has been less useful and sometimes misleading.
The NYSE volume data may, at best, reflect retail investors’ point of view. They are confused. They feel lost.
Accept your point, but there are still clues in the volume data, e.g.
Not convincing for two reasons:
1) Flash trading, which operates inside regular exchanges, and Dark pools have been increasingly skewing the traditional stock volume patterns during the last decade. Current volume data is not comparable to those ten years ago, or even five years ago.
2) Current volume pattern can be explained as People like buying low, but don’t like selling high. This should be what happens in a typical bull market imho.
Oh the other hand, volumes doubled due to HFT front-running. Basically, that volume in dark pools causes overall volume to double as HFT hold for milliseconds and is not economically relevant. I think the two effects cancel each other and just using NYSE volume is good.
VERY INTERESTING.
http://elliottwavestockmarket.com/2014/09/03/sp-500-and-djia-and-ebola/
There may be something with pandemics at solar maxima. This is flu pandemics recent occurrences:
very good John.
Solar Maximum. Enfemedad. Irrational Exuberance. It can be.
for example, now I remember the crisis in Greece where hospitals did not have the basic inputs to function.
of course it is much more complex, but it makes sense.
pd: sorry for my English.
Investors intelligence reports that just 13.3% of newletter writers are bearish, the lowest level since 87
This can’t continue for very much longer, something has to give very soon. Bears are capitulating in droves.
So Super-Mario delivers all that the markets expected (asset purchases) and a rate cut thrown in as a “surprise”. VIX is crushed and SPX gaps up at the open. So far so good for the Bulls. But the leap higher is looking anemic compared to the VIX crush, and it’s looking like a “buy the rumor, sell the news” event. It’s looking like diminishing returns are setting in on all the usual tricks (opening gap higher, smash VIX lower, etc.)
Allan, with respect you have said similar now for months
I considered there may be some downside risk over this
week and next, that is looking less likely now.
I admire you guys with the mental capacity to short this
because that must exert a daily mental toll.
No way could I do that.
Phil, yeah you’re correct in saying that I have been saying similar for months, but you are not correct that I am short. Aside from a being long gold and gold stocks I am currently also in cash. I was short but closed my shorts several months ago.
I am really tempted to go short but qyite frankly I really don’t know when this turns, but Phil surely you have recognise that there are so many reasons to be supremely cautious at this juncture?
This is not healthy, I don’t care how many analysts they trot out telling me why these levels are justified. We were told tne ssme thing time and time again in 99/00, told how we were now in a “new economy”.
Greenspan talked about “irrational exuberance” in 97 and then 3 years later failed to recognise the bubble for what it was.
I am very tempted to go short right now but I will wait a week or two, but under absolutely no circumstances can anyone convince me the virtues of going long at this abusrd level.
At some point many bulls will lose their shirts, because they will get locked into a downside move that will be equivalent to, or worse than the worst that we have ever seen.
You just said it: Greenspan talked about irrational exuberance in 97 and then 3 years later the market topped! Will we get a top now, when many are recognizing the current excessive bullishness, a.k.a. irrational exuberance, or will it come 3 years from now?
Adrian, its just another crappy EWT article of doom, yes there have been ebola outbreaks at 2000 2007 2014, what they forget to mention that there were also outbreaks in 76,78,79,89,94,95,96,97,01,02,03,04 etc….
Market topping on good news (ECB, Ukraine “ceasefire”) . Quite predictable as it happened many times before but nevertheless makes us to watch it in amazement again… patterns always repeating themselves. Small ending diagonal in S&P that started on Aug 28th is complete now at 2011.
That should mark end of wave ‘5’ of 5 of wave III that has lasted from Nov 2011. There should be immediate and dramatic reversal from diagonal that itself has represented final distribution phase since end of August. I expect S&P 1850 in Sep-Oct and reattempt at the top in Wave V in January or March 2015. Then crash should follow later in 2015;
Regarding gold, its failure in 1270-1280 support zone makes things very negative for the metal. Unless it gains strength immediately, preferred scenario is now much lower for gold, maybe even to the 900-1000 zone.
woman beheaded in London!! is it isis returning home, this could have horrendous effect on confidence
similar action to yesterday. sticking with my case that the top range is in (will likely revisit after pull back that starts very shortly). on the look out for down close both today and tomorrow. weak knee-jerk opening wont hold. hopefully.
encouragement for the long term bears out there (including myself) who are holding through this mess. we will get the best of this batshit crazy market in due time and these battles will seem insignificant.
Seems like this is a bears den…everyone is short. That makes me uncomfortable.
Allan, the short comment was not directed at you,
it was just a general comment.
My point was that I personally could not manage
that mentally.
Today’s action reminds me of the trading cliche that what everybody knows is worthless. Now everybody knows everything’s great: ECB is doing QE, rates will stay negative/zero forever, unemployment is 6.2%, earnings are beating (reduced) profit estimates, global capital flows favor US markets, China will grow at 7.5% a year forever (and will game GDP to insure that), blah blah blah. So the question is: what is not widely known? That’s the only valuable information.
Two days in a row that open with a gap higher and then fade does not suggest strength. Also, by my count this is Day 19 of the latest upleg. Most fizzle after 10-14 days, and few reach 20 days. This is a very simplistic observation, but it backs up the idea that markets roll over not because things are bad but because the move exhausts itself. If all the good news is out and known, what’s left to push markets higher?
Irrationality is left to push markets higher. Remember that cliche……remember everyone saw the dot com bubble in 99 but it pushed higher into 2000, everyone saw the housing bubble in 06, and it pushed higher 2007, everyone sees this QE bubble but it pushes higher 13, 14, and maybe into 15.
Good point about irrational blow-offs, but if I understand John’s analysis, he’s saying the market topped in early 2014 and the 8 months since is the speculative blow-off phase you describe. IOW we’re not in Sept. 1999, we’re in March 2000. That so few believe this is possible adds weight to the probability IMO. Bears are at record lows, bullish sentiment is at extreme highs. Even the most ardent bull should be wary of those stats.
Poor people are being ignored and/or exploited. Workers are not seeing their share of the pie. Racism, religious polarity, and mistrust is on the rise. There is something much bigger brewing that economic indicators can’t predict, and interest rate adjustments can’t solve.
Similar to times in the past. gold goes south before markets do. It sure looks like the case today.
Disagree with some board members that there are too many bears. I believe that most bears have already capitulated. Sentiment chart shows the lowest bear level since … 1987.
Of course the Gold Price is manipulated, that’s the point!
http://news.goldseek.com/GoldForecaster/1409860800.php
Maybe your right, a bear is a rare thing now.
No more bear for the bulls to eat, maybe they will to eating each other soon 🙂
Roll over, Beethoven! Glad to be long VXX, SDS, TZA and short JNK.
agree with charles. if US QE => stocks up, then EU QE must be the same, right? not so fast. would have liked to see an even bigger pump and dump today, but action is still looking good with a similar day expected tomorrow. sept/oct is looking up.
massive gap down monday
We still have Friday?
If VIX is at point where even new spx highs do not see vix lows as previous cycles have done, seems that you would not be able to lose if you buy big vxx dips, even if market has not seen the tippy top.
In other words market top is not important as fear bottom.
An overwhelming majority of you seem to think there are no bears left. Try looking for them in these two places:
1 -your own comments
2 -amongst traders/investors who you know are definately putting their money where their mouth is: http://www.ig.com/uk/ig-indices/wall-street/prompts/DAILY
There, you will find three Dow bears with open positions for every bull with an open position.
Instead, almost everyone is maintaining their fixation on surveys of newsletter gurus, blog preachers and dinner party wafflers who naturally always claim to be bulls after the market has been rising. Why do they do that? – because it makes them look as if they’ve been making big dough!
Mark those two places cover about 0.01% of global investors and so thinking that represents what everyone else thinks is completely false. Bulls out do bears by 8:1 so there are incredibly few bears out there. IG is mostly traders so on a 2% drop you will see everyone become bullish again.
Good point, but do you think there is any relationship between # bears and market peaks?
Three daily kinda bullish hammer-like candles give way to two shooting stars and a bearish key reversal today. Held by the line.
Sometimes it’s easy to overthink what is staring you in the face.
http://scharts.co/VG7rhi
John, posted important thoughts about demographics on “Last 30 years” post. No need to repeat here, but they do deserve your acknowledgement in upcoming post. Thanks in advance.
I will, thanks
Extremes in sentiment tend to correlate strongly with bottoms/tops in VIX and markets… sentiment is tricky because prudent longs will buy puts as hedges at critical support/resistance levels and seasonally risky periods (like now). So heavy buying of puts does not necessarily reflect bearish sentiment–it’s largely hedging.
Ditto calls on VIX–a form of hedging/portfolio protection.
To judge outright bearish bets, we have to look at individual stocks rather than indices or widely held ETFs. Maybe bearish bets increased after the 4 billionaires revealed their bearish books….
usd/yen hit the 61.8% retracement from 2007 to 2012 move which stood at 105.60 and it held. Should be important for the reversal of the carry-trade. Double top in the pair as well (Dec’13 and now).
Some initial thoughts …
A lot of internet chat last night about a ‘top’ and if you look at the SPX daily chart we’ve had two bearish candlesticks in a row. If bears dont follow through today i think bulls will take this higher out of the range we have been stuck in. Interesting to note that the transports put in a ATH close yesterday. If Dow theory plays out it could be risk on.
you’re right, always have two side of thoughts.
I have 9/16-17 on my mind which may give us a high based on the cycle studies.
That’s week we will have (1) Alibaba IPO (2) option expiration week (3) FOMC meeting that will all moves the market in a dramatics way (4) our previous high 7/24 + 55 fib no = 9/17
apple, I am also looking to a high to coincide with the Alibaba IPO. I do however think they have to take the markets down first to work off some of the extremely overbought momentum before tsking back up. Whether we make higher highs remains to be seen, but I think we are down into mid week next week and then higher into the W/E the 19th. After that it’s game on.
My tides say a low on sept 11 and then a high on the 18th and down again for a low on the 26th. So, both of you are right 😉
Not sure they have to pull the markets down Allan. Overbought conditions have been worked off by high basing for the past week. Last two bearish daily candles are the perfect bear trap.
Wouldnt supprise me if we close the week at SPX2000+
Duncan, where would you place your downside stop if you were long?
If i were long say SPX1991 i would put a stop at 1984. 😉 Its bullish friday and nfp are usually up.
1980 is support so y 1984
Rob, with respect you did ask that no gurus posts their trades and now you are looking for a reason for a potential trade idea of mine?
Anyway, the reason is that I have support at 1987 – the old closing high. First line of defence is 1991 which seem to be holding for now. If 1987 is lost that shows bulls are getting weaker. Stop is 3pts lower than that to allow for slippage.
Im no a permabull based on my recent trades. But i do think we are approaching an important top.
Duncan,
Thanks for elaborating why you put your stop at 1987, very details and makes lots of sense.
Much appreciated and have a good weekend all.
Your trading looks spot on to me duncan. Good calls fella…way to go!
Just pondering to myself over the ECzb decision. I doubt that there would be hardly anyone that has begun trading in global bond markets in the last decade that would know how to correctly assess risk of any kind.
In fact I doubt there is hardly anyone period that can with what has been done in recent years. Global bond markets are a complete anomaly of what they once were and what they once provided.
I shudder at the thought of what these central bankers are doing to the global markets. The ECB has guaranteed that the next crisis will be far greater than any before it.
God help us all.
The pattern still allows for a dip to 1985ish (4th of previous degree) to complete a wave 4, then a w5 up to a new all time high.
An alternate count is a 3 legger wave 5 ended Thurs. ( Dia. Tri.) But, the pattern is still leaning toward a dip to complete a wave 4 here as the more likely pattern choice.
The wave 5 up could target the 2020 area to finally complete this crazy bull market leg.
wots NFP
non-farm payrolls
Fri morning begins a turn window for stocks. This turn window supports a wave 4 low into the 1980’s es ( 1985 es would be the perfect target). Then followed by a wave 5 higher into next week.
Actual Previous Survey (i) Forecast
Non Farm Payrolls AUG 142K 212K (R) 225K 227K
usd/yen breaking back down into decade long down-trend channel. Should be meaningful. Hope Biotech continues negative price action from yesterday.
Secular bull market ?
http://www.safehaven.com/article/35003/a-new-10-year-cycle-begins-soon
Remember bulls have had two bearish daily candles. If they cannot pull markets down today i think we break significantly higher and confirm the high base breakout. They are up against nfp up days stats and bullish friday. Just my opinion.
I agree…if bulls can show strength here, we probably have another leg up. A lot of markets peak 1Y after the solar maximum. A 1/2015 peak is not out of the question.
Holding flat 9/2014 would be a victory, like 9/1928, and shows that the rally can go on for another year till 9/1929 or in this case 9/2015.
That will be inline with a bullish Y3 of the presidential cycle in 2015 — the same as 1987 which is also Y3. A strong rally even if it does crash late in the year.
http://stockcharts.com/h-sc/ui?s=$$EMPLOY&p=W&st=1994-12-14&en=today&id=p93522253675&a=358956170&r=1409927031427&cmd=print
someone said it yesterday – markets top on good news and this is a juiced market with nowhere to go but down.
the last couple of months have been a massive bull trap and as usual has every tom dick and harry thinking it will never come down.
agree – very nuanced market when you look closely. The source currency of the carry trade (use/yen) only touched its golden ratio retracement (61.8%) correcting the move from 2007 to 2012 last night which the Dec did not quite hit. Today the pair is back in the l-t down-trend channel dating to the 90s(below 104.88). Very nuanced market but bearish.
food for thought: rising wedges galore: http://blog.kimblechartingsolutions.com/wp-content/uploads/2014/09/joefridaysmallmidcapsmonthlymoat2007levelssept51.jpg
For those short, this may be helpful. I saw an informative chart that showed $GE (General Electric) as a guide to US indices. When $GE made a lower high and broader equities made a higher high, this divergence typically played out with the market following $GE. Really any divergence between these two signaled the broader market move.
FWIW, $GE is nearing a death cross and putting in a lower high. Could be significant, could be hogwash. The suggestion is that lower prices for US equities is coming. We’ll see.
Crude is still trying to hammer out support and $HAL is drifting lower finally.
Charles have a look at Russell on the 4hr too it broke rising wedge then went back up, kissed underside of wedge then fell back, classic technical short signal
1159 needs to break now
Great place to add to shorts now at S&P 2004. Gold is still not completely lost bet but only if it recovers 1280 the outlook may brighten for bulls
Next two hours of trading are critical as it will form the weekly SPX candlestick. Currently a doji.
Looks like new highs real soon.
If we close SPX2005 or better tonight i would agree with you.
Yes the bears got demolished by the bulls today but it’s quite easy to do that when you have 7/8 times as many bulls as bears. I think we could go higher from here though unless we have a bad Monday. I’ve reopened a small Dow short again and will look at next week whether to cut and run or hold a bit longer.
yes you’re right, doji again, last week one for week was 8/25 a doji as well
so there were two doji and if break up then should be a strong one
I think 1 more small dip 1998 ish then 2030, bullish sentiment at all time extreme!!
How stupid ARE these people?
How long will it take them to realise that if something isn’t working that continuing with more of the same is useless?
Who appoints these idiots?
Have they been looking at Japans example the last 2+ decades?
We are completely sunk folks, we have got absolutely no hope.
http://finance.yahoo.com/news/u-needs-more-inflation-feds-kocherlakota-says-010200359–business.html
As I suspected, it certainly hasn’t been easy (in terms of signals) to short the market over the past 10 trading days. It’s rare to have 9 days in a trading range, and the SPX crossed 2000 at least 9 times in that span. Interesting that the SPX has traced out a megaphone in the past 5 days–wider swings up and down. The new closing high may well be the “all clear for the next upleg” –or not. A descending wedge would have been more bullish than a megaphone. Monday will be “interesting”–the drama continues. Extremes get more extreme.
Thanks John, good work. SP continues to follow the pattern near perfectly. It could have dropped a few points lower than 1990 todaybefore taking off if it had wanted to do so. Now we have to watch for a 5 legger up. When it is complete, we will see a big correction. Maybe a very big correction! This 5th wave up could approach the 2020’s before ending. But rather than predict the price level, it may be best to just count the legs.
Please, What pattern are you referring to.
Good call Duncan.
Thanks …. new highs next week imo. Confirmed high base breakout. As charles mentioned a close above the daily trendline resistence too. Expecting gap up and go monday. Transports closed out the day and week at ATH. Dow should follow with new ATH if Dow thoery is respected.
“As noted yesterday, we can count five waves up from SPX 1905 to 2011. Today’s low, and subsequent rally, is probably the early stages of an even larger pullback. Some suggest a 38.2% retracement to the 1973 pivot, and others a 50.0% retracement to the 1956 pivot. As long as the market holds one of these levels we can expect an extension of the current uptrend to follow. Should the market break below and hit SPX 1905, Primary III probably ended and Primary IV is underway.”
More downside likely near term according to Caldaro. He favours upside thereafter before Primary 4 starts: http://caldaro.wordpress.com/2014/09/05/friday-update-412/
Looks a good call and matches what I’m witnessing with the cyclicals I track (EZJ, TCG, BDEV) all of which appear to be in a head test.with more upside and time required before a roll over.
DYOR, WTFDIK etc.
In 2013, the Chicago Mercantile Exchange included the centrals banks as their customers.
What a market !
I don’t believe that the “indicators” means anything workwhile anymore.
http://www.zerohedge.com/news/2014-09-05/whats-point-hiding-it-any-longer
Good lt USD Yen Chart. Current position is similar to just before the ltcm crisis and us housing blow up with violent reversals of the carry trade.
Conventional TA is mostly bullish, and bears are back to hoping divergences finally matter. I have put chips on both sides in the past 2 months, and confess the past 9 days of range-bound trading, and the past 5 days tracing out a megaphone have surprised me. Just sticking to TA (setting aside the proliferating narratives, which John Li ably listed in a recent post), there are numerous bullish indicators and other than divergences in indicators (which can get more divergent, even when they’re extreme), the bear case has thinned. Has this been engineered? A case can certainly be made for that–it’s easy to program trading bots to leverage SPY calls when key support levels are hit. But setting that aside, what’s the strongest evidence that a bearish market turn is at hand? The USD/yen carry trade? Until it breaks, maybe not. This is not a rhetorical question–I’m curious what others see that I’m missing.
The megaphone traced out over the past 5 days suggests another leg up to the 2014 area in SPX, followed by a bearish downturn, the fulfillment of the megaphone, which is a bearish topping pattern
What do folks think about the actions from the ECB on Thursday? I think Draghi changed things. This comes straight after the FED ends their QE program so a correction if any is likely to be mild imo. We all know not to fight the FED so what about the ECB?
If you look at the past two years everyone from demark to cycles experts predicting a correction or crash have been proven wrong.
Hello John,
It’s been a long time since impact posted in here. There is a lot of talk about whether we are bull or bear and the jury remains out. Of course,until anything major occurs, we remain in a bull market.
I spent many years in Europe working and so I have many friends, former colleagues and one or two family members I speak to regularly, who have their ears to the ground I think. The black swan has always been Europe and I think we are going to see this come to fruition, but not in the way that many think.
In a nutshell, I believe we are going to see the Euro fall to almost parity against the US Dollar over the coming year or two as Europeans try to get capital out of the continent. I’m seeing it and hearing about it. The ECB will flood the market with Euros going forward and this will provide the next leg up for equities. My brother-in-law is currently unable to get his Euro savings transferred into UK Sterling without a 20% immediate taxation being imposed by his two Spanish banks. He is needing to be creative but either way, it is costing Europeans. There is a tax grab going on around the world but most notably in Southern Europe. The fact that precious metals are not reacting to all of this suggests to me that the stock markets have further to go.
Do I think markets will correct therefore? Perhaps. 5-10% maximum. The Euro will collapse certainly and I cannot see Pound Sterling being in a happy place either, over the next year or two. I expect the Pound to follow the Euro in its flow to the United States. Therefore, I’m short the Pound and Euro, hence long the Dollar.
And for this reason, I see a US stock market bubble emerging over the next 18 months. Where else can capital go, other than government bonds? It has to be equities. It will not sit in cash accounts with bail-in policies becoming more and more evident across the world. I honestly would not be surprised to see the Dow over 20,000 next year, and possibly higher. These are changing times and we are heading into a new paradigm. I’m not sure that what has passed before us will have a direct bearing on the future. QE is distorting the markets, as negative interest rates will in Europe and I think we will see capital fleeing the Eurozone and into North America.
We may see market crashes in Europe therefore but I will be going long the Dow once it breaks out of this consolidation phase. This is where I think we are at the moment. I don’t trust UK banks never mind European banks. I am now holding cash offshore in US Dollars as I think we are in for interesting times.
With Scottish independence gaining momentum too, the UK may be in a worse state than Europe before long. Westminster cannot afford to lose Scotland, and most certainly, neither can Pound Sterling.
Many thanks, Jonathan! This is one of the most valuable comments I’ve ever read in this forum. I would say, your thoughts are based on common sense, simple and clear.
You said ,”My brother-in-law is currently unable to get his Euro savings transferred into UK Sterling without a 20% immediate taxation being imposed by his two Spanish banks. ” Can you please give me more details? Any Tax must be based on laws in Europe. Is it a new law or just an old one but with suddenly bursting enforcing power? How to calculate the taxation? 20% on nominal funds would be unimaginable in Europe. Is there any personal issue involved in your brother-in-law’s taxation case?
If the Spanish Government charged 20 cents for every Euro transferred out of Spain/Euro Zone, it would be a very big issue. I haven’t yet read this on newspapers, so I want to make sure I fully understand what did you mean.
Thanks again!
No problem at all Michael. I don’t know the complete facts but I do know my brother-in-law and my sister were trying to get 40,000 Euros out of Spain to put towards a house purchase in England. The two banks, were he was holding the money, Santander and BBVA, told him that international transfers were taxed 20% at the point of transfer, whether directly to a UK bank, or via an intermediary such as FTT Global , for example. Therefore, had he transferred the monies, he would only have received 32,000 in their UK account. This is now wide scale throughout Spain as EU banks are now forcing citizens to keep their money in the Eurozone. They are obviously trying to prevent a run on the banks, which is happening anyway.
Interestingly, a colleague of mine here in the Middle East, an Italian, is taxed 20% for transferring money back into Italian banks. The money is taxed instantly on receipt by the bank. This is across the country now, and not just one Italian bank. Therefore, nationals are taxed on money being sent back into Italy and this may be the case with the other southern European countries too. This is clearly not meant to prevent capital flowing out of Italy. It is a tax grab. Pure and simple. The European banking system is on a cliff edge. Make no mistake. We are on the cusp of something major in the Eurozone.
That’s all I know about it as I haven’t spoken to them. The southern European economies are operating under austerity measures so I would assume that these tax policies are instructed by the ECB. These are then passed down to the nation states, and hence all banks. Portugal is operating under the same guise. I have been told you are taxed 20% for transferring Euros out of the Portuguese banking system too, into another currency. They are, in my mind, trying to stem Euro deflation and bank runs whilst fleecing citizens at the same time.
We are entering interesting times. Things are changing and for that reason, I expect capital to leave the UK and Europe, not to mention Russia too, and head Stateside. I cannot foresee any other honey pot for capital that the US Dollar itself, or US equities.
Jonathan, I’m stunned by the information you provided. It’s worth a lot for me. Thank you!
I know what you said about your relatives and friends is true, but I still feel very hard to believe this is a kind of TAX.
You said, “The southern European economies are operating under austerity measures so I would assume that these tax policies are instructed by the ECB. ”
As far as I know, the ECB doesn’t has authority to Instruct tax policies, although It, just like you and me, or any newspaper guy, may suggest such actions.
The 20% looks pretty much like a TAX, so it probably is. If it is a TAX, there must be a law, in every independent country, to authorize it. So, Spain, Portugal, and Italy must, respectively, have their own law on it. These laws should be public information. It’s very weird that people know the 20% by hear and say, but not by newspapers or government officials. These kinds of things should happen only in a country like North Korea.
It’s worth digging deeper on what is going on in Europe. Those are, by any means, desperate actions, which could also mean potential macro-opportunities for speculators.
By the way, my email address is GREENRIVER.AMC@gmail.com. If you wouldn’t mind, we may exchange info/ideas further.
Thanks again!
In time, it will be the US’s turn that its Ponzi scheme starts to fall apart, so where will the world capital flee to? Who is the last man standing? The creditor nations, who have been hoarding real money such as precious metals, resources, and other hard assets.
Hi Jonathan
Just a short post this time. Found that not all tidal stations can be used for forecasting. I’m inclined to say MOST are not usable. Reason: they were built to predict local tides. And that is not the same as gravity. Sandy hook gave the top Sunday last week and Reedy point Tuesday. The real top came Thursday.
Good news : a new procedure for selecting tidal stations pointed out a clear winner. I won’t disclose which one because this could be the breakthrough I’ve been looking for so hard. Now everything changed. Now I see new things I have never seen before and suddenly my inversions are sharp as a knife. And this station gave a high on Thursday and an inversion on Friday. And that is what really happened.
For now : a low on sept 11th and a significant high on sept 18th. This is when Scotland will vote it’s way into independence and recession.
Stay tuned; next week a longer term forecast; you ain’t seen nothing yet……
thanks Andre. question – least gravity = high in markets (apogee, new moon, lowest tides) and most gravity = low in markets (perigee, full moon, highest tides)?
tia
Peggy,
That’s right; strong gravitational pull gives a low in the market. Weak pull is high. But be careful with short term apo/peri; I think tides are more reliable for short term gravitational analysis. Strong pull gives lowest low tides and highest high tides v.v.
Andre…With out going into a lot of words….I really believe you are on to
something good and big!!
Thanks 🙂
thanks Andres. so strongest pull creates highest high tides and lowest low tides (or highest low tides? and weakest pull creates lowest high tides and highest low tides (or lowest low tides) ? tia for helping me understand this – it’s subtleties are tricky. 🙂
It takes some getting used to. But the strongest pull gives the highest high tides AND the lowest low tides, A weak pull gives the lowest high tides AND the highest low tides.
Cheers,
André
thank you
Humm, the Moon is most perfectly aligned and on center with the earths equator on the 10th, and is at its maximum above the equator but turning back on the 18th. It will be Interesting to see what happens, and in which market. Also, FWIW, the geocentric Bradly model shows a slight change in direction on the 10th and 17th. The heliocentric Bradley model does not show a change in trend (only a change in rate of trend). The last time there was a change was July 15 (major) and July 29 (minor) and August 5 (minor) when both Geo & Helio changed.
Thanks. Should be an interesting week!
Funny that you mention Scotland vote on 18th sept, my paranoid relative in Scotland who wants independence is worried that there will be a mini disaster just before the 18th.
Designed to scare the hell out of the Scottish so they remain in the UK, not saying a market crash at all ,but something that will concern them so much it will tip the scales in favor of staying within the UK.
News this morning was that the most recent polls showed a 51% majority for independence – for the first time!
Anyway, the tides predict a high on sept 18th. So something will be alarming.
Have another significant high oct 18th, so no crash yet. But what would happen when the UK leaves the EU?
And what would happen if Germany leaves the euro (now Mario has gone wild)?
Things are clearly getting unstable. The next couple of months should be interesting.
Andre,
Thanks for your post. I do believe there is some logic in this tide logic because every time it gives some match to the historic pattern I use :-). My pattern says top in S & P 500 on 19th Sep (alibaba effect?) After it says down up to 20th Oct 2014.
Jigs,
Thanks. Yes there IS logic in these tides. Between the two tops I expect a real bottom on okt 9th. Could be a flashcrash starting sept 22nd.
Remember; oct 12 core of the lunar wobble + 1 week is 18/19.
Cheers,
André
A nuclear accident at Faslane, perhaps – that should convince ’em! Errr…
Dow daily – boring you with the same chart again, I’m afraid: http://scharts.co/VG7rhi
The last candle is always the most important one – and we have a minor bullish key reversal (following a red candle, a lower low and a higher close). The bulls are back in control. Also note that they have regained the red median line and also springboarded off the support of the declining purple parallel. So back in control then.
Dow weekly: http://scharts.co/1tCgGOI
The upper parallel has been regained, but painting an outside up period in the process, which can mark a termination coming at the end of a move up, just as at the end of a down move it is bullish. With the long wick, it’s also a hanging man, another sign of tiredness.
Shadowtrader explores market patterns and internals to conclude that he’s “cautiously optimistic”.
Dow monthly: http://scharts.co/1hokdoL
Likewise here, you see we painted an outside up period for August, which comes around a top, as it means the bearish pressure is increasing – there has been a reversal attempt. And look at where it came – N.B. this is a very old chart, I first drew these lines over a year ago…
Dow monthly: http://screencast.com/t/xJvzBLbe [cache]
Want to see a bullish chart? There could be 300 pts upside on SPX monthly – we have the same outside up period for August, the difference being it comes with a spring off the upper parallel: http://screencast.com/t/T7Qap9CSP5Qx
SPX monhtly: http://scharts.co/1rWMrPa [stockcharts]
Funny how SPX 2300 is also the latest estimate by Barry Bannister. The final work for the “Bullish Stragglers”
http://www.bloomberg.com/news/2014-08-19/stifel-strategist-predicts-17-rally-s-p-500-by-year-end.html
Bonus chart – FTSE daily – has been range-bound for many months, so if it breaks out… http://scharts.co/1qF6CB0
Bonus chart #2 – RUT weekly – multiple crumbs of bear food here:
– bearish key reversal
– turned back at the median line
– colour divergence: red week cf. green for Dow & SPX
– spike high divergence: failed to make a new high cf. Dow (n.b. SPX made new high already the week prior)
http://scharts.co/1ARDMS9
Bears wanna know why they are getting screwed?
http://www.zerohedge.com/news/2014-08-30/its-settled-central-banks-trade-sp500-futures
inverse head & shoulders on RUT target 1340 or could be double head & shoulders
I am sure I’m not the only one keenly interested in John’s next commentary/analysis–
I definitely agree with you Charles. Johns site here, his analysis, and the comments of many others here are always anticipated by me.
Thanks both
André:
Would the US buoy data be of some use to you?
http://www.ocean-pro.com/htmfiles/bouydata.htm
Keep analyzing. Lots of people listening.
Earth.
Earth,
I appreciate your help. And don’t worry; I will keep analyzing. It’s not waterlevels I’m interested in. I want gravity. Now I am focusing on the 8,8 and 18,6 year lunar cycles ans how the 4,4-ish yearly cycle fits into this.
André
Jas Jain has always been a good source. I do not always agree with his timing, but his trend calls are usually good. I do agree with him on rates going lower. I think that we will see negative treasury rates in 2015.
http://www.safehaven.com/article/35060/the-battle-of-the-titans-on-the-33rd-anniversary-of-the-greatest-risk-adjusted-returns-in-anglo-american-history
I also like to go back into the archives, to see what their calls were prior to previous events. He was right in 2006 about the housing and debt collapse, but wrong on a depression and the timing of the recession. Too early.
He underestimated the power of the Fed, and of greed. On the other hand, how do you predict a silent depression?
http://www.safehaven.com/article/5778/the-pause-that-depresses-recession-to-begin-within-six-months-and-depression-prior-to-2008q2
On a different note, I’ve come around to the idea, that the dollar will continue to strengthen, while gold prices increase. It is not about the USA anymore, the US is now along for the ride.
New post is out.
Thank you all for your responses and comments. I read every one.