
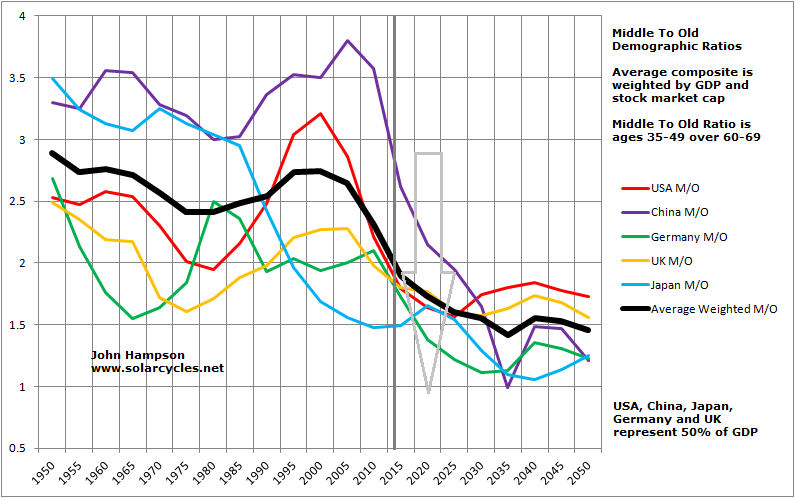
MSCI world equity index valuation chart for the last 30 years:
Source: Investec
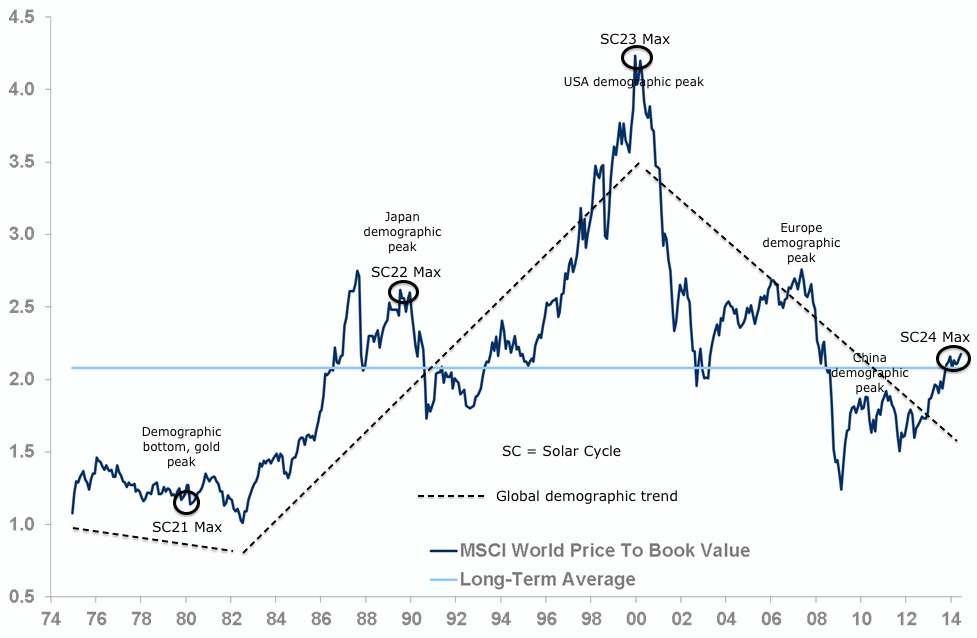
The overall dotted line trend matches the black global demographics composite in the next two charts:
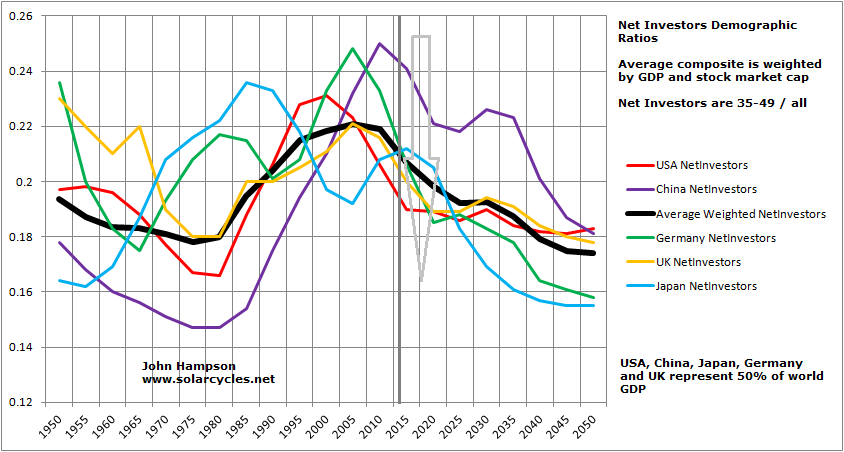

Conventional analysis of equity valuations considers cheapness relative to history and averages as a predictor of returns. But valuation has to be considered relative to demographics, or rather, long term trends in valuation ARE demographics. Expensive will get more expensive if you have an increasing swell of people in the right age group to buy the market, and vice versa. By global demographics, we are destined for cheaper valuation yet, and the current bull rally is a counter-trend solar-maximum-inspired speculation peak.
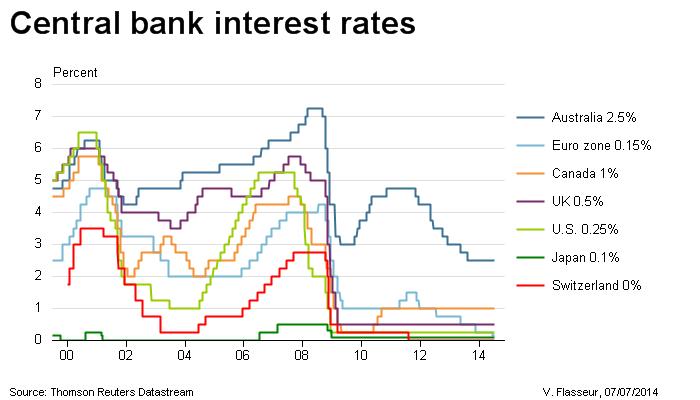
The MSCI world index is weighted like my demographic composites. Therefore the US demographic peak was the most important peak and put in the main top. Since then Europe and China have joined the trend change, making post-2009 the most heavy collective demographic pressure yet. Accordingly, we have seen interest rates held at unprecedented low levels due to the resultant economic weakness.
If demographics are so dominant then we should see evidence in the current counter-trend bull of major weakness under the hood, which we do.
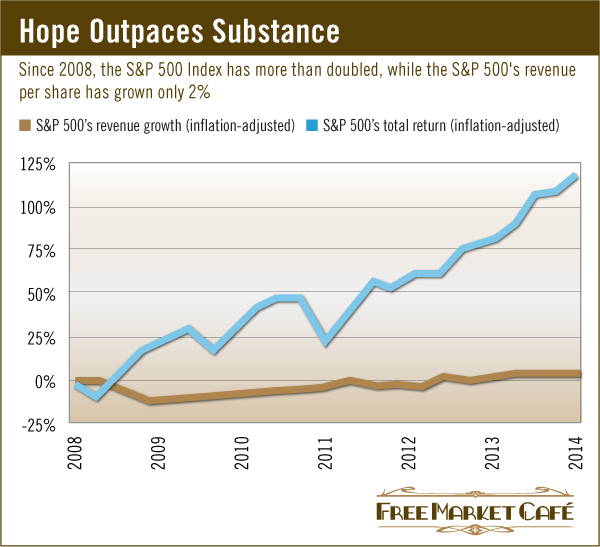
Whilst the SP500 has grown 120% in real terms since 2008, real revenues have grown just 2%. Companies have engaged heavily first in cost cutting then in buybacks. Sales remain elusive.
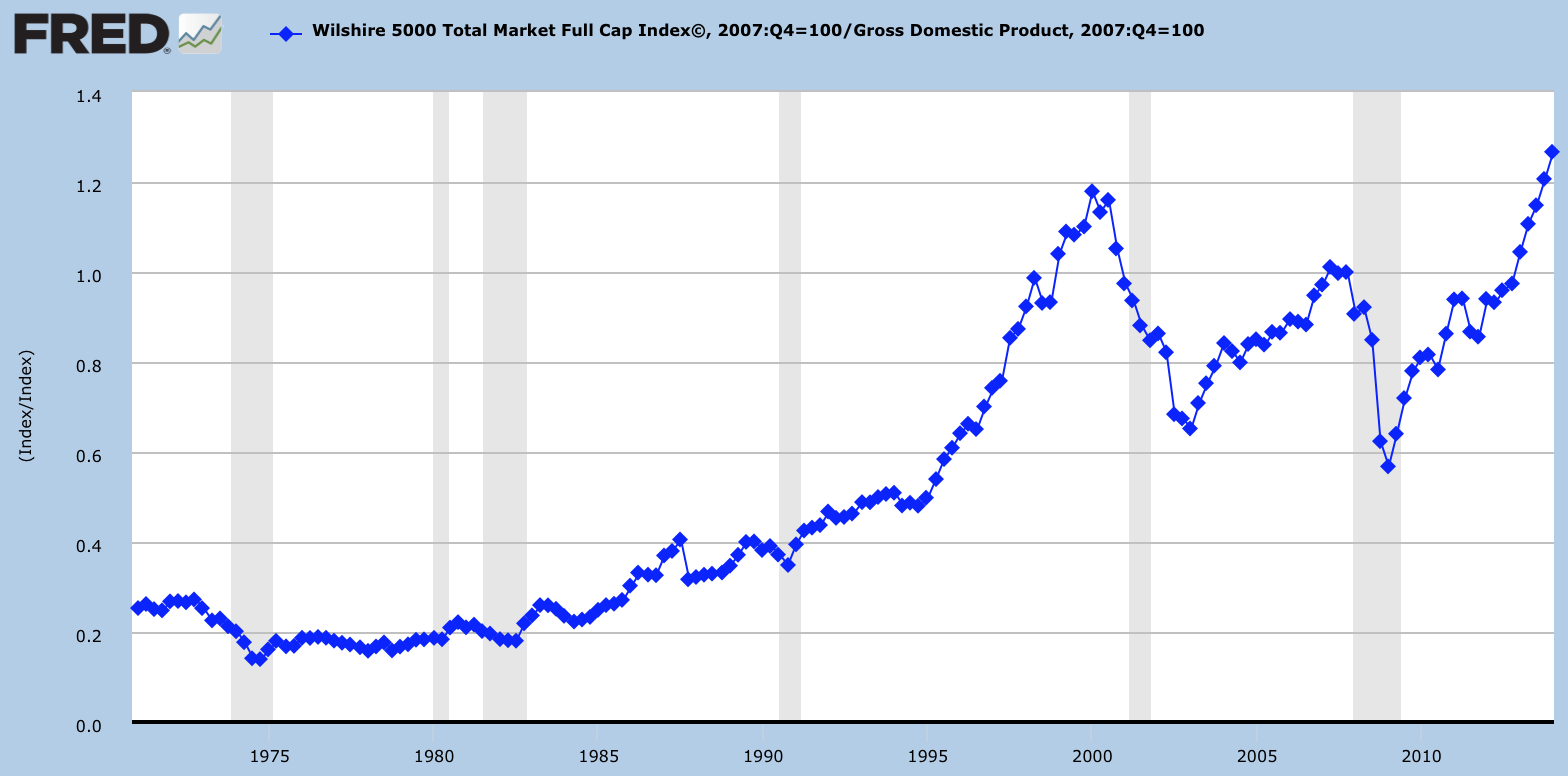
Also, the last 2.5 years in US stocks have been over 80% multiple expansion versus less than 20% earnings expansion, and this price-based rather than earnings-based expansion in equities whilst the economy has remained weak has taken stocks cap to GDP to an all-time record:
With a dwindling pool of stock market buyers under demographics, the market has been bid up on lower volume and increasing use of debt, taking the latter also to a new all-time record:
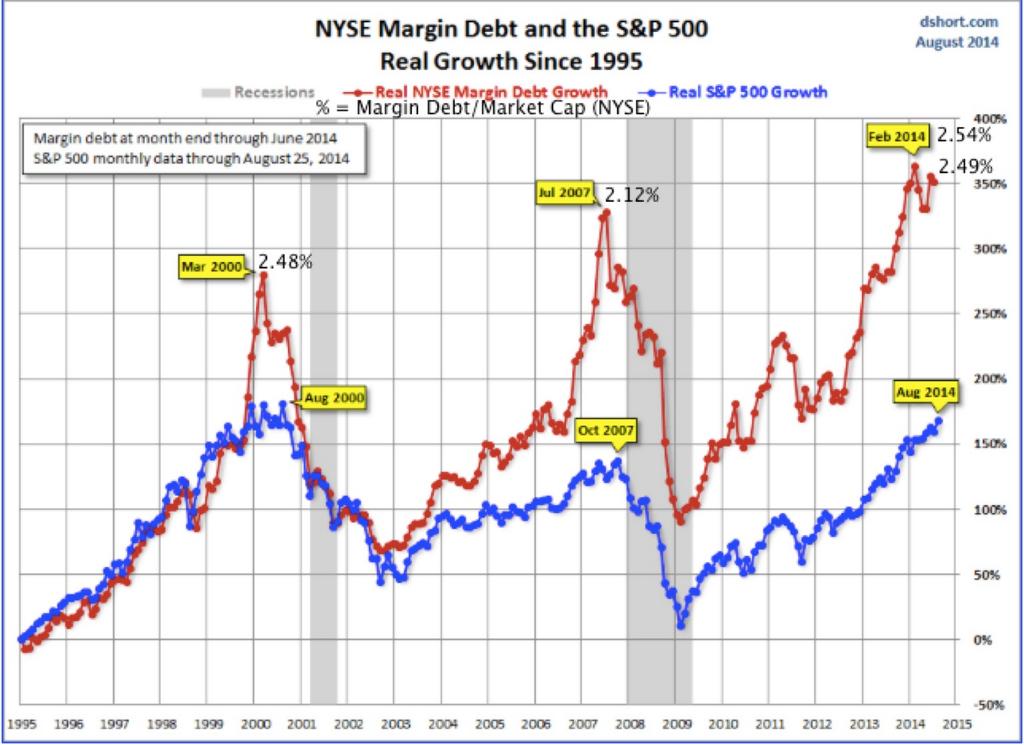 Source: DShort / UKarlewitz
This mix of unhealthy attributes has taken stock market risk to an appropriate record:
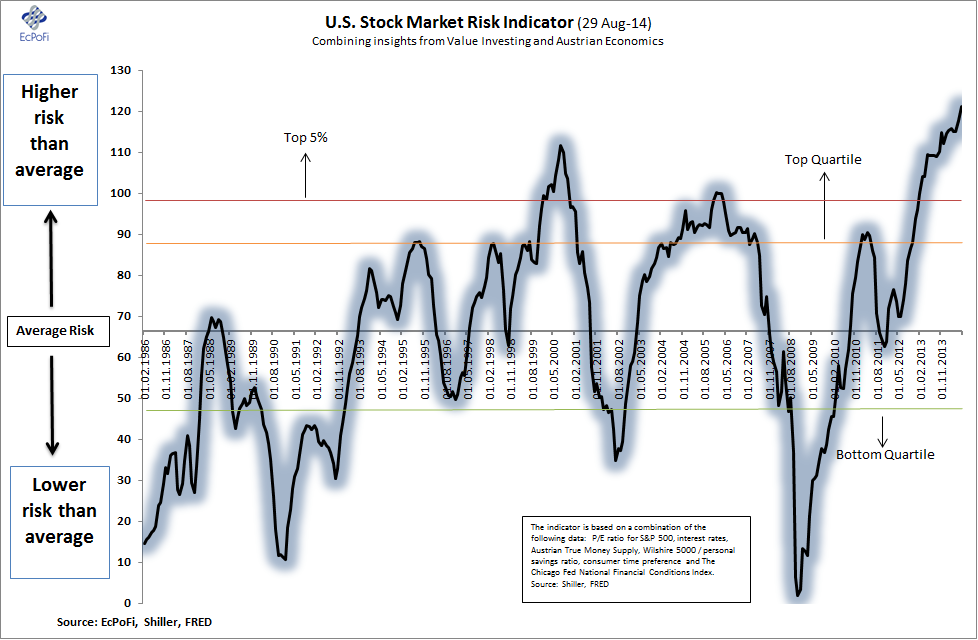 Source: EcPofi
In summary, the stock market rally since 2009 has been built despite demographics, largely through QE money, stocks buybacks, private investor leverage and a speculative pull into the SC24 solar maximum. But accordingly it is a rally at high risk of total reversal, it is a tower of sand.
It is the unprecedented collective demographic downtrend now in place between USA, Europe, Japan and China that make it so potent. World trade is depressed and each of these areas is struggling individually. Europe is on the cusp of deflation and recession. Japan’s Abenomics is not working. The USA, although outperforming currently in certain measures, is still operating at a lower all-round level of economic performance versus previous decades. And China, the last to tip over the demographic cliff, is now facing a bursting housing market and shrinking growth. In the 2000s China was driving the world economy, offsetting the USA which had gone over the demographic cliff. Now the world economy has no driver, with India’s economy still too small to offset all the majors. It makes for a negative feedback looping that ZIRP and QE should be powerless to stop.
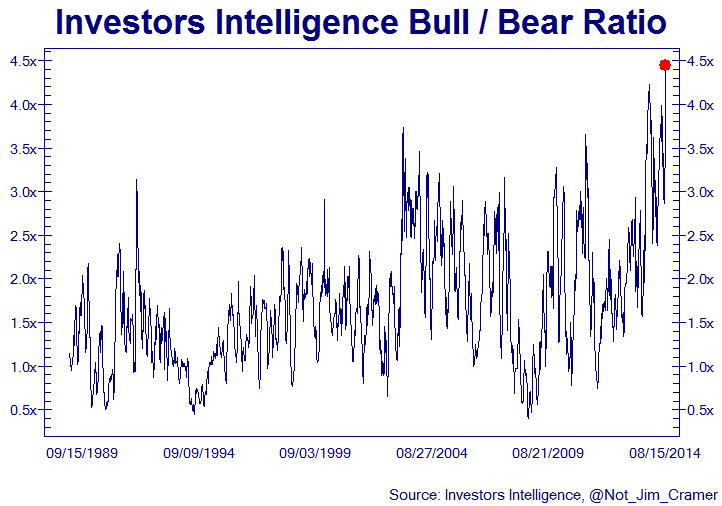
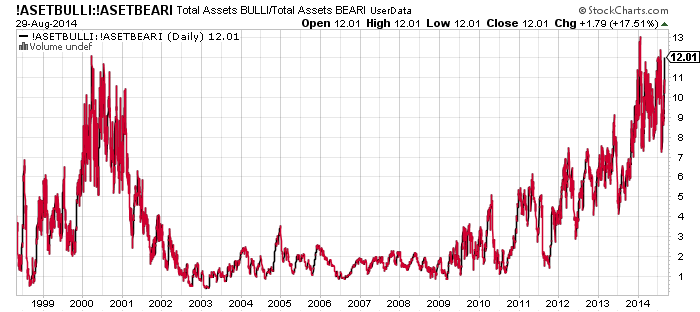
Turning to the near term. Froth has gone back up to the max.
 Increased volume did return yesterday post Labour Day, to test the validity of last week’s rise. Indecision was the result, so we roll over to today. The market is up so far with a burst on Ukraine peace news. Recall the Bin Laden top? Bin Laden captured and killed 2 May 2011, the market burst up, closed down and it marked the top for the year. With the Dow, JNK and IBB all still at double tops, it could go either way here. So let’s see how today closes.

John, another excellent post! Many thanks.
However, just this morning we have yet another new all time high in the SPX. Do you have an SPX price that will cause you to close shorts and move to the sidelines?
We’re currently in the lunar negative period with another week to go. If the market continues sideways/up for the next week, then look out! The next lunar positive period could see another 100 SPX point move to the upside.
Thanks Pima. If the Dow breaks upwards (plus JNK) and SP500 cements its breakout this week (plus IBB) despite negative lunar and excess froth and neg divergences and with volume returning post labour day then I may close out and wait. Am assessing day by day.
thank you. I hope you make a fortune in these markets!
Thanks John. As I recall, you were going to close out your shorts if markets remained up after this week. We still have Apple’s launch, ECB and job #s due this week. Since our ISMs, profits, etc still are showing very positive results, are you still planning to exit if are up by next week? I believe you said you wanted to stand aside and watch the parabolic phase at that point. China is going parabolic despite a bad recent econ #s. Thanks in advance.
As per above
The companies that are thriving are selling shadows: miracle cure pharma, free social media/advertising, oil/gas that nobody is using except by those that are drilling for oil/gas. A tower of sand indeed.
I am bearish but I see the pharma inventions as doing a lot of good for mankind.
Some good. Vast majority is boner pills and depression meds, from what I see from tv ads.
Lol, the more things change, the more they remain the same. I seem to remember economists saying the same as this guy just before the last recession.
In fact the head of the worlds’ largest central bank didn’t even see it coming.
http://finance.yahoo.com/news/smith–only-a-recession-will-end-this-bull-market-and-there-isn-t-one-coming-195055361.html
Good post, I have trying to convince John on a related point or two privately. I would not say a bull market will continue onwards but it will not crash and drop to John’s demographics relative positions either. That would require a change in credit and money supply via tightening. Demographics are tightening over the long term as is a weaker solar cycle for decades to come. All of this has been forecasted. Only education will decouple finance and demographics from natural forces; not likely to happen without more research.
Market internals saying dhragi wont dissapoint. Long SPX 2005
duncan, the indices are looking extremely overstretched. I suspect that they’ll have to take some heat out if they want to run it up to the Alibaba IPO.
Thanks Allan. My indicators are pointing to at least SPX2017 tomorrow.
We are also seeing a high base breakout confirmation on the SPX depending on if we close out today at the high.
Quite close to ditching my short position and remaining on the sidelines. Quite a shame if we don’t have a meaningful correction as John’s analysis using solar cycles would then cease to be correct in such rigged markets. I personally think markets will remain rigged forever as there is no going back from this level of manipulation. The market knows central banks will do the maximum to prevent another recession and hence investors are fearless and probably the ones with brains remaining long.
Would be fitting for 2009 to mark the top, just as March 2009 marked the low.
would be fitting indeed. We are in the classic bubble pricking window beginning of september (gold ’11, S&P ’00). Stalling in midair it seems this am. usd/yen has put in 2 touches each in its now clearly defined topping rectangular pattern. Markets and FX are free to reverse here and now.
The entire global financial systems future will depend on whether the new I-phone is cool or not.
they also need to do more than just bigger screen more memory etc
john, what do you make of this
articlehttp://www.financialsense.com/contributors/cris-sheridan/financial-stress-measures
I would argue that they kicked off coincidentally with the market rolling over in 1998, 2000 and 2007.
Closed my long at SPX 2003. Loss of 2pts. Reason is market internals have not improved – they have got worse.
really
Was looking at very short term market internals (hours). They look to be improving at SPX2005. However, they got worse since I entered my long. Hence, closed my short. Happy to admit that trade was not good. Minimal loss though.
Doesn’t make sense…you were not short, how do you close your short?
Typo. I was long not short.
The most influential demographic guru should be Thomas Robert Malthus(1766-1834). He was wrong.
Duncan, pls lets not have another guru on here telling us all his trades. thanks
Agreed.
No worries Rob. Wont post any more trades.
Rob, posting one’s trades does not make one a guru, nor does it imply that the poster is aspiring to be a guru.
Duncan, I actually like to see what other traders are doing, so I appreciate your taking the time to post what you’re doing. But if others here don’t want that, so be it.
I, too, enjoy reading Duncan’s views if only because they often provide a contrast to the overall bearishness here (an antidote to my confirmation bias). That said, I understand Rob’s position. Duncan, what about continuing to post but without the trades and have a separate blog with trades? I understand it’s easy to setup wordpress. Just a suggestion.
Post away Duncan. I too like to see how others trade.
GL.
PS http://tallbloke.wordpress.com/2014/09/03/brightpoints-new-clues-to-determining-the-solar-cycle/
Interesting post on the latest thinking on the solar cycle.
Someone calling out their swing trading on here with transparency and reasoning is welcome by me. Day trading, or secretive methods, or no ‘objective’ case provided, less so, because none of that fits.
On this day in 1929, the Dow topped out at 381.17. It would not see this level again until November 1954.
Big red candle on AAPL today. I do hope this doesn’t mean that the new iPhone 6 is a stinker – I have been holding out on upgrading since the 4S…
AAPL – http://scharts.co/1qcTeoZ
AAPL – http://screencast.com/t/0Hhupcit [cache]
25 years to regain that level, an entire generation. Buy and hold would have sucked. However, buying on a regular basis, say every month, or every 3 months or 6 months, throughout that 25 period would have made you very wealthy.
weak highs today. crazy how this close seems important on a down 2 day. you can almost feel the line being pulled.
All indexes indeed look very toppy. Closing at the current lows produce bearish candle patterns on the day. The NDX-100 has 5 waves up complete, perfect time for reversal into a correction imho.
Nice charts too:
http://www.seeitmarket.com/market-sentiment-who-let-the-bulls-out-13751/
“In just a span of a few weeks we go from pure panic to a lot of excitement”.
Like I said they have to take some heat out of this market right now before the run up to the Alibaba IPO. My guess is they take us down for 3-4 days and then run it up as hard as they can until after the IPO. Whether we get new ATH’s remains to be seen.
Now wouldn’t that be the irony to end this bull market? The biggest IPO in history to cap off all the IPO’s of the last few years coincides with the bull market top.
I like the way it resonates with 2000. History doesn’trepeat but it certainly ryhmes.
Please excuse my spelling and grammar. I know it is abysmal quite often.
John, you mentioned that you were still short and waiting more information. Do you think today’s move was encouraging? Or is it all due to just one stock AAPL?
Encouraging. Broad-based, inverted hammer candles, higher volume.
This is the least believed bull market in recent history.
Good luck to all.
By least believed you mean the lack of young folks quitting their jobs to daytrade? The lack of millennials interested in buying stocks?
I wonder if there was a sense of euphoria in Japan post-1990, and yet there has been boom and busts. Is that just demographics?
I keep hearing least believed but I would like to hear a concrete measure of this, so that we can determine how much of it is just demographics.
John,
You’re in good company…http://www.zerohedge.com/news/2014-09-03/icahn-soros-druckenmiller-and-now-zell-billionaires-are-all-quietly-preparing-market
Major negative divergences observed in all indexes today. I strongly believe that the crash or significant correction is around the corner, within days or at most weeks, just like the strong case that John has built over the past few weeks.
John Li: I believe that you will need to book your ticket to London to buy John a drink soon, very very soon.
I don’t believe John is in London any longer!
Haha I am completely serious about it too.
The faintest of glimmers of hope for the bears,
which may be quickly extinguished by the ECB.
Interesting day ahead, may be, just may be.. ?
Thanks all.
There is very skewed positioning in the Euro that would fit with a Euro rally on Draghi disappointment. We shall see shortly.
Draghi reduces rate by 0.01 and the Euro swoons? No QE or anything just that and the Euro swoons? Sorry to keep repeating myself but I’m having trouble believing my senses.
Cut your tower of sand in half. The way you are measuring the sand is pre-QE. Do that, and it will be more realistic. We have discussion to that effects in the past. 2011->Forward perhaps. Even then, the central banks are still managed by humans influenced by solar cycles, thus is QE3 a result of solar mania that could collapse. Not seeing main street mania from solar cycles this time around. Jackson hole concern raised about hoarding cash and money velocity down. Those folks are not buying stocks. Bull rally has 2-3 years left. Think 2018 or 2019. Old metrics are going to cost arm and leg to bears and shorting options. If history is a guide John I’m totally wrong, but I did point out other day that US Fed QE terminating will affect housing and commodities. If Draghi does go Abenomics will it make up for drop in USA Fed QE? I spot this as the only potential recessionary crash trigger pending in next 6 months. Credit will dry up.
“By global demographics, we are destined for cheaper valuation yet” true, but inflation via QE interaction in MBS market is influencing this. A USD today is worth 2 USD tomorrow is true of demographics. The depreciation of world currencies so more currency to a declining demographic allow increase in prices of stocks which in turns portrays a healthier market then it really is. This in turn convinces folks to leverage risk here. Hence cutting tower of sand in half.
You cannot argue that money supply will be tightened simply because there are less people in the world. Hence, we may not see inflation or deflation but just zero as QE paces demographics. If QE outpaced demographic decline equates to inflation Just a more births to lower money supply equals greater velocity or inflation. Lower births or lower QE is deflationary but if QE continues on par with falling demographics expect status quo for much longer.