

1. Put-call extremes plus negative divergence as per previous peaks:
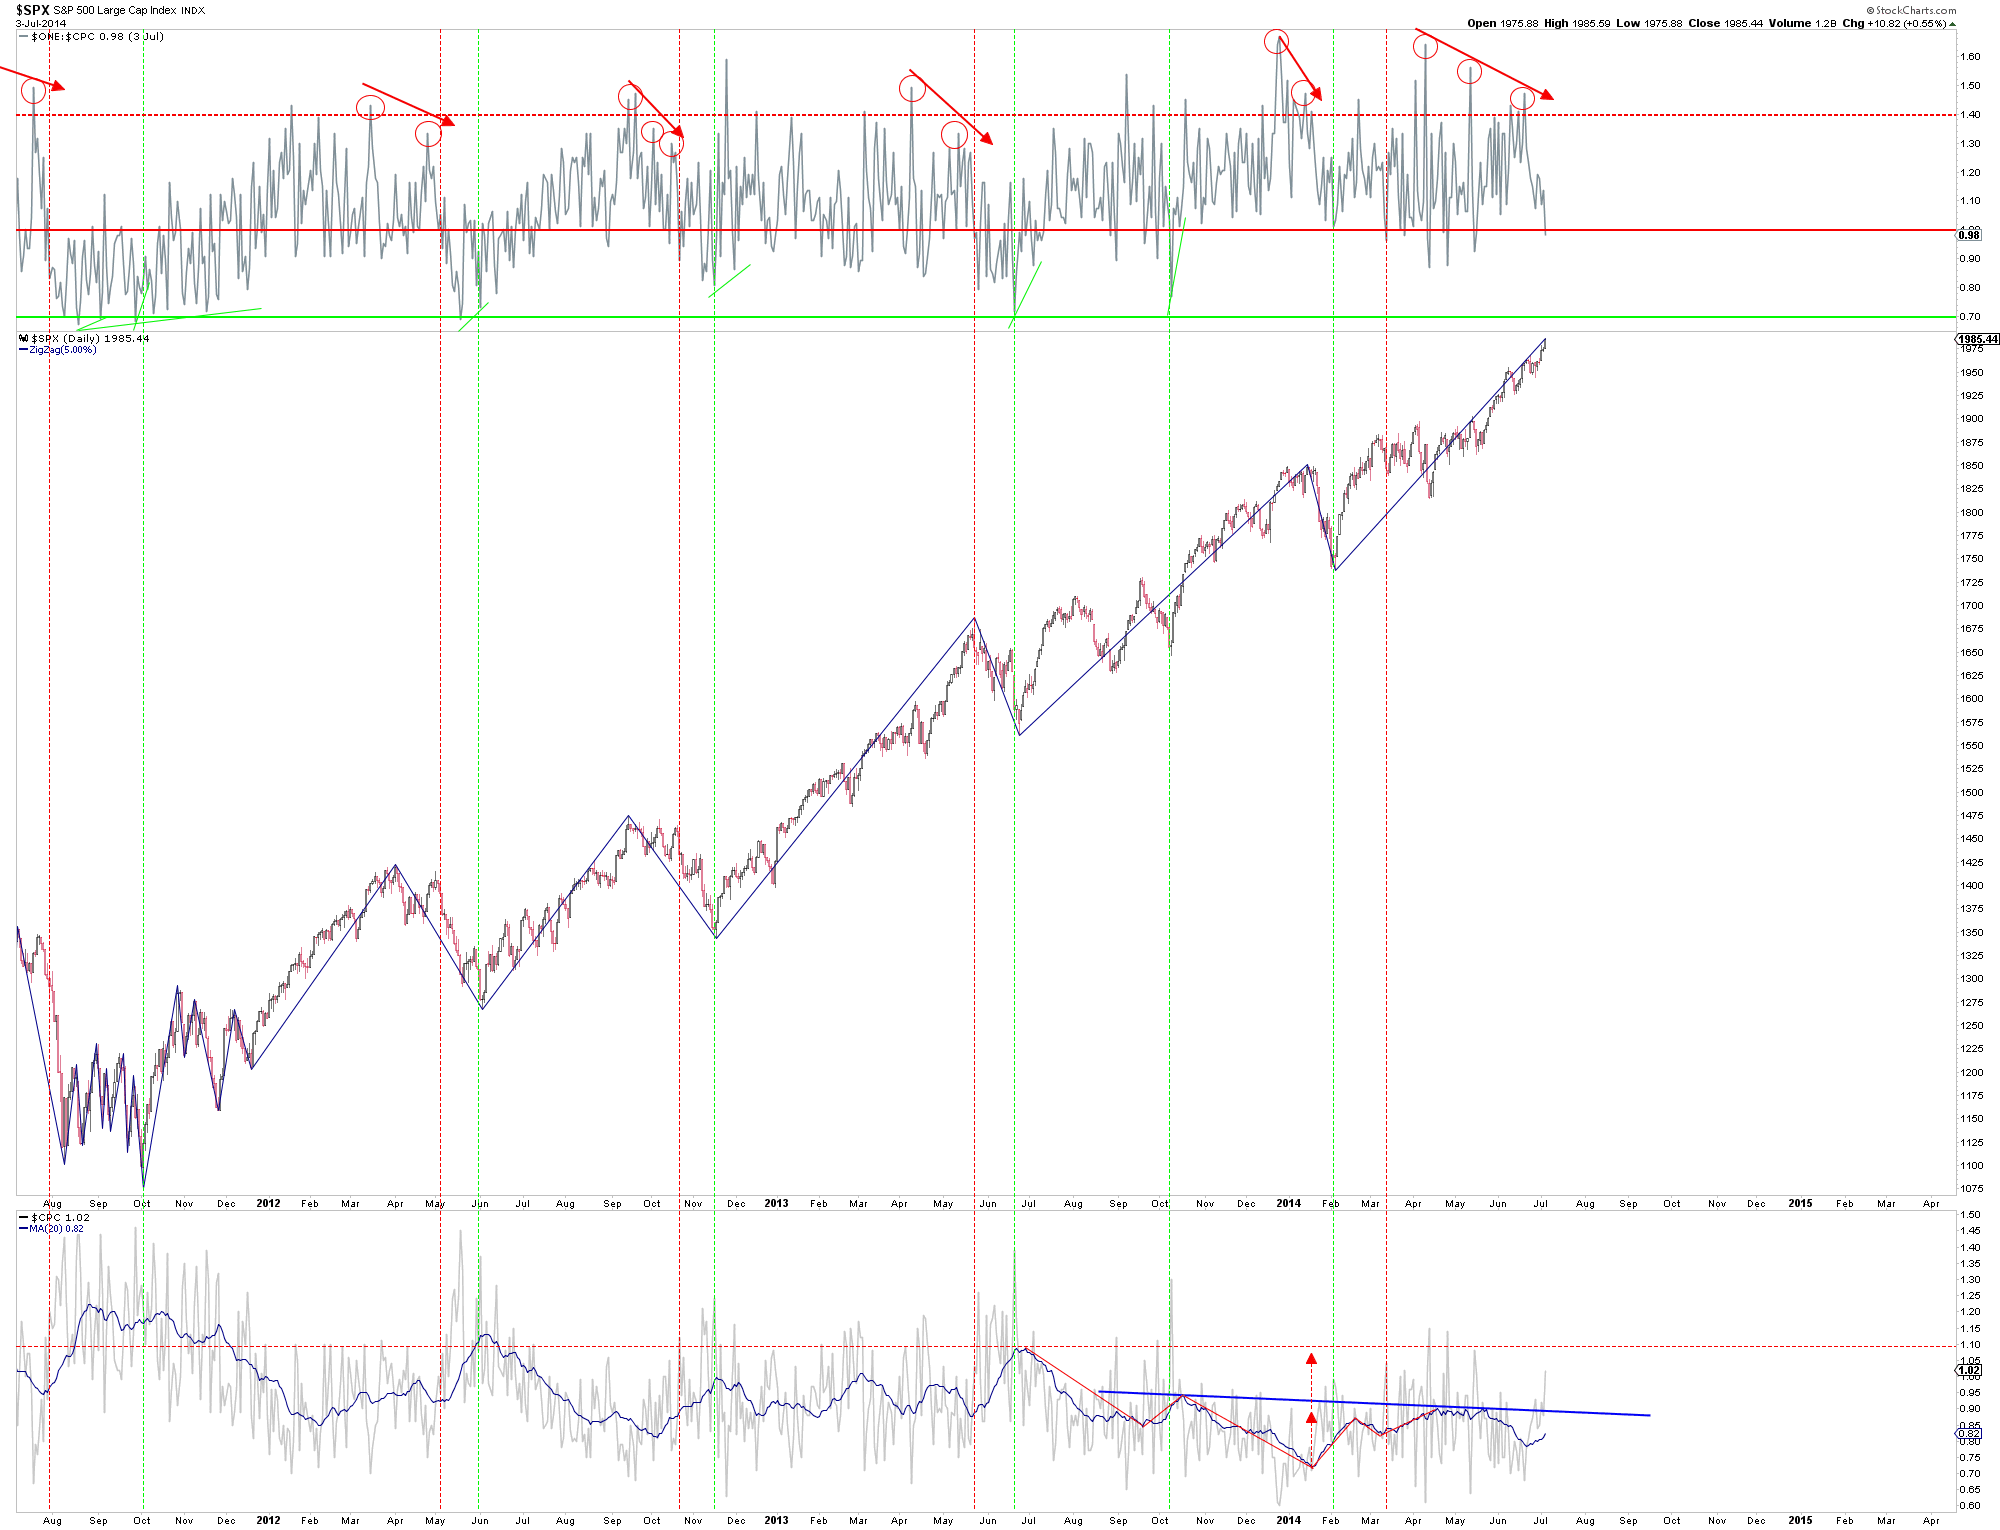
Source: Rory Handyside
2. Skew extremes and clustering greater than 2011 peak:

Source: James Goode
3. Implied correlation volatility reflects previous significant peaks: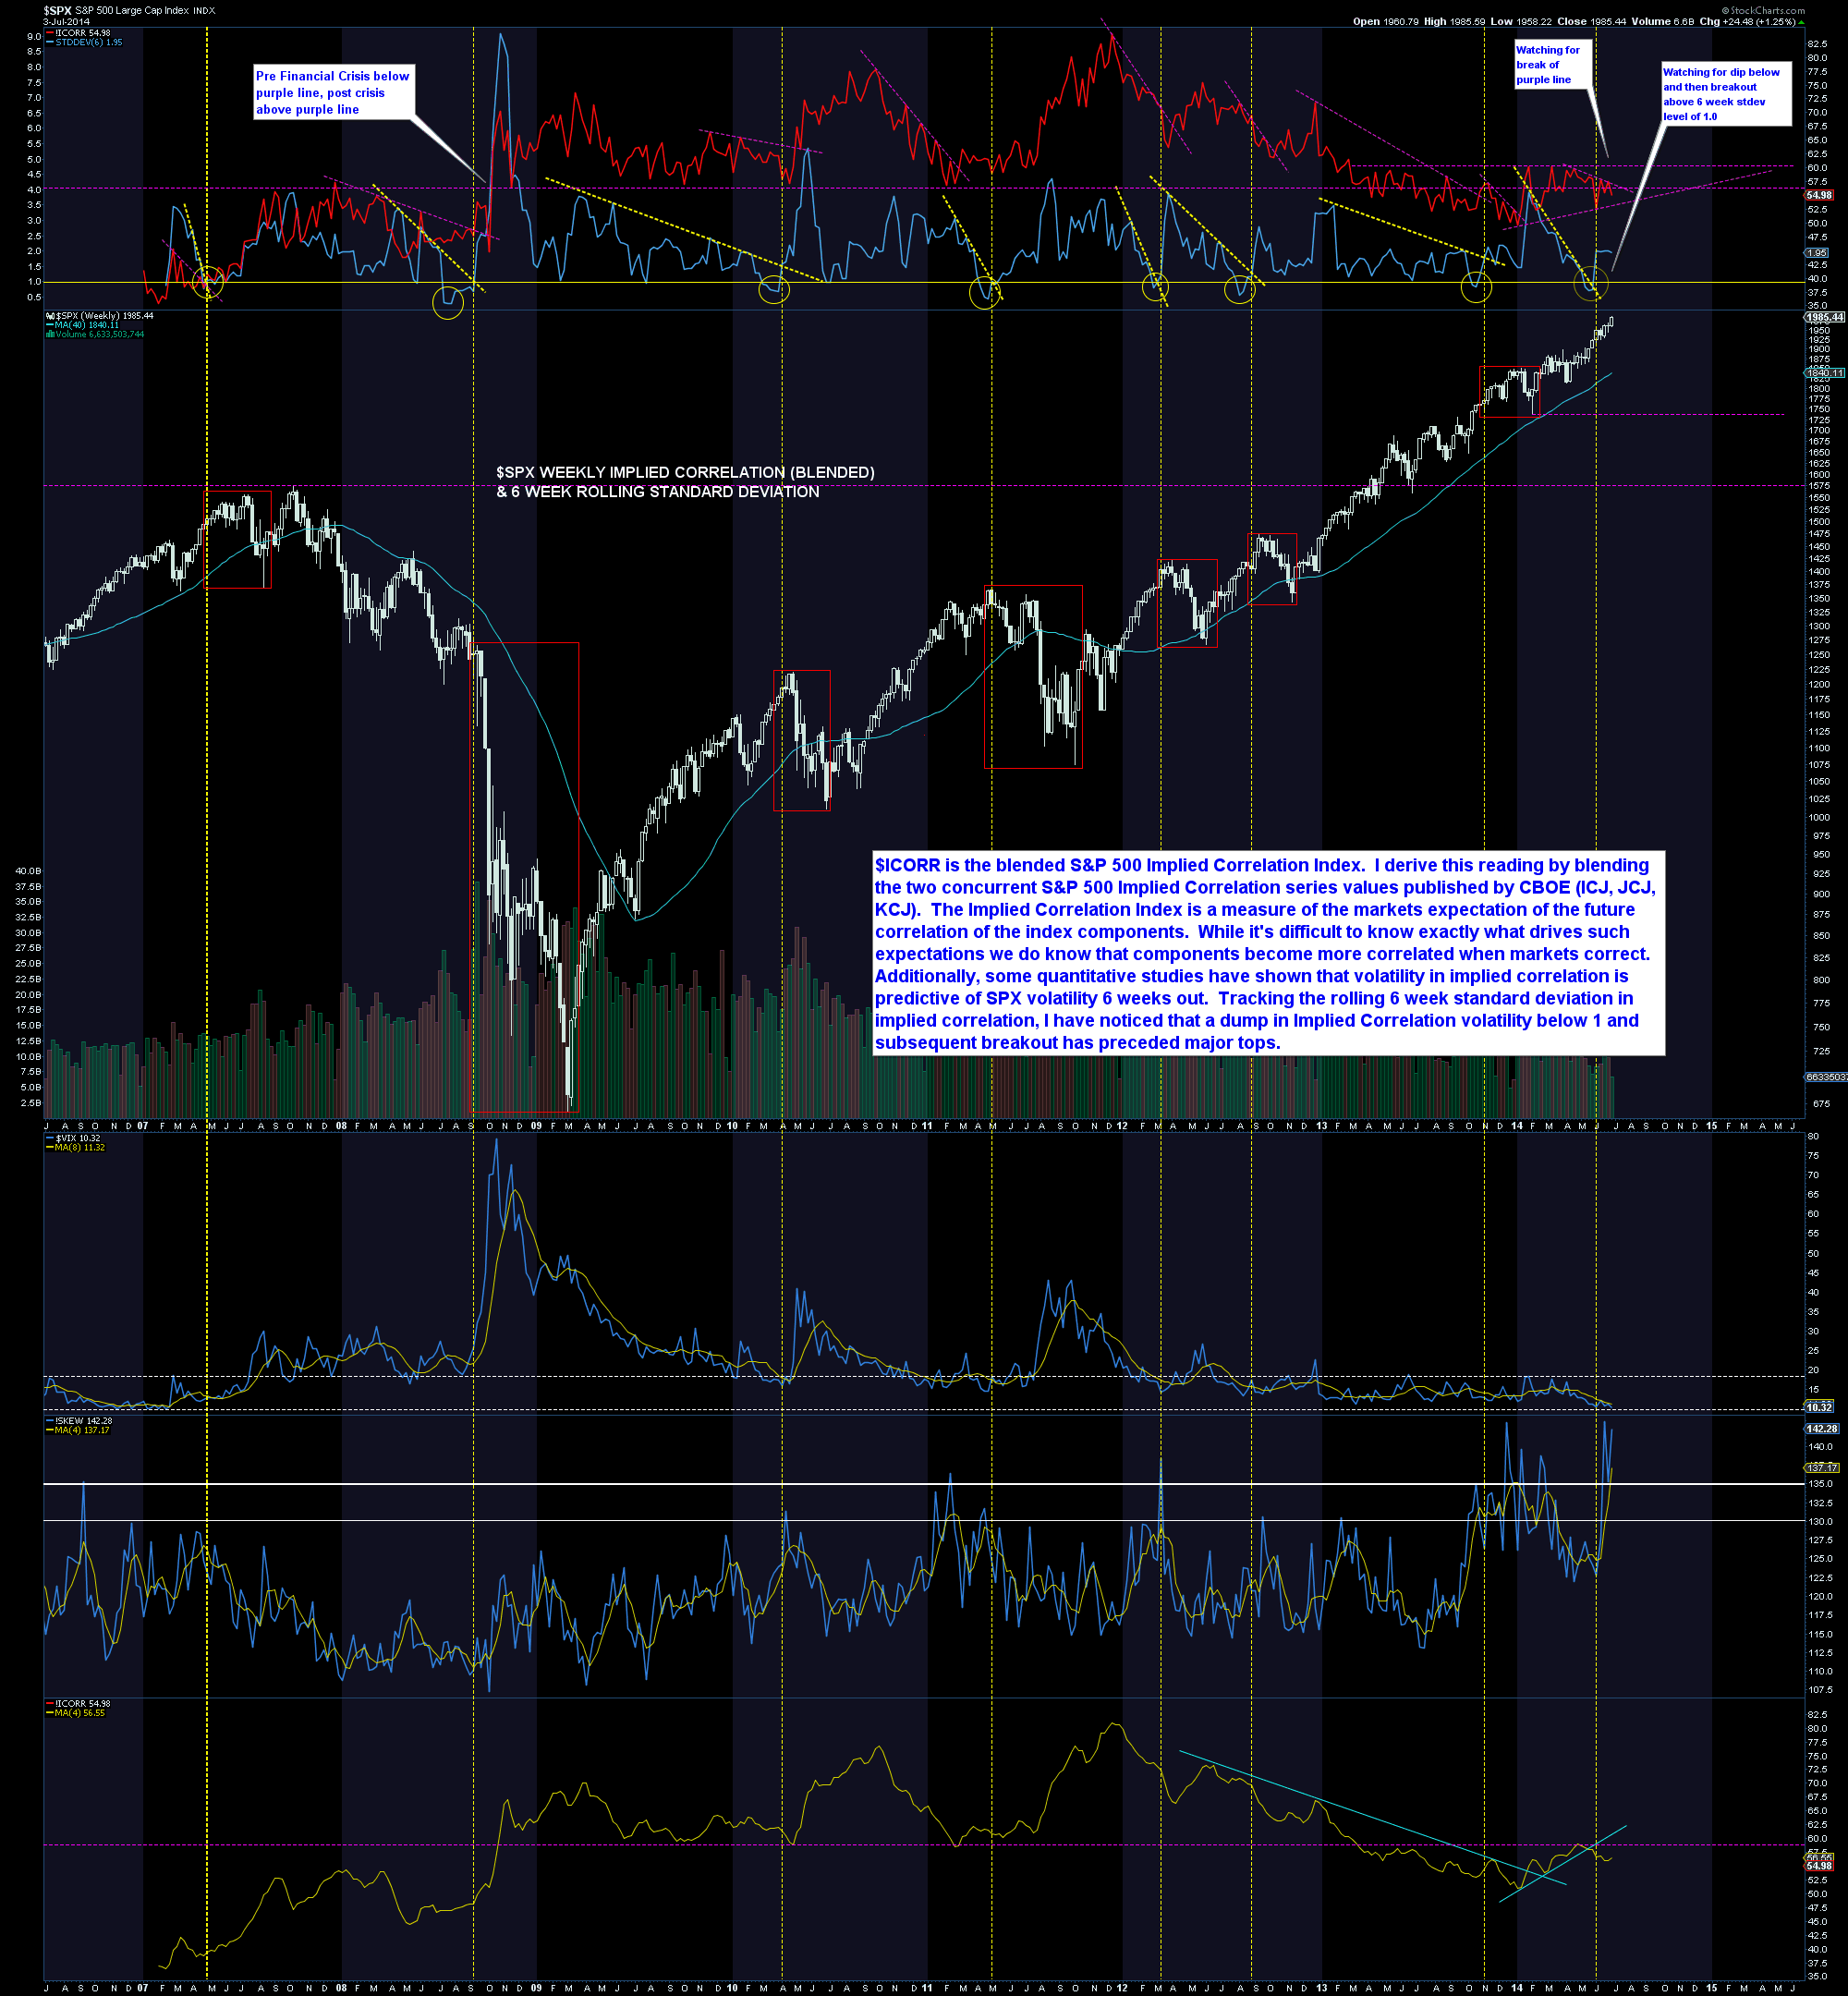
Source: Rory Handyside
4. Investors Intelligence sentiment extremes and negative divergence per previous significant peaks: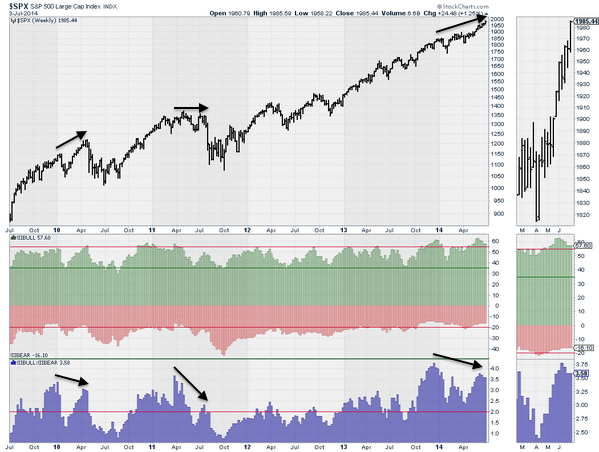
Source: Jack Damn / my annotations
5. Sornette bubble end pop flagging:
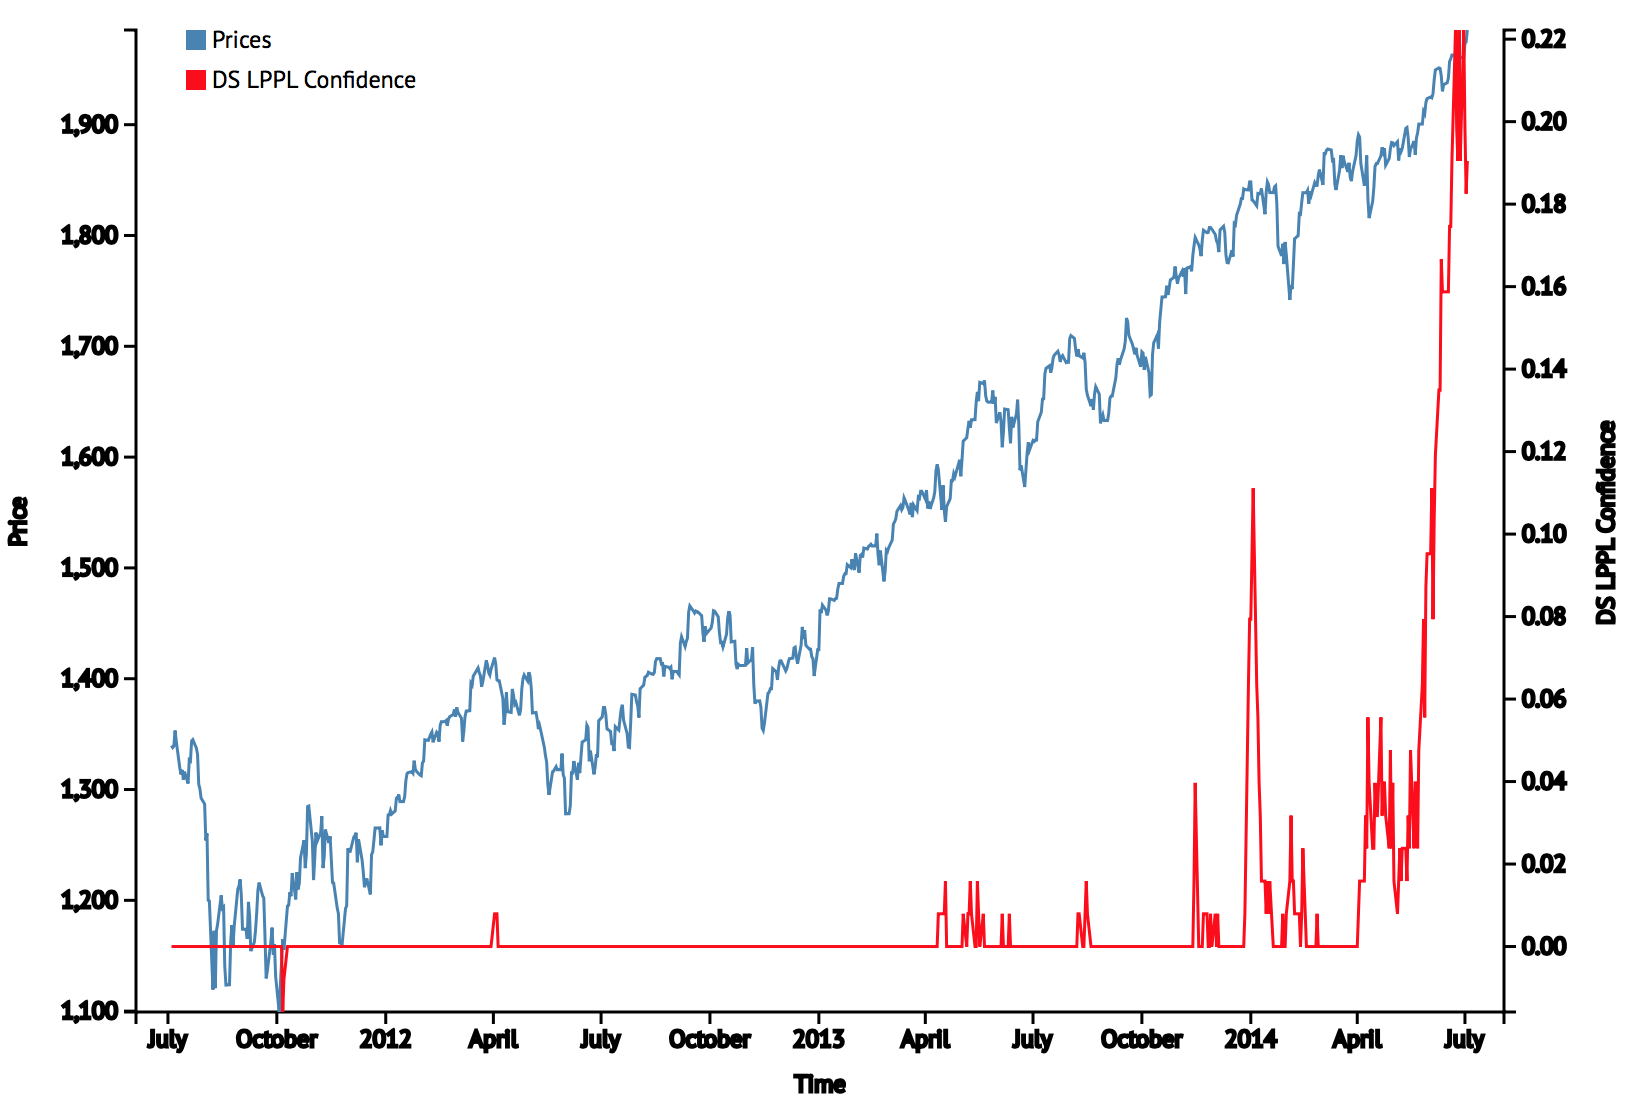 Source: Financial Crisis Observatory
6. Rydex assets extremes and negative divergence per 2000 peak:
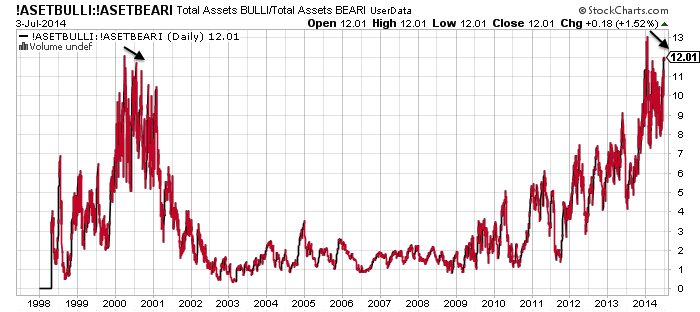
Source: Stockcharts
7. Margin debt already rolled over:
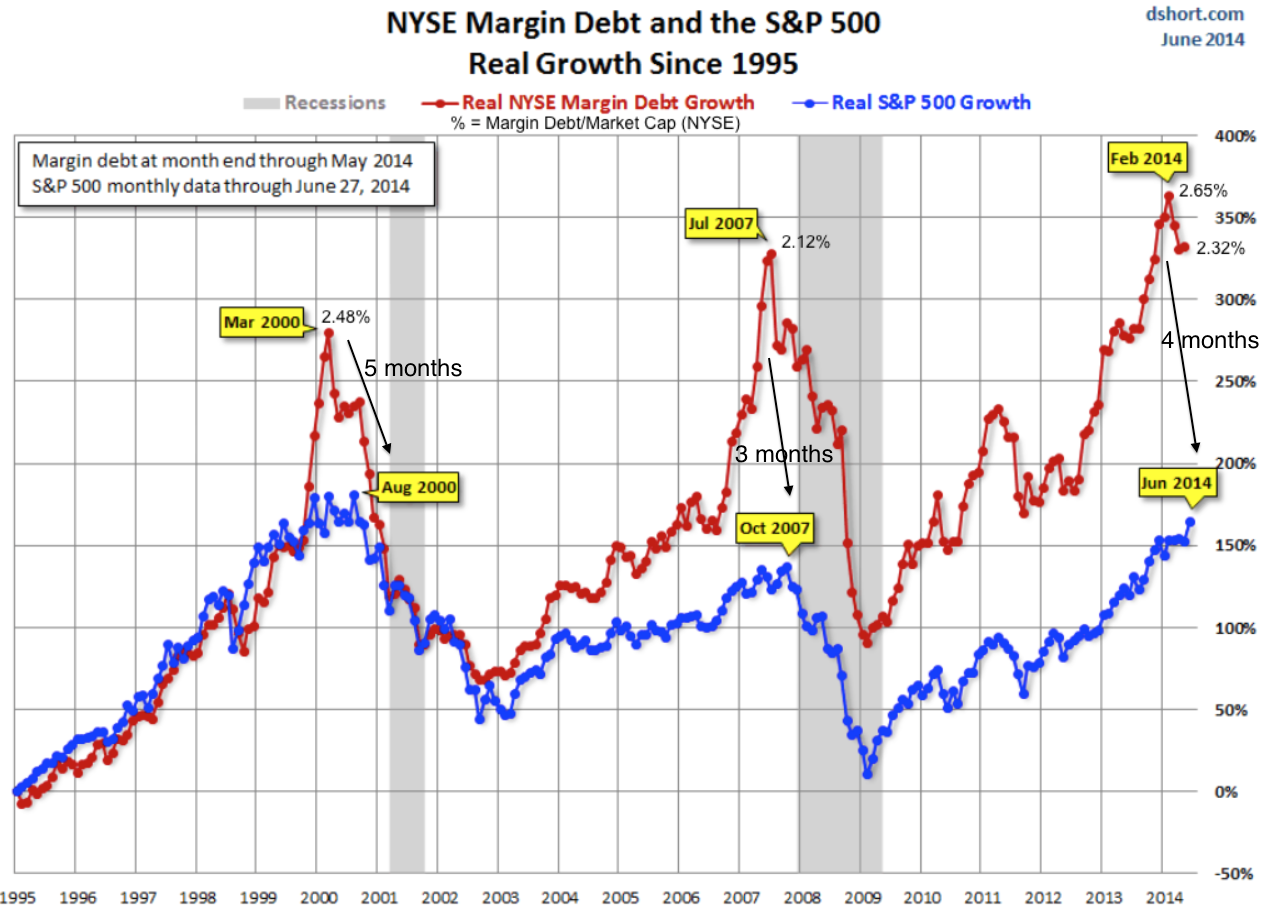
Source: DShort / Fat-Pitch / my annotations
8. The solar maximum appears to be waning since a smoothed max of Feb/Mar 2014. In the modern era the biggest slack in smoothed maximum to market peak was the Nikkei 5 months after the smoothed solar maximum in 1989. June/July 2014 is 5 months after.
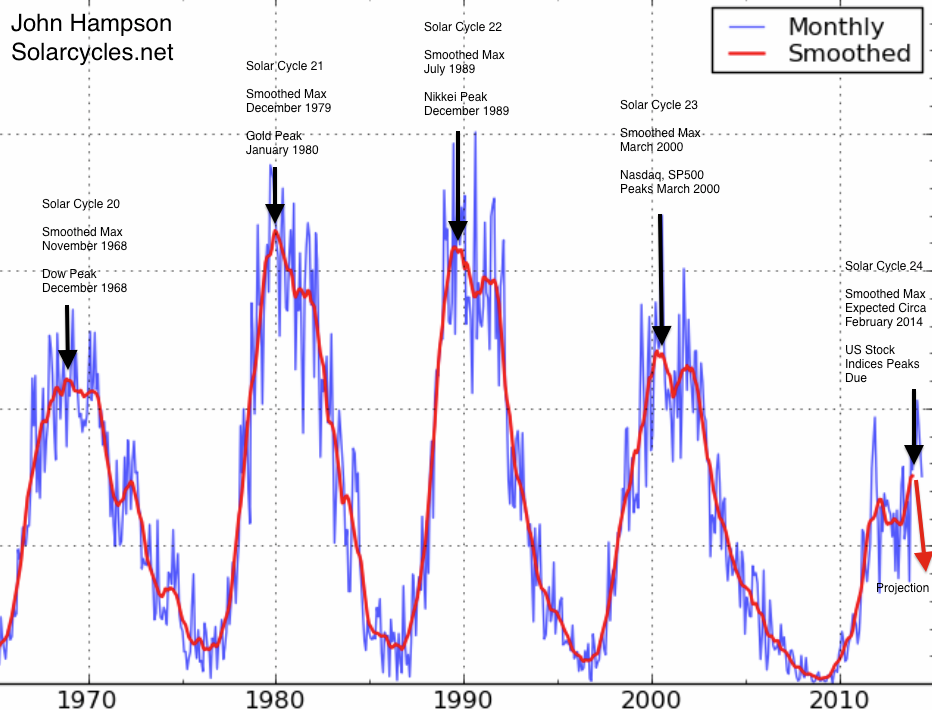
 Source: Solen.info
9. Asian indices appear to have already peaked:
 Source: Stockcharts
10. European indices appear to have already peaked:
 Source: Stockcharts
11. Which leaves US stock indices, which are ripe to fall under divergences:
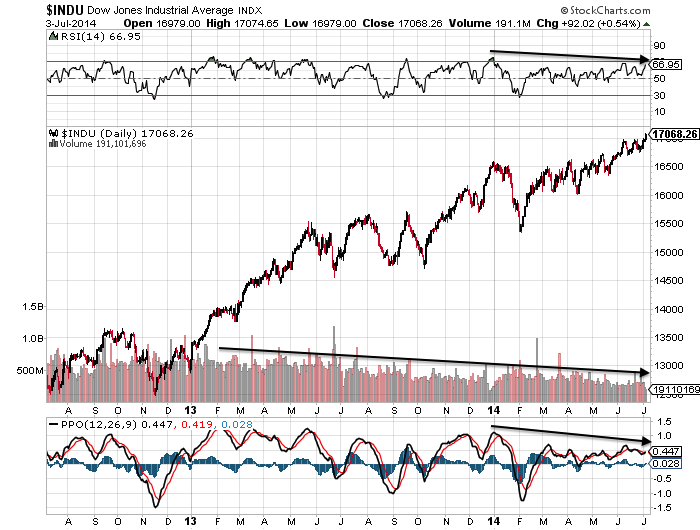
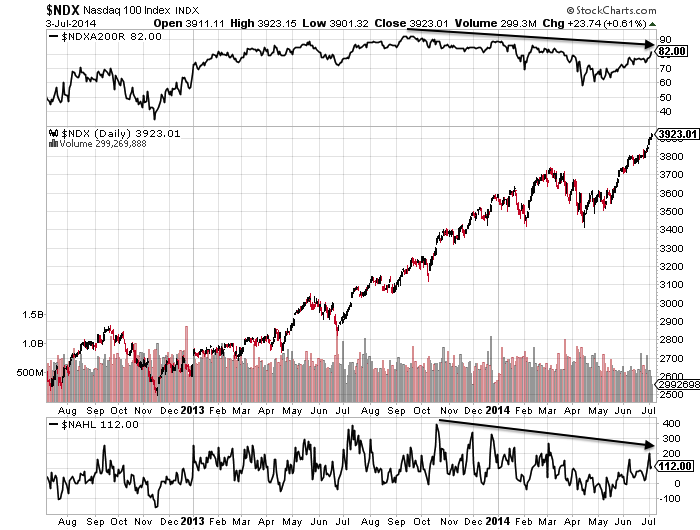

 Source: Stockcharts
There’s a lot to negate here if the end isn’t close at hand. Let’s see how this week develops…

Hi John,
I started shorting last August/September got badly burnt and stopped in November/December. During this experience I started thinking about the sun being the trigger and reading your site and have been a fan since. Great work! My pockets are not deep enough to act as a buffer to this manic euphoric blow off which like you I didn’t anticipate. However, I am convinced we are close…
Food for thought, would suggest a top on 7/7/14 or 25/7/14 – what do you make of it and those dates?
Or potentially:
16/7/14
Or taking G = 7 & I = 9, M = 13, F = 6
G7 implies 14 or 5
G20 implies 27 or 9
IMF implies 28 or 10
So we have: 5, 7, 9, 10, 14, 25, 27 or 28 as candidates.
How do these dates in July line up with your work?
Thanks!
Thanks. An immediate top would fit with the above. The 25/7 top would fit with this:https://solarcycles.files.wordpress.com/2012/02/guide2014.png
How about a “77” and “77” remembrance event in China? The 77th anniversary of the Marlo Polo Bridge Incident happened on July 7th, 1937 which was the prelude to WWII in Asia.
China is shaming the Japanese for not owning up to its war crime.. By co-incident, Ms. Merkel is in China. Think balance of power….
I can dig a market top today.
9 11 2001 = 14 = 7+7
How do you calculate that? 9+11+2001 = 23 = 5?
9 + 2 + 3 = 14 = ?
I got July 7, 2014 or July 20, 2014 from this speech. Then there is the issue of whether the occultists would use a gregorian calendar or a lunar based calendar. The seventh month of the jewish lunar calendar is Sept/Oct starting at the first sliver of moon after a new moon. The chinese lunar seventh month is July 27,2014 which also works.
Striking if it is a direct occult message. They feel their magic works stronger if they don’t hide it. If it is a message to those in the know, then it implies that the market is controlled by those in power who can turn the machine algos on/off up/down. I always thought the market won’t go don until they want it to for their plans sake. It has already become clear that those with the algo power can elevate the market bid directly on most market participants and components and by controlling the fuel for the algos, that being the $VIX and its ETF’s, and lastly the carry trade currencies. Some have alluded to the date being the date for currency valuation reset, which would devalue the $USD by up to 70%.
She does mention the lunar new year, so that may be a clue that it may be the calendar system they are using to interpret the “magic 7” clues for a date. So the July 27, 2014 certainly does align John with your geomagnetic with lunar oscillations chart as you said.
I was thinking about the same thing too. It would seem totally plausible for them to use their own calendar… Regarding a potential reset, this is fascinating: https://www.youtube.com/watch?v=CVsGzIYmquc
No problem, I would listen to the full speech if I were you. It confirms the fact the EM have already peaked and turned down. Kyle Bass said in an interview that when the taper leads to QE being $10B (if memory serves me) this would impact the markets to the downside. Sterling has been strengthening for quite a while now which would explain why the FTSE has not experienced the same nominal gains as US markets. Not sure of what to make of negative rates and potential QE from the ECB however. Would this imply the rise of Europe and the decline of the US. I believe we are at the cusp of a deflationary shock or accelerating inflation; or the former and then more QE and the later…
Even if I don’t believe in messeges (we use mobile phones today) this is ineed a bizarre speach. Maybe all she says is that 2021 will be even a bigger doo doo than 2009.
Yes, it seems like she lost a bet or something and had to do it, as she begins with saying that she is doing what she is told, but not very well…
Thanks John, very persuasive yet again.
Thanks Tim
Still a bull market you know…
Hope you are right, John. All the best!
Thanks John
I will personally fly to London (or whereever you are based) and buy you a drink if today proves to be the peak!
Have you looked at inflation adjusted S&P and DJIA for this year?
I am tracking that, but data is a bit delayed. One way is to put $indu:$$cpi or $spx:$$cpi into Stockcharts.
Bear case looking good here. Patience has been tested for sure. Well done John and others for sticking to your guns!
Thanks for the good work, compelling as usual, John.
Just a cautious note, the Fed has been pulling the trick, it is conducting record amount of reverse repos (lend more money to counterparties) to so far offset the effect of tapering:
http://www.reuters.com/article/2014/06/30/us-usa-fed-reverserepos-idUSKBN0F529N20140630
I’m still thinking this big Bradley turn date the middle of next week could FINALLY be it. (give or take a few days). You had to like the way the RUT behaved today. I’m going long TZA tomorrow.
Have you gotten in TZA yet or waiting for the Bradley turn date still? Perhaps a second chance at Bradley?
John, you’ve been posting same old indicators and charts since November. I guess “eventually” anyone can be right. Even a broken clock is right twice a day.
But imagine if this bull goes into phase 4. Ed Yardeni is making a call about it this evening. I hope you’re not betting your house on this, “literarily”, because you might not have a house soon.
There is not much on the tape to suggest that we are facing a big drop imho. The comment about the VIX and that markets don’t top when it is extremely low should be considered. However, just because it hasn’t happened a lot in the past doesn’t mean that it can’t now.
From a sentiment point of view there is not much to suggest that long positions are ready to sell, low volumes and grinding higher is indicative of longs holding, the price rises to tempt some activity.
At this time trading sideways in a range is likely especially over the summer months.
Due to the amount of leverage in the system however, when the selling starts it is probably going to be quite ugly – there is a lot at stake. In my view this will need a trigger and it could just be that the stress starting to appear in the repo market may in time provide this. It is impossible to say though whether the current level of incompleted repos is going to accelerate…
You may remember that several months ago (April I think) I posted about rumoursof problems in Austrian banks? Recently there have been news of stories of record losses due to bad loans in eastern europe….
I just mention these because normally I look for clues relating to stress in the system, as when these things break the moves in markets can be stunning large. The problem as always is timing!
J
thank you John for your great work! I agree with you the top is close. Personally I think Russel, CAC and DAX have topped already, however other indices may go slightly higher: Dow 17150, SPX500 new higher high, FTSE 6930, AUS200 5610, Apple 97.4. You do not allow to post any charts so it is not easy to show my call. Good luck!
Appreciated. The platform doesn’t allow commenters to add charts. If anyone has an important chart though, it can be emailed to me and I can upload it. Email on the About page.
Good news, we (bears) have good news – economy , employment growing, profits at record high etc. What signified the bottom in 2009. Bad news was good news meaning the mkt went up a lot even as the economic news stayed bad for a long time. In fact that is the most profitable time to buy stocks is – when the economy is weak and the FED is flooding the economy with money – it goes into stocks and bonds. So could we now be at the opposite situation now, good news is bad news ie a mkt top. Yes, but the FED is not tightening which would be the most indicative situation around a top. The most likely prospect is that this credit cycle stuff is so known to virtually everyone, it has been totally committed to.
Great material and writing as always, John. Thanks.
Andre, looking forward to more on gravity. The 9 month-13 wk cycle is one of the few that actually works frequently.
Sunday I will post again.
Cheers,
André
HI John! hey I noted in a prior post a peak for stocks
around the July 3-7 timeframe, down into what my chart
shows to be July 10-11. today’s drop to 1969 has met
my minimum expectation in regards to price, though
there is still a few days left with time:
http://goldwavetrader.com/page33.html
looking for a drop to 1270’s in Gold in the next week
or two, then higher off the same into September
vxx gapping up and running. equities nice open drive lower at the open during “always up” tuesday. interesting to see if we dump into the afternoon or buyers keep on doing their thing…
Pretty much as I thought so far.
Steady to the end of the last quarter, then a rally for the first few days and then a reversal. If it can close lower than 1961then that is down on the quarter so funds that have profits in the bag may want to take some longs off to protect performance.
We’ll see.
I don’t want to get ahead of myself but if is does close tonight below this quarter opening 1960-61 then we may get a mini flash.
If you go back to 2010 or 1998 and look you will see that when it does close under the Quarter opening it dumps. Ill see if it does it in 1986.
Very good observation Will. Lets see.
Bear case takes on momentum. Usd/yen needs to clear 100.50 below which the floodgates open to 96. European banks are breaking support. Tech falling from second peak.
John Li just might have to buy John a drink.
Gladly, but too early to cheer. When we all get too happy, the second chance rally will come, if not new highs.
So far its holding that level…….
I reckon its how it closes that will affect how funds behave. Whether or not stops kick in.
The harvesting of bank accounts has begun: http://www.libremercado.com/2014-07-04/la-banca-no-podra-repercutir-a-los-clientes-el-limite-a-las-comisiones-de-las-tarjetas-1276523068/
Europe first. Just a measly 0.03% until we get used to it – the rooster step!
A small tiny communist elite that wants to stop all growth and development, stop population growth. And so many nasty scripts in the movies that go directly into watchers’ heads. I’ve recently seen ‘Lonely place to die’ : technically a good movie, but people want to get killed for an unknown girl. People get killed in the street but it doesn’t matter. The girl is safe.
Then ‘The Rise of Genghis Khan’ : the movie suggests that he became great by making Mongols adopt a few laws : for example no killing of women and children.
People watch ‘Titanic’ where men are killed, because women and children are more important.
If anybody asks why white man civilisation is dying.
Good call getting out of your longs, BTW. With old VIX up 10% two days in a row, is it almost time to buy the dip?
the Fool of the Tarot has great wisdom !!
Is the Fed attempting a controlled crash to pop the bubble as recommended by the BIS?
http://www.zerohedge.com/news/2014-07-08/fed-going-attempt-controlled-collapse
It fits with Christine Lagarde’s IMF speech.
Thanks everyone.
Change of character in the market the last couple of days. Small gaps down that ran, no late buying surge to recoup. Nothing definitive yet though, let’s see if this can be built on.
Hi Guys….Just an addendum to my points above.
You’ll see that yesterdays lows were the 1960-61 level that I was referring to. That level was also the same moving average levels that the market has bounced off in recent weeks.
As above, the reason I pointed out 1986 and 2010 or 1998 is because they are both the 2nd or 6th year of the Pres cycle.
1998 and 1986 are good to look at because the markets were raging bulls, but they still managed to have a down quarter – not a crash but a decent move. In all cases how the market behaved relative to the previous quarter close is important.
This year started with an intermediate top. In all the price movement in the first two weeks it never took out the end of 2013 close. Ok it had a subsequent rally but it made a reasonable move.
The March quarter closed at 1872.6. If you look carefully when it closed beneath that level on the 7th that was the trigger for another 20/30 point move. even when it rallied back to that level…it held it before it made new lows on the 14th April.
So here we are now…..As Chris Puplava has been saying the momentum is building so maybe the bounce of this critical level yesterday will be enough – but watch the close below that level.
Why is the level so important. Well, not wishing to sound patronising, but we all talk about rhymes and charts and lines on charts etc…..all very tecky……but behind all this we must remember there are tons of long only or hedge fund managers. If they have been running a long exposure these last few months and their performance is judged quarterly these levels are critical to them.
Good luck to all.
Add this to the list of market top signals: http://www.marketwatch.com/story/another-sign-the-bull-market-is-nearing-its-end-2014-07-09
And finally we’re getting signs of stress (albeit marginal) in credit markets:
On the other side, European credit spreads moving marginally wider, now at a 3-month high.
The FED announces slightly earlier QE exit than expected and Dow goes up. Perfect signs of investor mania…all news positive. It has to end at some point.
Well I bought yesterday due to the VIX and now I can sell again.
Because the Fed is conducting record amount of reverse repo to offset the effect the QE tapering.
Silly rabbits, vix are for kids
Great opportunity to enter or add to shorts today. Maybe there will be one more high in S&P but one shouldn’t bet farm on it. Either high is already in place or will happen in 1-2 weeks at slight margin. Many indicators point to mid-July as the top. Russell, German DAX, French CAC – all are underperforming. Please fasten your belts as nobody knows how fast things will disintegrate. Historical analogs point to shakeout between now and second half of August, upward correction to early September and crash afterwards. The pattern may be different however so discipline will be required as to not exit positions prematurely.
As crazy as it sounds I’m kind of coming round to the zero hedge idea that BIS has instructed the FED to deflate the bubble in stocks. They’ve manipulated everything else.
So, I guess the question is what would satisfy the markets & the media, pick a pattern so it looks normal, but don’t let it turn into a rout.
What pattern will they go for based on historical performance?
People have been trying so hard to decode the financial markets in the last 100 years. They’ve designed so many indicators, observing and recording them everyday with hopes that there may be crystal balls and then fortunes. As far as I know, most of those indicators are nothing but nonsense. A few of them are useful. But none of them could be reliably used to forecast the future. Not even close. Suppose there existed an indicator which has a slightly more than 50% chance to forecast the future, guess what would happen?The markets would be dead very soon.
Among those useful indicators, VIX is the unique one that can develop a deep market for itself. Don’t underestimate how important it is. A tradable indicator is not easy to find or design. It must have great value to be tradable. It must be intrinsically independent to its parent market.
I would say, to fully understand VIX is a tough job for many. Three steps are suggested:
1) Fully understand B-S Model.
2) Have enough experience in trading options, esp. selling options, but still stay solvent.
3) Have enough experience in trading VIX futures.
Mike can you elaborate further on where one could find out more. Links to resources or recommended reading? Since Slater mentioned the use of the vxx ive taking more of a keen interest in using it to trade outright ES futures.
Bear case gaining strength. Financial system fragility resurfacing in Portugal, Austria and Bulgaria. It only takes one institution to fail to set in motion a chain reaction of default as was the case in 2008. The case of rioforte or the holding company of banco espirito of Portugal has such potential. Lateral fall out to Brazilian telecom oi already. European banks are the weakest link in my view. Creditanstalt anyone?
Well it looks like I fluked this one. Decided for some reason to go long volitility yesterday.
Gold is breaking higher and set to test $1400.
My decision yesterday in no small paet due to John’s latest update. Sometimes it is impossible to ignore such clear evidence,
Thank you John
I probably contradicted myself somewhzt in this post. “fluked” a bad choice of words.
And for all the hard hitting words from BoE’s Mark Carney a few months ago RE interest rates….no change………….Pfffffffffft………do any of them have even an ounce of cred?
Are we at last on the verge of a meaningful
sized correction? – I’m not holding my breath
as each time over recent months the market
has pulled back.
Yellen’s comment of pockets of increased
risk taking was significant imv.
The day we have been longing for is here imho. All analysts expect the SPX to hit 2000 before retracing, but it seems the markets are due to fall now, starting with European banks today, followed by the US then more heavy sell-off tomorrow 07/11.
I think the inverse ETF vehicles are worth to own again TVIX, UVXY, TZA, FAZ…etc. And precious metals are going up the roof as another sign of liquidity leaking from equities to PMs.
A close under 1957.36 (the pit futures equivalent number is 1950.28) is a qualified one, and a down open tomorrow morn (that is not the low print of the day) confirms it. That would next target 1929 on the downside.
Alan on UK rates, look at the shop price data
out today, very modest wage growth etc.
I do not yet see a strong case, particularly
in the context of weakening Euro area confidence.
The large rises in HPI will become self limiting as
affordability begins to bite.
UK following the US with more NSA type activities and readying itself for the civil unrest to follow…
http://www.bbc.co.uk/news/uk-politics-28237111
Phil, my point was that Central Bankers are all froth and bubble. The UK economy is supposed to be booming. Mr Carney came out, I think two rate deisions ago maybe three and went into a rate on the dangers of leaving UK rates this low and yet when push comes to shove he doesn’t have the guts to move.
He will never ever move, he knows it, I know it and the markets know it. He just likes to think he has some kind of control, whereas the fact is that CBer’s have shot themselves in the foot.
For some reason the word impotent springs to mind?
BTW that was meant to be “rant” not rate.
Powerful recovery in Dow today. Much less so in dax and ftse. Buy the dip guys still believing in the bull case. We need a mega 500 point drop in a day to get this bear ball rolling.
Dow might finish positive! That would get the bulls excited…unfortunately.
Thanks all.
After yesterday’s yo-yo, I want to see how today plays out to make things clearer, so just brief comments. Today is the full moon. Yesterday ended with Nymo oversold and Vix out of its upper bollinger band, which gives chances of a bounce. On the other hand, vix looks to have broken out, European indices are in a clear down trend, and RUT IBB and SOCL have all done a persuasive job so far of making what looks like a second chance peak 3 July (to the Feb/Mar peak). By historical comparisons, if that was the second chance peak then bears should be noticeably in charge now: not every day down but recovery days being swiftly reversed. It may be a sign that despite yesterday’s bullish recovery intraday that buying petered out later on and the market still finished down. So over to today: if bulls can build on yesterday’s ‘save’ and make a bounce here then it will look a lot less compelling on the US large caps that we’ve had a major trend reversal, whilst a bearish day today would go some way to cementing it. Sunspots have shot back up this month so far so am keeping an eye on that.
I understand that today we have a full moon & it’s the closest it comes to earth so massive gravitational impact & heightened emotions.
Can’t find the thread where this was discussed. Trying to understand if this is a bullish or bearish phenomena or it just exacerbates the current trend?
Andre will have to speak for gravity, but the full moon = max pessimism / negativity. We have declined into it accordingly, sometimes it then turns up out of the full moon i.e. turning point, sometimes the few days around the full moon continue to be negative before it turns up.
Thanks again John.
US futures are up at the moment. Given this should be a negative period it is surprising that the bounce back happened so strongly yesterday, though I don’t have intraday volume access to see how strong / weak this was on the Dow.
Given futures right now another attempt at a high over the next week seems plausible if we’re moving from negative to positive physical phenomena over the next few days.
Let’s see but I might have to reinstate my long hedge against my short position.
The moon will be closest to earth tomorrow; the 13th (358259 km). Full moons change the polarity of earth. Normally earth is negatively charged – meaning excess electrons – and humans can use the electrons for energy. With full moon the earth is positively charged and steals electrons from your system. Life=energy; low energy makes you moody. Like I said before; gravitation is max in the weekend, and it is more on Sunday than Saturday. Wouldn’t be surprised if we set a low on Monday or a double bottom in European markets. US-futures will follow. And then the real start of the upweek when wallstreet opens. Monday has low gravitational momentum; so probably a side ways market. From Tuesday on the momentum rises fast. Tuesday Intell reporting. Coincidence?
“There will be strange signs in the sun, moon and stars. And here on earth the nations will be in turmoil, perplexed by the roaring seas and strange tides”. Luke 21:25
So humans knew a long time ago that celestial bodies influence both the tides and human behaviour.
There will be plenty of such strange signs during the next couple of years – a series of huge shifts in sentiment (Bradley turns); minor lunar standstill; tetrad; total solar eclipse; a solar magnetic field that shows no sign of strengthening.
This is not a time to rely exclusively on statistics and indicators from the relatively recent past.
Gann called the 5th year of each decade, the year of ascension. Only one has been down. But 2015 has two total solar eclipses where the solar eclipses come before the lunar eclipses, the condition that sets up crashes.
Kent, have you any ideas as to why 1995 ushered in such a fundamental change in stock market activity? (also 1985 to some extent). Shown in a long-term chart: http://www.chartsrus.com/charts.php?image=http://www.sharelynx.com/chartsfixed/30DJIA.gif
1985 was a major lunar standstill, and 1995 was a minor one, but that doesn’t seem to account for the sheer magnitude of the increase in speculation (?).
Elliott Wave Count for anybody interested. This was the question of degree I mentioned earlier. This is the bearish count which has us as terminal at the channel top/yearly R1 pivot that we just hit. The bullish count would have a Sept low and then a move up towards end of year. So, for me and only me, whether we are at or have broken support in Sept cycle low would tell me likely that the bearish count is right or wrong.
Just my amature contribution. Have a nice weekend.
Made edit to show standard view
http://tinyurl.com/obzcw9w
july +/-7 days major turning point
http://www.seeitmarket.com/bradley-timing-model-indicates-july-2014-turning-point-13666/
Guys, all this mumbo jumbo is a bit waste of time. I only care about one event on the horizon: I call it the DOW 10K crossing. Make sure you all have loads of money available to celebrate and enter the market with full strength on the long side. Get in and forget about it.
All the market rise that happened so far, on the QE addiction, will be taken out.
What if we hit 11k and never 10k?
Been buying my shorts back over the last 24 hours. My 1960 levels has held quite well. Not a big turn but it was a big position. Ive put stops in back below 1960.
By history this rally should out run 2010 (look at my previous posts). That would take us above 2000. We’ll see.
Hi Will, saw your post and agree with you. I had a short-term cycle bottom July 10-11, and Friday’s failure to break to new lows most likely favors the bottom made on the 10th. If correct, a normal low-end rally expectation would see the SPX up to the 1999-2012 area into July 16-17
Will / Jcurrys,
Another good trader Andre had posted:
“I See a low next weekend -11th July. After that a high on july 20th, and a low on july 26th and final high on august 5.”
That seems to be working and in line with what you both are saying.
hey Jigs, I won’t argue with that, though the 20th is a Sunday 🙂
July 17th, plus or minus a day would be an ideal peak, which is
at or near the upcoming major Bradley turn. any break below
1944.00 SPX CASH would negate that assumption.
Mark, the Reagan administration ushered in the massive ramp up in debt. A key to this was the conspiracy to eliminate the Glass-Steagall act. That began in the mid 80’s and by 97 it was dead. The huge increase in debt on 100 to 1 or more leverage equals massive speculation. It lead to the joke, what is the difference between a bank and a hedge fund, hedge funds are not so leveraged – 40 vs banks 100+ to one.
I don’t know the astrological reasons for it but periodically humanity goes bezerk, tulips, 1929, 2000, WWI & II, ETC. Many believe the gold standard would stop all these shennanigans. No, it will be brushed aside just as past gold standards and glass-steagalls have been.
No follow through selling, yet again.
With all this talk from both sides of SPX hitting 2000/2020, I would not be surprised if it never hits, I wonder how many are sitting on the sidelines with dry powder waiting.
It certainly does look like it will, but will it? As I see it most are saying the peak will be with the next two to three weeks, so not long at all to wait.
The SB companies know where everyone stops are and who is sitting out waiting as well as orders placed above to short.
The house always wins with minor losses because they are the only ones with inside knowledge.
Markets finished unclear for the week, so no new post for now.
From a bullish perspective, Nas100 still in uptrend, no real technical damage to SP500 and Dow, no voluminous sell off, buying support Thu and Fri could mean now we are through the full moon we rally, plus gold stayed contained.
From a bearish perspective, R2K and European indices made definitive trend changes, there were 3 gaps down on US indices which were not filled, treasuries rallied again at key level, vix broke out.
Earnings properly get going this week so let’s see how the markets react.
Sunday again; time to empty my head 😉
Last week I said that gravitation predicted a downmarket. And down it went. I’m not surprised. It was real fun to see the analysts look for reasons to explain the downtrend. By tuesday they knew : it was a Portuguese bank! Hallelujah. But we knew on Sunday this would happen. So it wasn’t about banks at all; it was about gravitation. News always follows the markets.
Please understand this is not about me; I don’t need to hear I was right. All I want is to open your minds to the power of gravitation.
My key message is : there are several natural forces that impact the market. If you analyze only one of them, you can never get a full explanation. Let me explain. Let’s talk about the full moon, as there seems to be some confusion around that.
John said :
“Andre will have to speak for gravity, but the full moon = max pessimism / negativity. We have declined into it accordingly, sometimes it then turns up out of the full moon i.e. turning point, sometimes the few days around the full moon continue to be negative before it turns up.”
And John is right as always. Full moon is max pessimism. But what is unsatisfying is the ‘sometimes a few days’ part. When we think in terms of multiple forces this becomes totally clear.
The full moon has an electrical effect. And electricity is one of the forces, together with magnetism and gravitation. Sometimes we see tidal force extremes on the same day as a full moon. That’s when the full moon times the turn. But sometimes we see tidal force extremes a few day later than the full moon. Now the full moon is not an exact timer as the market can only turn when the forces in line.
Let’s translate into wave theory. A W3 gives max momentum as shown in extreme RSI values. Sometimes we see 3 waves (counter trend) and sometimes 5 waves (motive). I think that in a 5 wave the full moon gives the end of w3 (max momentum) and gravitation the end of w5. Now improving momentum gives a divergence.
See? Now we can explain why the full moon cannot always be an exact timer. And more : we can forecast when this will happen, as both full moons and tidal force are predictable. And I’m still on the same page as John.
Lets extend this line of reasoning. If I am right in my analysis it would mean we can use this analysis to label the waves. And I do think we are in a 5 wave, with full moon timing w3. Friday gave an abc up in w4. Don’t be fooled by the higher low; thats what we expect in a retracement.
That’s why I think we will see the real bottom on monday morning. It doesn’t have to be deep. I expect a double bottom.
My gravitational analysis gives daily readings. So the rate of change in the indicator is what I would like to call gravitational momentum. Gravitational momentum on monday is very low. meaning gravitational impact is minimal. This sometimes happens. July 4th had very low momentum so European markets where flat. The experts said that the reason was that us markets where closed. But is was gravitation. So I expect a rather quiet market on monday which would fit my wave 5 bottom scenario. From Tuesday on momentum picks up speed so I see a fierce spike up.
The tidalforce shows a pattern; My indicator cycles between roughly 1.65 and 1.05. These values have no special meaning and are dependent on the tidal station you use. Anyway; it features a 3-1-3 pattern. June 20 was the real top. The indicator gave 3 tidal waves down with july 4 a lower high. The market gave a higher high, but is was a false top. Last week was really a third wave down, hence the lower bottom. Next week the indicator travels to the lower band in one go (indicator down = markets up). From what I’ve seen these ‘one waves’ are countertrend. So the pattern confirms what I have said above;
As the tides are set in concrete, my forecast of last Sunday stands. Next week I’ll reflect again If you guys appreciate my contribution.
Have a nice weekend.
Thanks Andre this is really interesting stuff. Where can I find out more on how to do some of this analysis myself?
Great write up Andre. Please continue posting. It is appreciated.
Please continue to enlighten us. Greatly appreciated.
Thank you Andre, very interesting!
The only site you can read about this is this site. The gravitational analysis is my own solution and it has taken me some time to get this far. So I am a bit hesitant to share my indicators that I have worked so hard on.
The use of tides is not my own idea; Robert Taylor wrote ‘Paradigm’. It’s just that getting an exact timing from tides requires some research. The Sandy hook tides are on the net.
What’s interesting about John’s site is that he also uses natural forces to predict the market. That’s why I post here; I see synergy. But if it was my site I would rename it to ‘natural cycles’ 😉
Cheers,
André
Nice work Andre…thought provoking stuff.
Andre – Have you checked to see if your indicators predicted the previous market crashes? If they did, I would be interested to know when your analysis indicates the next possible crash? I’m asking for a lot I know!
I totally understand Andre. Look forward to more posts.
Andre,
Can I also request you to post your medium term outlook say for next 1-1.5 years for Dow?. Lot of good analysts are projecting sharp correction around Oct 2014 and then they expect final up move till Mid/End 2015.
Does your research suggest such scenario?
Tides are oscillators. So anything longer than 3 months is impossible. Besides; John does an excellent job in analyzing longer term trend.
And thanks for all the kind responses.
Reflecting where we are now, the Dow has made a new ATH today. If you look at the daily chart there is quite clearly a rising wedge. Which ofcourse this is more usually more bearish than it is bullish. However, for the past 2 years every rising wedge breaks up into a bullish channel. Is it different this time? Probably not. There is no technical damage done, every dip is bought and it would be too easy given that everyone is watching tomorrows bradley turn date. Just my opinion
I looks like one more consolidation, triangulating before final burst to S&P 2K early next week. In the same time, gold shaking off weak hands before strong move higher.
Looks to me like gold just reversed trend.
Will the DOW follow?
http://stockcharts.com/h-sc/ui?s=$UTIL&p=D&b=5&g=0&id=p30226645953
http://www.zerohedge.com/news/2014-07-15/portugal-contagion-spreads-espirito-santo-default-portugal-telecom-loan-business-len
Nothing to see here, move along please!
All that matters is Yellen testifying for the next two days so new ATH’s are on the way in the second most ovevalued market in histry by most measures.
In 30 years I have never seen a market more fixated on what the Fed Chairman has to say than has been the case the last 3 years.
And that my friends is WHY the markets are completely BROKEN!
How does the market react to rates exactly. For example if rates are 0.5% and markets yield 3% then would a rate rise to say 1.5% cause a market drop such that its new yield is 4% to maintain the difference in the values. In any case that would cause a huge drop of exactly 25% by my calculations assuming the $ value of dividends remains constant. Surely the market won’t react that much for such a rate rise. Most likely there is extra factor involved there.
http://www.businessinsider.com/santelli-meltdown-on-cnbc-2014-7
Santelli is an absolute goofball —
Gravity/Stock Market:
http://radioamerikanow.com/?p=6701
and….
http://x9t.com/
Kind of interesting, right?
Andre, I am thrilled just to know such concepts. I will now dive deeper.
With my 15 years of experience in stock market I always believed ‘answer’ lies somewhere in Nature which is why I love this site John has created.
I am thankful to all readers who write here.
Certainly is. How are you using the bias to trade? As one can get chopped up and the prediction still be true. You could use binaries on spread betting i.e. S&P to close higher on the week etc
Craig,
Good question. Sunday some more on gravity and how to trade with it.
Thank you for sharing this information
Biotech leading down – encouraging.
“Men who can both be right and sit tight are uncommon. I found it one of the hardest to learn. But it is only after a stock operator has firmly grasped this that he can make big money. It is literally true that millions come easier to a trader after he knows how to trade than hundreds did in the days of his ignorance.” Livermore
Will make a new post tomorrow, market action still unclear. US small caps, Europe indices, commodities in notable downtrends; whilst Sp500 and Dow yet to close above Jul 3 high but have not rolled over. It hinges on how these large caps resolve.
Did Rupert Murdoch top tick the market again?
http://www.zerohedge.com/news/2014-07-16/did-rubert-murdoch-top-tick-market-again
I still think that best option for SP500 is to consolidate till the end of this week and then burst higher in final move for this bull. So for now it means 1980-1985 should provide formidable resistance and it should drop to 1960 before next leg higher. Dow is outperforming so it can play out as a wedge pattern rather then triangle.
I would love to see 2000 as a final top for SP500.