
The evidence for a speculation peak delivered at the solar maximum is better than I could have hoped, yet I’m on the wrong side of it and feeling the pain. When I look back at this post that I wrote January 13, the multi-angled case that I had for a top is still very much applicable. So why have equities gone up not down since?
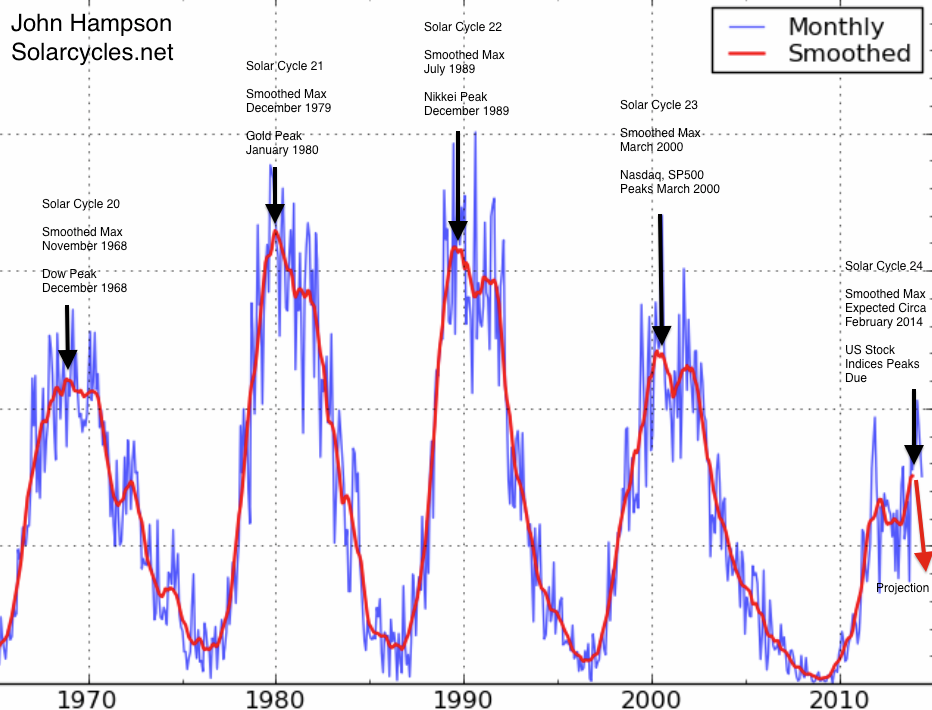
Firstly, the solar max extended beyond scientists’ predictions from late 2013 to what looks like a smoothed peak circa Feb/March 2014. Not much I could do about that. Since then we have seen solar activity retreat, along with margin debt. Drawing on the history of both combined, we can account for stock indices rising into Feb/March but not since. Some retrace in equities was historically normal, but not these persistent higher highs.
Secondly, it would appear we needed more mania. When looking back at gold 1980, Nikkei 1989 and Nasdaq 2000, it’s clear that the manias were fairly intense. Therefore, the record-breaking stretching of indicators that we are seeing seems appropriate with hindsight. I wasn’t trading in 2000 to experience it. The question is when is it all going to snap? There is evidence of both capitulation and ‘all-in’ which suggest the snap should be close, but more melt-up could yet occur before it finally rolls over.
Thirdly, leading indicators, as measured by narrow money, suggested a pick-up in the economy as of May. As equities were able to range-trade until we reached that point, strengthening data has since given them a tailwind to rally further. Those leading indicators now suggest growth could peak out at the end of Q3. So could equities rally and melt upwards for weeks and months yet? A more detailed look is required, so here goes.
This is how the Dow looks. Volume has been ebbing away. Stocks can rally on thin volume, but those rallies don’t tend to stick. Volume is likely to return once it tips over. The action in the Vix and put/call ratio have an air of capitulation.

Source: Stockcharts
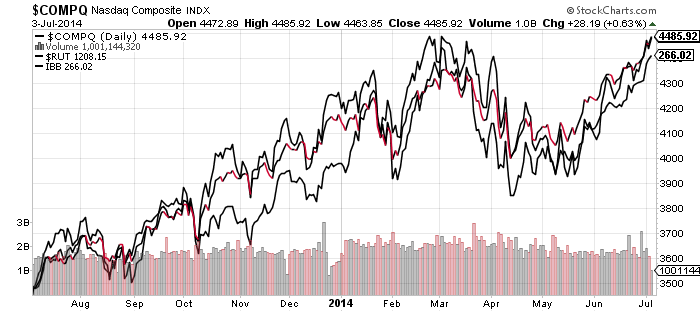
This is how RUT, COMPQ and IBB look:
Source: Stockcharts
If equities were to roll over here, it would be more in keeping with developments in the solar max and margin debt. The Feb/Mar peaks in RUT and IBB, two of the key speculative mania targets, would be maintained and this would fit with the likely smoothed solar max. Speculative peaks have aligned closely with the smoothed solar max in the era of global instant access, whilst certain indices peaked the same month as margin debt both in 2000 and 2007.
 If, on the other hand, RUT and IBB break upwards and out in July and COMPQ puts some distance above its Feb/Mar peak, then it would be more anomalous. How do we account for stocks rising whilst leverage declines? Buybacks still strong, CLO leveraged loans still strong in Q2, thin volume rises, short covering? All applicable to some degree, but it’s still anomalous.
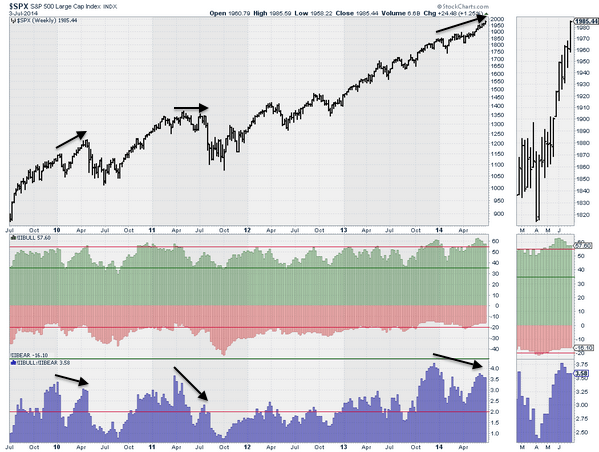
The way things stand, the best fit is still that we are in the vicinity of the last peak in a trio that began at the start of the year. That this is a final melt-up in large caps before the roll over. A trading range (primary distribution) before a final leg up was seen in 1929, 1987 and on the 1989 Nikkei. At the reverse end of the spectrum, 2009 saw a trading range before a final leg to the downside.


In all instances, the final overthrow leg lasted around 4 to 8 weeks. The current break out up leg on the SP500 is just entering that range. Averaging the price increases/decrease, we might expect the SP500 to reach over 2000 before rolling over. Earnings season starts next week, others have mentioned 15 July as relevant, and the seasonality of geomagnetism turns down definitively as of July. So maybe stocks can rally a few days more, reach over 2000, and then roll over against an earnings season backdrop.
These six indicators are calling the market down with little scope for delay:

Source: FinancialCrisisObservatory
Source: Barrons
Source: Jack Damm / Stockcharts
Source: Stockcharts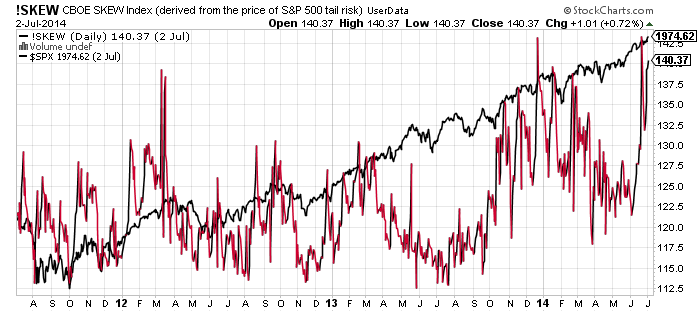
Source: Stockcharts
Source: Sentimentrader
So I would be nervous about hedging with longs here, and won’t be doing that.
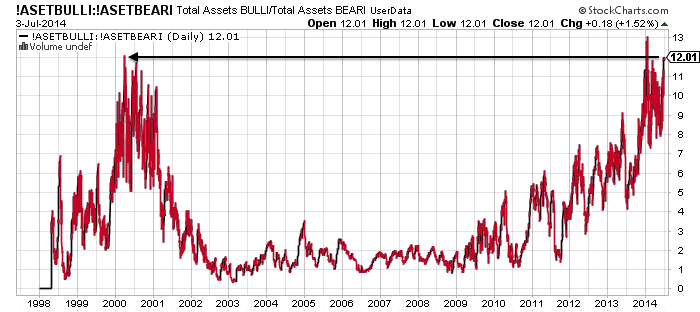
The next four charts show evidence of the mania.
Source: Stockcharts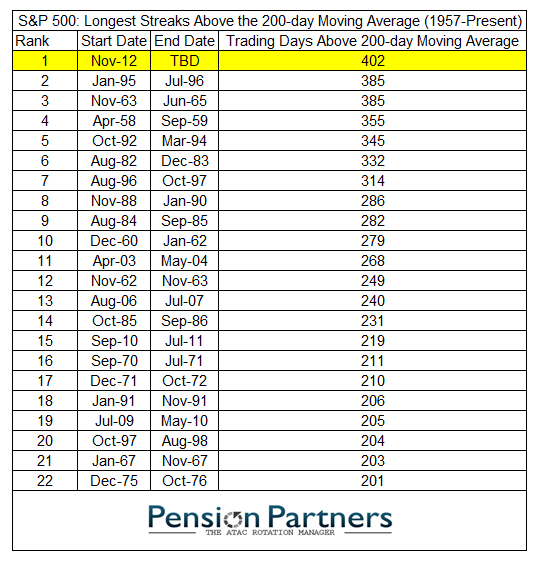
Source: Charlie Bilello
Source: Dshort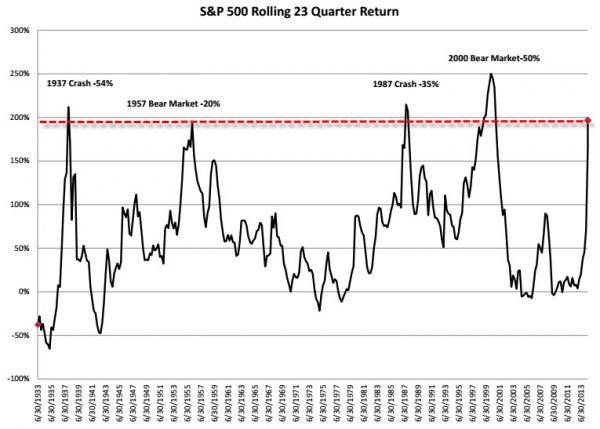
Turning to fundamentals, equities have front-run a return to normal: 10% earnings growth and 3% economic growth.
Economic data in 2014 has been overall reflective of mediocre growth. Barclays estimate for Q2 growth is 2.7%, add to Q1’s -2.9% and H1 is overall negative. Not on track for 3% annual growth. Data items such as the employment report or financial stress conditions appear superficially bullish, but reflect conditions just before previous market peaks.

Source: Chris Puplava
Economic surprises are still negative for the US, but as stocks have largely ignored the bad items, I think it’s fair to say the perception is they have been largely positive.
Earnings season begins again this week with 75% of companies having issued negative guidance pre-season. The theme of margin expansion not revenue growth continues to dominate into 2014:
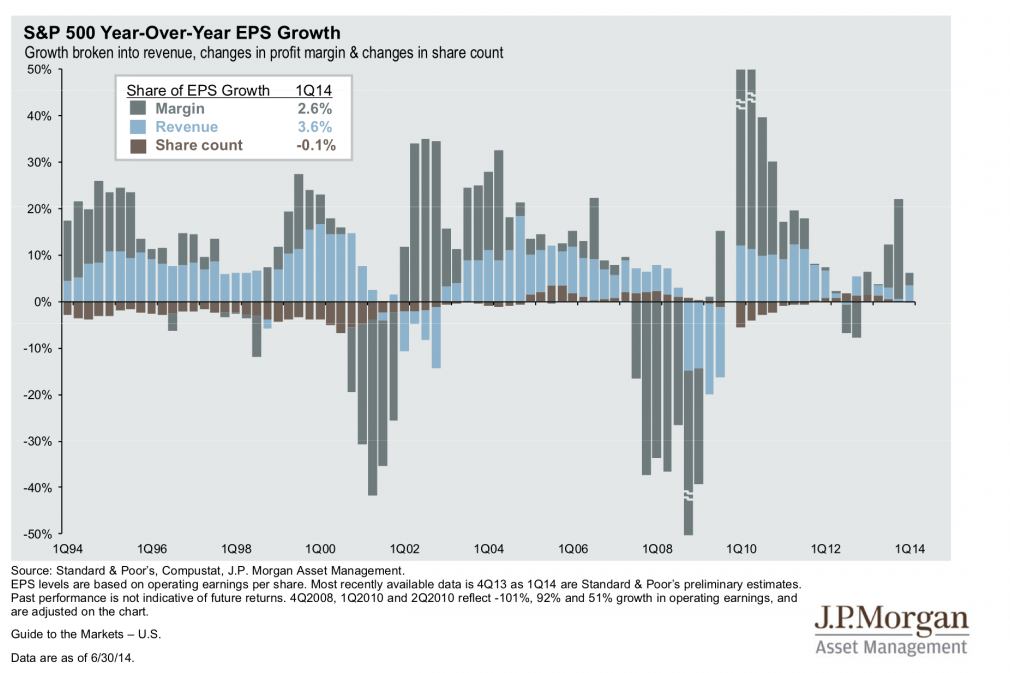
Source: Fat-Pitch
Continued disappointment in both the economy and earnings is likely given demographics and debt. So, in short, at some point equities will turn down as their front-running is proven to be just overvaluation, and earnings season presents a chance for that to materialise. A glance back up at the ‘mania’ charts shows that when equities do turn down, they will likely enter a devastating bear market. There has never been a gentle normalisation from such lofty valuations, euphoria, leverage and compound growth extremes.
Some final charts:
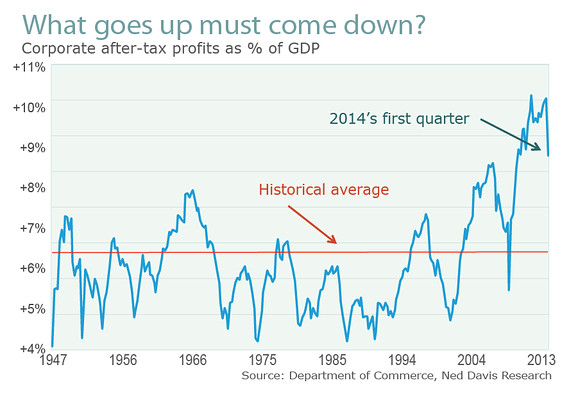
Source: Marketwatch
Source: ShortSideOfLong
Source: Fat-Pitch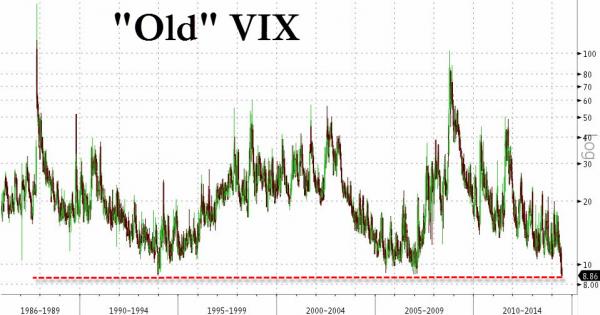
Source: ZeroHedge
Source: FinancialIceberg
That last chart shows very skewed positioning in crude oil, the message being that it may well tumble going forward. That would be consistent with a deflationary shock rather than an escalation of inflation. I maintain my caution on commodities, aside from precious metals.
Time to sum up. I’m short equities and underwater, feeling the pain. I expect some of you are too, and maybe annoyed for having ‘bought into’ my analysis. Personally, I can’t regret too much, as I don’t think my analysis has been particularly lacking. Rather I have consistently presented a cross-referenced, multi-angled case and the large part of that analysis remains applicable today, despite 6 months having passed since I was first convinced. My distinguishing research thread is the solar cycle, and I believe we are seeing firm proof that the solar maximum does inspire speculative peaks, in a real-time test, but equities now have to turn down, and into a bear market, within a short time of the solar max, before that can be truly confirmed. Frustratingly I’m on the wrong side of it currently, having been too early with shorting, as certain reliable indicators have been overrun by the mania-drive of the sun. Lesson learned. Now it is a practical matter of managing the drawdown. As noted further up, there are several indicators that suggest the turn ought to be close at hand so I do not want to hedge with longs. I have refrained from adding any more short whilst we see if the melt-up steepens further. I will stop some trades if things go crazier yet, and re-open once the market has more definitively turned. But I am not keen to do that as I believe the turn has to be close at hand.
I have two scenarios in mind. One is that the RUT, COMPQ and IBB have to turn down here to honour the Feb/Mar solar/leverage peak. That makes a top fairly pressing and would fit with those indicators calling for little delay. Next week is the descent into the full moon and the start of earnings season, so they could fit into the scenario. The SP500 could reach over 2000 within a couple of sessions to fulfil.
The second scenario is that the melt-up steepens and all indices break out. Positive economic data expected through the summer assists, and maybe the solar maximum has another big burst coming. The issue I have with this continues to be the ‘fuel’ for the rally, given that margin debt is declining, households are already highly exposed, volume is waning, sentiment and euphoria suggest bear capitulation, and various divergences are mature. None of these have stopped the rally yet, so I have to respect that it may still be possible. If all indices do break out then I’d be looking for an eventual top followed by a ‘second chance’ retrace before ultimate steep falls.

thanks John
The impact of the FED monetary policies at market peaks/bottoms…with solar activity might help the reconciliation…for now, the Zero Interest Rate Policy is generating too much FREE monies not to be missed by corporate CFO’s…with cash on their balance sheets…sadly, it may take a major event…somewhere in the world, to spark the down turn…lets hope not…
Great analysis John!
I am short 65pct usd/yen and 35pct short stocks (ibb, Internet stocks, euro banks).
Thanks.
One more thing to mention. Money exited utilities and treasuries in the second half of last week. If that is the start of a trend then that money could head for pro-risk.
All my long time cycles are turning over to the down side. And the cycle count (wave structure) indicates we’re in the fifth of a fifth of a fifth. That’s why volume and volatitilty are so low.
I think dec 2013 was the top of wave 3. Then consolidating in w4 untill early march. Since then we are in a fifth wave with record low vix. Within this fifth wave we are in the fifth wave. So timewise, this is a matter of weeks. I stick with my assumption august 4th will bring the turn.
First of thanks to John for all his work. It is much appreciated.
Hello Andre. I have read your comment from last post about gravitational pull of the moon. Am finding that quite interesting. Is there one site where all of the calculations are compiled including tidal cycles as well? So seems like we turn down next week.
Thanks
All the cycle calculations are my own. My tidal calculations are based on the Sandy Hook tidal station. But it needs some interpretation.
I’m happy to share my analysis. Let’s just see next week whether I am right.
Maybe one additional insight : My tidal analysis shows that june 20th was a top and we are down towards next friday/monday.(11/14 july) So last week was actually a tidal retracement in a down trend. The market managed to set a new ATH, but this is a false top. Hence the low volume. Elliot wavers would call it a running flat. So next week will be the third cycle down. Third waves always interesting.
July 12 will show a supermoon and a mercury elongation max, confirming a turndate.
Thanks for your update John.
The bear message should be growing in the zeitgeist as “Bears” the movie gets more play.
We are in the 64 month of the bubble which typically can be parabolic before exhaustion. As long as the Fed can run their VIX-VXX-TVIX HFT algo and crush the VIX, the bears will have a hard time getting the algos on their side. By the way, it is now in the open and not operating in the dark pools. That takes some real hubris.
http://www.zerohedge.com/news/2014-07-01/vix-manipulating-hft-algo-booted-dark-pool-exposed-whole-world-see
Barclays admitted to rigging the currencies in the dark pool as well along with gold and LIBOR. USD/JPY and GBP/JPY are still floating the boat. So a few Fed tools still keeping the tide high.
John
Many thanks again for sharing your thoughts.
Most perturbing was the exit of money from utilities as you note. I suspect the market will melt up some more, subject to a surprise event.
Soul jester had some good wave analysis suggesting a Dow top upper limit of 17391, in one scenario. Doesn’t seem impossible to get there.
Problem with this market is it is ready to go & there’ll be no forewarning when it does, therefore, position yourself accordingly or wait for confirmation & try & get in.
Good luck to all.
This work by John is amazing. We are still locked near price resistance on all sorts of degrees and charts. Two more examples. NYSE is a measured move here off 2009 low (50 retrace and at the 150 extension area. Yearly SPX floor trader R1 is 1989.
My scenario/strategy is we are going down to Sept low. If that low is at support it may have one more terminal wave up. If not this was the terminal wave. It is a question if degree on this final harmonic abc off feb low. That is either the terminal move or the A in the terminal abc. So, whether we are at support or lower in sept prolly answers the probability between the two.
Just what I am going with.
Thanks
I believe a short term high could already be in withthe possibility of the rally extending into the 15th. The ASX200 has been following the short signals over 90% accurate since the beginning of the year. S&P not so much. I believe this is due to an error i made, after correcting this error we are now at a swing point with the next on the 10th and 16th of July. But i could be wrong the S&P seems to.be driven by a malovolent force determined on reaching 2000. How fitting if we top at 2009.
Enjoy reading the intellectual discussions here.
Will be covering more in the weekend video
http://tradingtweets.wordpress.com
I’m sure this chart has been on here before but no harm in showing it again.
From zero hedge “what-happened-last-4-times-stocks-rallied-23-quarters”
http://www.zerohedge.com/news/2014-07-03/what-happened-last-4-times-stocks-rallied-23-quarters
good try I hope it works for you
Looking for a day of incessant buying followed by a negative close.
Hi John, long time no post. Worried you are changing your thoughts on positions. I did say earlier this year I didn’t think it was ready to blow up though until much later in the year and will not be a big correction. Chinese are buying up stocks, WWIII in the middle east going to drive up oil and gold, but not yet. Expect to see some paranoia after US GDP is negative for 2Q’s and then a bounce back due to central bank intervention via controlled corporations. They blamed it on the cold weather, but I’m doubtful. Dow 17K is just a blip on way to tear down. I’ve had 12% gains this year so far to make up a little for last year when I was a bear, but most of that was transportation and gold. I’m 80% out right now, waiting for Sept data and post vacation. I suspect the big one has been delayed until 2019. If you look at solar cycle for the 22 years, 2019 is 11 past 2008. As I have said before Bradley is not projected to dip as low as it did in 2008/9. I see a Fed Rate increase in ensuing years before we get a big drop again. K-Spring is starting, but with less demographics, the spring is tech in nature and revolve around demographics. Think what all the charts show need to be cautious and balance 50/50 to each side short and long – commodities and equities as it ping pongs back and forth and chance that you get 6%-7% return is better then leaning one way or another at this point until we monitor in real time what the cycle does and gather the data as opposed to trying predict it this time around; save it for next cycle. One interesting thing I have noticed is that crime, gold, and war themes globally have definitely followed the sunspot increases this year and rhetoric has waned when sun calms back down. Charting gold price over sunspot count this year reveal such. All the best…
Interesting wxguru, last time Chinese were all in was in 2011 when gold was in a bubble. Chinese were the marginal buyers which pushed gold and silver to their respective heighs. Same could hold here you are right. Adds to my list of anecdotal pointers. Thank you for sharing.
Yeah it was mentioned (chinese) on zero hedge a few weeks back.
Changing thoughts, as in dampening interest in commodities? If so, that was the key demographics research of mid-2013.
http://www.safehaven.com/article/34400/its-not-as-it-appears
OPINION PIECE ON EWT: (Taken from a public blog.)
“Have we not been here before in a world of false economy burying our heads in the sand and hoping it will just all continue just the way it is? I would not say I have faith in the E Wave theory but it does at times make some sense. Current EW setup looks likely that all the Short / Medium and Long Term waves will top in the S&P at just over 2050 and then down we go.
Current analysis is that the minor wave 3 which will shortly become minor wave 5, tops the intermediate wave (5) which in turn tops the primary wave ③. Put simply, the smaller waves are all about to make the more important primary wave ③ top and down we go to ④ before the run up and blow off after primary wave ⑤. I am not so much a technician, but if you read up on Fibonacci and how amazing and coincident life has its cycles, then a lot of this hocus pocus does make some sense.”
End
Comment: Similar pattern in gold up to August, 2011?
https://en.wikipedia.org/wiki/Icarus
John, I like the 1937 analogy, but the solar cycle was still making new highs, with the highest month thus far in 7/1937, only yo be exceeded then by a yet higher month in 7/1938. Both of these highs occurred after the market peak.
(The market peak was on 3/1937 and the market was making lows around the smoothed maximum of 10/1937, and has already rebounded by the monthly maximum of 7/1938.)
The problem with this is that one datapoint does not make a statistic.I am just pointing out that higher sunspot from here does not necessarily mean higher markets, and actually anything can happen with the two variables in the short run.
“Burned by the sun” might be the wrong analogy. It might be better to say “burned by small number statistics”.
Difference in dates here. The Dow peaked Mar 1937, the smoothed solar max was Apr 1937 – where do you get smoothed max 10/37? Plus, see the solar chart in the above post – the last 5 cycles all delivered a market max close to the smoothed max.
I calculated my own smoothing, so the dates are different i guess. But our dates agree that the market could peak before the sun does, but unfortunately not this time.
What about solar cycle 11? The peak was 1871 and the crash was 1873. This was the big one before 1929. I wish the window wasn’t so big, but I can find a good way to predict if a peak comes before or after the sun for a particular cycle.
Late here so forgive me if doesn’t make sense. But I have reviewed your chart on the last 5 peaks. I have wondered if there are often two peaks. 1969 and 1973 nifty fifty, for example. 1980 gold but 1981 Dow. 1990 Nikkei but 1993 Mexican crisis or 1991 gulf war? 2000 dot com, but September 11 2011 attack. 2011 euro crisis and now 2014 small cap. (Going off memory on dates, as I am on the ipad.)
Not sure if this helps in anyway, except your point was that the market peaks close to the smooth maximum of the first peak. This is the second peak; although a rare higher second, I can argue that size does not matter. 1929 was not a big solar max. If so, we need to review statistics to fit the second solar peak to market peaks.
Video: #SPX $SPX Topping process has begun and #ASX #ASX200 update
http://goo.gl/TF01fU
Dude. Nice that you posted a video, but useless without a password to access it.
DrM-)
Thanks all
Here is McHugh’s latest analysis, He is expecting a reversal in the next 2 weeks:
“Stocks popped higher Thursday, July 3rd on light pre-holiday volume in a shortened trading session. The Industrials and S&P 500 hit a new all-time high again, with the Industrials breaking above the 17,000 level and the S&P 500 closing in on 2,000. What we are watching for is a key reversal day and week, where the S&P 500 hits a new all-time high during the day, then closes down, and closes lower for the week. With the S&P within spitting distance of 2,000, we expect it to reach that level over the next two weeks, and then put in a reversal day and week. That is because we have three pretty good cycle turn indicators all in agreement, all suggesting a significant trend turn is likely to begin sometime over the next two weeks. Key reversals can be a sign of such a turn. Perhaps we will see a VIX Sell signal accompany this turn as well. Hard to say but the VIX came within a whisker of a Sell set up Thursday, July 3rd. The best indicator confirming that a top has arrived pointing to the start of the next significant declining trend in stocks would be a new Sell signal in our key trend-finder indicators.
It is looking as if the coming turn as forecast by our next Phi Mate Turn date, the next Bradley model turn date, and a Fibonacci Cluster window is pointing for a top in stocks. We show a chart of this Fibonacci Cluster turn window in this weekend’s report on pages 12 and 13. That top will likely be the completion of wave c-up. If so, this means the S&P 500 should rally toward the 1,980 to 2,000 range over the next two weeks to finish that pattern, then top, then drop hard as wave d-down takes over.”
Actually trading the solar cycle is a great concept. Personally I don’t give a damn what peaks first – sun or stocks. The only thing I care about is not to get excited, so I trade with iron hand and rigid money management. Go up as much I can as it goes up, then the same going down. I prefer the market to tell me the peak is in instead of gambling because of indicators. The price has to tell me. Also let’s not confuse real reversal patterns with wishful thinging and seeing in the charts that’s not there. Trading the market/ignoring the price/looking at indicators is like driving a car/trying to guess what’s ahead/side-looking at the fields.
Here’s an article about s-term US mkt outlook. Nothing new but a professional spread betters view.
http://www.spreadbetmagazine.com/blog/titan-inv-partners-the-market-can-confuse-geniuses-and-fools.html
Hi John,
nice work, as always, well explained. I feel your pain on the short side
on stocks, have been short-term bearish since around 1951 on the
SPX, most of my indicators pointed to a decline back to the lower
daily Bollinger Band – which never materialized. the only good news
is that I am holding a relatively small position.
with that, I am likely to look for an exit on the same, ideally into a
minor cycle bottom due around July 10th, plus or minus a day in
either direction:
http://goldwavetrader.com/page32.html
may retry the bearish side on stocks into mid-July, but depends on
the accompanying technical action at the time.
as for Gold, exited longs at the 1320 level, looking for a potential
drop back to the 1270’s in the coming weeks, then to set up the next
good buy there.
Ok, now the HFT algos printed a 5.40 VIX on a day the market was closed. That is one hell of a push on the rubber band. Someone at the FED forgot to unplug the machines. Now do you believe this is one of their mechanisms? Looks like they just broke it for All to see. Maybe the New York Attorney General can do something about this like they did to the dark pools. Seems the dirty laundry is coming out of the dark.
VIX prints 5.40 when market is closed link
http://www.zerohedge.com/news/2014-07-04/someone-forget-tell-vix-slamming-machines-market-shut
C. Puplava expects a melt up ahead
http://www.financialsense.com/contributors/chris-puplava/u-s-economy-market-surging-payroll-growth-highest-15-years
A scary scenario for remaining bears. IMO it’s less likely than a summer correction at some point. The bull needs fuel to continue and, as in recent days many many bears were stopped, a move down would attract short interest again. If I look at tweets, many are enthusiastic and see finally a kind of logic in the rising stocks. If before they kept saying ‘a manipulated rally which won’t work’, now they say ‘FED induced rally that is an obvious and legitimate rally, although detached from the economy’. Even at solarcycles.net most seem to expect further upside. So, to me it looks more and more risky to buy, especially with no pre-defined stop loss, something so many practice, as if it was a legitimate and logical way to trade/invest. It’s not and never will be, because no one is always right. Exit with a loss is part of the game, regardless of how much we believe we are right.
My unscientific survey of friends who are sitting on sizable gain since 2009 says we are in no hurry to sell ..but we are not buying either…all playing the musical chairs game waiting for the catalyst to cause price to breakdown which has yet to happen.
The perceived omnipotence of the central bankers may last long that people can imagine.
Let’s imagine I go with a bunch of guys to the mountains. Some are fit, some are not. At some altitude some prefer to stop and stay at the hut. Higher, some prefer to stop and wait in a tent. Even higher, some decide to go back a bit and stay with those in tents. But a few decide to reach the top taking on the steepest and trickiest third leg up. A bear in nearby bush is looking at them and thinks : what the hell is going on. The volume of hikers is dropping, but the climbing continues.
Hi John,
This is a follow-up to my previous posts in which I speculated that the market would hit a peak around the June – July timeframe. I now expect a peak around July and bottom around October of 2014.
Unlike you, I think that the market will then rally to new highs either before or up to the next USA presidential elections in November 2016. After that there may be the bear market that you have theorized was coming. But I do not expect the bear market to last because I still think that we are in a secular bull.
It is still my opinion that solar max does indeed influence the market. But, as I have stated before, there may be two solar peaks, and we have yet to see the second peak which was proposed in the following article which I have previously posted: http://science.nasa.gov/science-news/science-at-nasa/2013/01mar_twinpeaks/
As a test to determine if I am right, let’s see if the market bottoms around October. If the market pops to new highs after the bottom then I am correct – up to that point.
Jack
Correction due above SPX 2055, but will disappoint any crash bang pundits. The final leg will take us to SPX 2200. Only then will the actual owners of the global markets choose to vie with each other enough to take to the bear and change their chairs for ultimate power and control.
It seems small investors are becoming less bearish quickly, while they are too hesitant/scared to go long. This is Bad news for traders. A super tedious summer is most probably ahead of us, just as the VIX index and volumes have already indicated.
Even selling options short is currently not as good as it should be. Everybody is selling. Very few are buying. Premiums are so low.
Many people are talking about VIX. But I don’t believe everyone of them knows how to calculate lt. John even didn’t understand his own VIX chart. It’s very clear that, historically, S&p 500 peaked when VIX was at relatively high levels. The stock market is topping while vix at such a low level? This doesn’t make sense. Low VIX means there is no mania at all, no fear either. The only live thing is boringness.
Super Low VIX exists not only in the stock markets, but also in every kind of markets everywhere. This is really scaring for traders, no matter big or small, dumb or smart, lucky or unlucky.
John, as far as I am concerned your research has been steadfastly accurate and the markets under normal circumstances should have topped right on cue, however something has been stinking for a while now and the smell is beginning to filter through everywhere.
I have been saying for months that this market is being manipulated by a very large entity, which I assume to be the Fed.
I have spent 30 years reading “the tape” and I began seeing very “ubnormal” activity several months ago, very similar activity was evident in late 99/00.
I exited my positions in UVXY,TVIX around the same time(some posters may remember my rant) as I realised that these too were being manipulated.
ZH has now provided credible evidence to support that case.
These markets have now reached the point of going parabolic. I stepped aside weeks ago and will await the opportuity when it all comes crashing back to Earth.
In the mean time I remain long gold and NUGT which I expect to continue higher into September.
This is going to end and it is unfirtuately going to to end very badly. The Fed have fired all their bullets. They have nothing left other than negative deposit rates.
Gold is going to explode.
Hi John,
I started shorting last August/September got badly burnt and stopped in October/November. During this experience I started reading your site and have been a fan since – Great work! My pockets are not deep enough to act as a buffer to this manic euphoric blow off which like you I didn’t anticipate. However, I am convinced we are close… Food for thought, would suggest a top on 7/7/14 or 25/7/14 – what do you make of it and those dates?
Thanks..! 🙂
Or potentially:
16/7/14
Or taking G = 7 & I = 9, M = 13, F = 6
G7 implies 14 or 5
G20 implies 27 or 9
IMF implies 28 or 10
So we have: 5, 7, 9, 10, 14, 25, 27 or 28 as candidates.
How do these line up with your work?
What better to do on a sunday morning than contemplating? Disclosure : I am a gravitational junkie. And that for one reason only : it works and there is a scientific explanation for it.
Lots of sites talking about moon-phases, lunar periods, the 118 cd 4 lunar period cycle, etc. How shall I put it mildly? They are confused.
Gravitation is about mass and distance. The sun is big and faraway, the moon small but close. Practically; the moon accounts for 2/3 rds of gravitational pull, and the sun for 1/3. There is no magic in the moon; it’s a rock.
The most direct way to sample gravitation are the tides. That’s why I start with Sandy hook. Its close to Wallstreet and close to the ocean. As both the earth and the moon are cycling around the sun and around each other, Its a bit involved to extract gravitation from tides. But it’s our only option.
Just looking at gravitational cycles I see a 3 lunarperiod cycle, or roughly 93 cd.
Looking at the markets we see a high end of q4,begin of q1, a low end of q1/begin of q2 and now we are end of q2/begin of q3. Really looks like a 3 month cylce; doesn’t it? Must be coïncidance 😉
Chances are we are heading for a low at the end of q3 and after that the well known santa rally.
Tides are oscillators; so they give relative extremes, not absolute. A complete systems need trend and cycles. for the trend we need to look else where. But for trading a 3 month cycle is not too bad.
Maybe solar activity gives longer term trends. Could make for a nice combination.
I sometimes mention mercury. Reason : Mercury has a strong magnetic field and is closest to the sun, so Mercury can and does affect solar winds, catch plasma etc. At a full moon, the earth is positively charged (normally negative). So that could account for some strange things. But that is only at a full moon.
Mars being a malefic planet is not my cup of tea. Jupiter is too far away to have any effect.
So, John; maybe you aren’t burned by the sun but grilled by gravitation. Safest trades will always be when the cycle chooses the same direction as the trend. Hedging your short position when the gravitational cycle turns up could be smart. And once in every 3 months seems doable.
The good news on this glorious day (Netherlands in semi finals!) is that the odds are the gravitational cycle will turn up soon, so the markets will turn south.
For starters; next week will be down. See a low next weekend. After that a high on july 20th, and a low on the 26th and a high august 5.
There it is. Just a little braindump; no advice. Like to think of this site is a classroom with students eager to learn. When I’m wrong : go ahead and call me a lunatic.
Have a nice weekend.
Thanks Andre for your comments. Pl keep posting your findings and view. I am learning almost daily on this site.
Andre, thanks for your contribution. I see the likelihood emerging of a parabolic high in August lower highs in September and crash into October.
At which point markets surge again into late 2015.
I will in any case be selling gold into Sept highs and considering going long volitlity again around the same time.
Cheers
Hi Andre
Call me stupid but to clarify your penultimate paragraph re: up that week, down the next, were you referring to the gravitational effect & thus the inverse for markets or were you referring to the expected movements in the indices?
Thanks
I realize this can be confusing. But the highs and lows I see are in indices. Next time I’ll be more specific. And I never call anybody stupid 😉
Regards,
André
The levels of speculation looked far more dramatic
to me around 99’/2000.
ZIRP has pushed investors in to risk assets,
corporate earnings and record dividend payouts
have also been highly supportive.
The long term change in direction will be
when the next recession begins to come
in to focus.
http://stockcharts.com/h-sc/ui?s=$RUT&p=M&st=2002-1-1&en=(today)&id=p40012891676&a=224691875&listNum=5
http://stockcharts.com/h-sc/ui?s=$INDU&p=M&st=1982-01-01&en=(today)&id=p17798172470&a=325848835&listNum=5
http://stockcharts.com/h-sc/ui?s=$SPX&p=M&st=1987-01-01&en=today&id=p77096787878&a=155290822&listNum=5
Things I think about…
1. One of the largest wealth management institutions sent out a note to clients Thursday pointing out the Dow 17K break, rosy projections for 2nd half, although with increased volatility as yields on bonds tried higher. Will the bond market finally turn now? Will the demographic John says isn’t participating finally capitulate and we see that segment money flow into the markets? If not, where will the money go?
2. Via an M Armstrong education on many things, I do believe its all about capital flows. Money goes to where it is treated best. Money is flowing into the US from Europe due to their continued socialist agenda, IMF bs regarding confiscating 10% of everyone’s wealth, etc.
3. Are we really in a cyclical bull market with a secular bear? Is it possible that the secular bear was over in April 2013 when the S&P broke out? If true, are we in for a 20 year rise into 2032…which happens to be Armstrong’s private wave peak?
4. Armstrong’s AI computers also follow the business cycle….his economic confidence model peaks in fall 2015…a time when he says the economy starts to turn down. Will a market correction occur then due to the global sovereign debt crisis taking its toll? After all, we seem to have a financial issue every 7-8 years…
5. An even more interesting…as more and more capital comes into the US…the dollar will rise…markets will rise….gold will rise in all currencies…everything will rise….
6. Are we in the 1927 inning?…bull markets don’t end in the position they are today and now with the Dow breaking out others will follow…perhaps for 2 more years (thru 2016) with a lot of volatility thrown in…
7. And lastly, an analyst I follow has been more accurate than anyone…as long as rates are low, buy. And as rates rise, the market will rise, as historically this is proven.
8. Shorting is contributing to the rise as well. Stop shorting.
John, your work is excellent and I always embrace your take. Unfortunately it seems we have much further to run here, as impossible as this seems.
Alexa – that all makes perfect sense (although I have doubts about whether Armstrong’s computer can calculate the future!). The only thing I would add is that the movement of wealth from bailin/NIRP/exit fee-risk (mainly bank accounts and bonds) is unlikely to be gradual.
What you say ties in well with the likely timing of SC24’s sunspot plateau – which will probably start to wane during 2015, and cause huge speculative excess through 2015 and possibly into 2016, similar to previous weak solar cycles.
http://armstrongeconomics.com/2014/07/06/the-future/#comments
Andre:
John did a piece pointing out that the only logical rationale for looking at planetary positions were the influence of Venus and Jupiter. Would take a little time to do that search, but I am just calling this to your attention. I think this had something to do with their planetary tides? Apart from that, Jupiter compromises about 60% of the
solar system angular momentum; but that affects the sunspot cycle.
Thanks! What to think of this?
http://time-price-research-astrofin.blogspot.sg/
John, regarding the double peaks, I have several other examples as well other than 1869, 1980, 1990, 2000 above. For example 1871 gold Black Friday and the 1873 market crash, or 1927 Florida real estate and then 1929 market crash. If your examples fit the first of these events, it would appear the market peaks before the sun does. However, 2011 euro crisis already happened and so our goal now is to fit the second peak. Could still happen any time now, but I see the logic of waiting in cash until the second chance?
I feel remiss about not pointing out this fact a long time ago: the theory about when the small caps are leading the large caps. When the small caps are stronger relative to the large caps; this demonstrates a lot of market confidence among the participants and the market is inclined to move higher. But when that speculative
confidence in the market wanes that is the time to be worried, about the general market moving higher. This insight is from an engineer named Werner Ganze, who developed an indicator called “RUTTER”; which was based on a ratio of the Rus2000 divided by the SP500. Indicators on the ratio were then used to create signals. The history of this indicator was popular among mutual fund traders using FastTrack software; along with other add on’s .
http://investorsfasttrack.com/
Anyway, probably an important indicator to watch.
https://en.wikipedia.org/wiki/Black_Friday_(1869)
Thanks — the solar peak then was 1870. I am not claiming repeat will repeat perfectly, but the point being that if it does
1869=2011 crisis
1870=2012 solar peak
1873=2015 market peak
http://www.fourmilab.ch/images/3planets/elongation.html
http://www.financialsense.com/contributors/clif-droke/why-forty-year-cycle-bad-news-stocks
Well everyone is right until we are wrong and vice versa. Demographics play an important role in the longer term but this is not a trading tool and imho cannot be used to time markets. Can be useful to predict longer term trends over decades or similar, yes. I don’t know how or why solar activity should affect humans in terms of trading but am open to the fact that it is possible which is a major reason why I am here.
The truth is that there is no system (yet devised?) that will tell you when markets will turn at some future point. The only way that I know which provides clues is price action and monitoring market sentiment. Highs and lows, areas of resistance and support, market ignoring bad news being bullish etc. Someone mentioned above “looking for record buying and negative close”, which can be a crumb in a line of clues as to what is going on. In my 20 year experience, this is the only way that provides some indication of market “mood” and activity.interms of trading the market that I have seen. the “second chance” that John talks about is something that I have seen where people buy the “big” dip not wanting to miss out on possible rises – usually money that has missed the big up move already. This makes sense from a sentiment and psychology point of view. But, second chances do not always happen, so we watch and see what happens.
In terms of investing or longer term positions this site provides useful information and analysis that can be evaulated and considered. However, in terms of actual *trading* these types of indicators and data in terms of solar activity etc. are not useful. A distinction should be made between trading and investing imho, and the use of various types of information for each. One simply cannot trade a position in the short term based on demographics for example but it may be useful to note when investing for the next decade or two…..
All imho and thanks again for all contributions.
J
Like your candor response. Refreshing to see this on this website
Thanks to everyone for the contributions
Thank you for your excellent work.