
History in the making for the US stock market, updated:
1. Crestmont p/e valuation only exceeded in 1929 and 1998-2000
2. Q ratio valuation only exceeded in 1998-2000
3. Market cap to GDP valuation only exceeded in 1997-2002
4. US household exposure to equities only exceeded in 1997-2002
5. Euphoria and sentiment composite readings only exceeded in 1997-2000
6. Third longest bull market in history
7. Third longest duration above 200MA
8. Margin debt to GDP and net investor credit at all time extremes
9. Skew readings cluster highest ever
10. Complacency, negative divergences in breadth and negative divergences in defensive sectors/assets all resemble peaks of 2000 and 2007
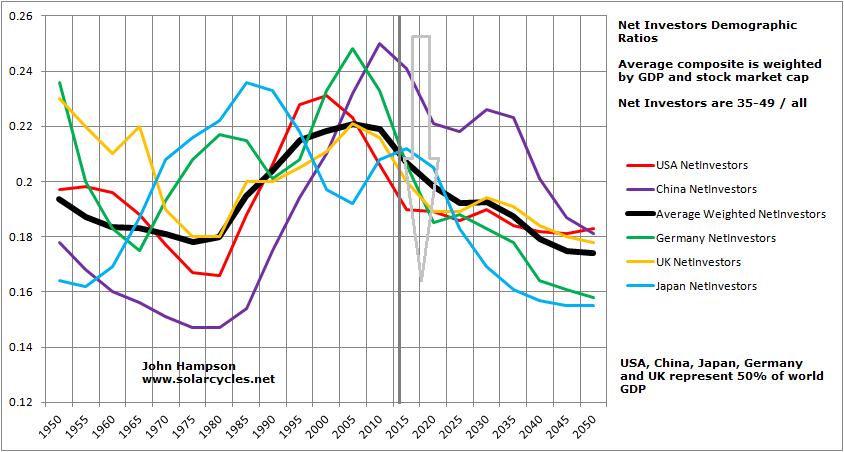
These various measures collectively suggest that the bull market is mature, that stocks are expensive, that investors are all-in and that we are looking at a major top. The only bigger mania in history was 2000, which, in contrast to now, had a demographic tailwind.
There are three ingredients for a super peak: a solar maximum inspired speculation peak, a demographic peak (new buyers buying), and a leverage peak (same buyers buying more). 2000 had all three, but 2014 lacks the demographic tailwind, and for that reason we should not expect to reprint 2000’s all-time extremes.
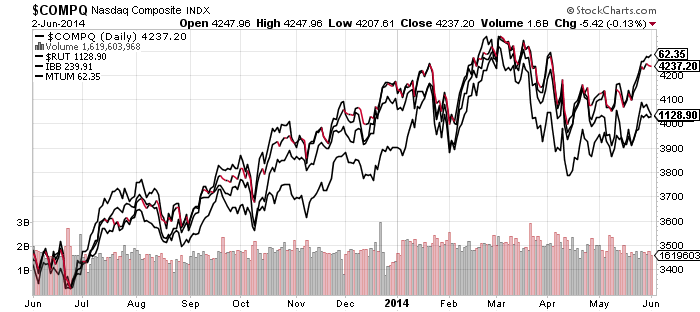
Over the last 18 months we have seen the requisite evidence of a speculation mania, inspired by the solar maximum. During that period we have seen the stock indices diverge from earnings, fundamentals (economic), and smart money flows, and we have seen sharp escalation in leverage (margin debt, Rydex leverage). We reached dizzy valuations in small caps, biotech and social media, and by various measures, major stock index valuations already exceeded 1929 and 1968 peaks.
On current evidence it would appear the solar maximum peaked out along with the main speculation targets around February 2014, which is also when margin debt and net investor credit balances reversed.

If stocks were to move materially higher from here, then we would need to see an extending solar maximum, a further reversal in leverage to print new extremes, and/or a stream of new buyers.
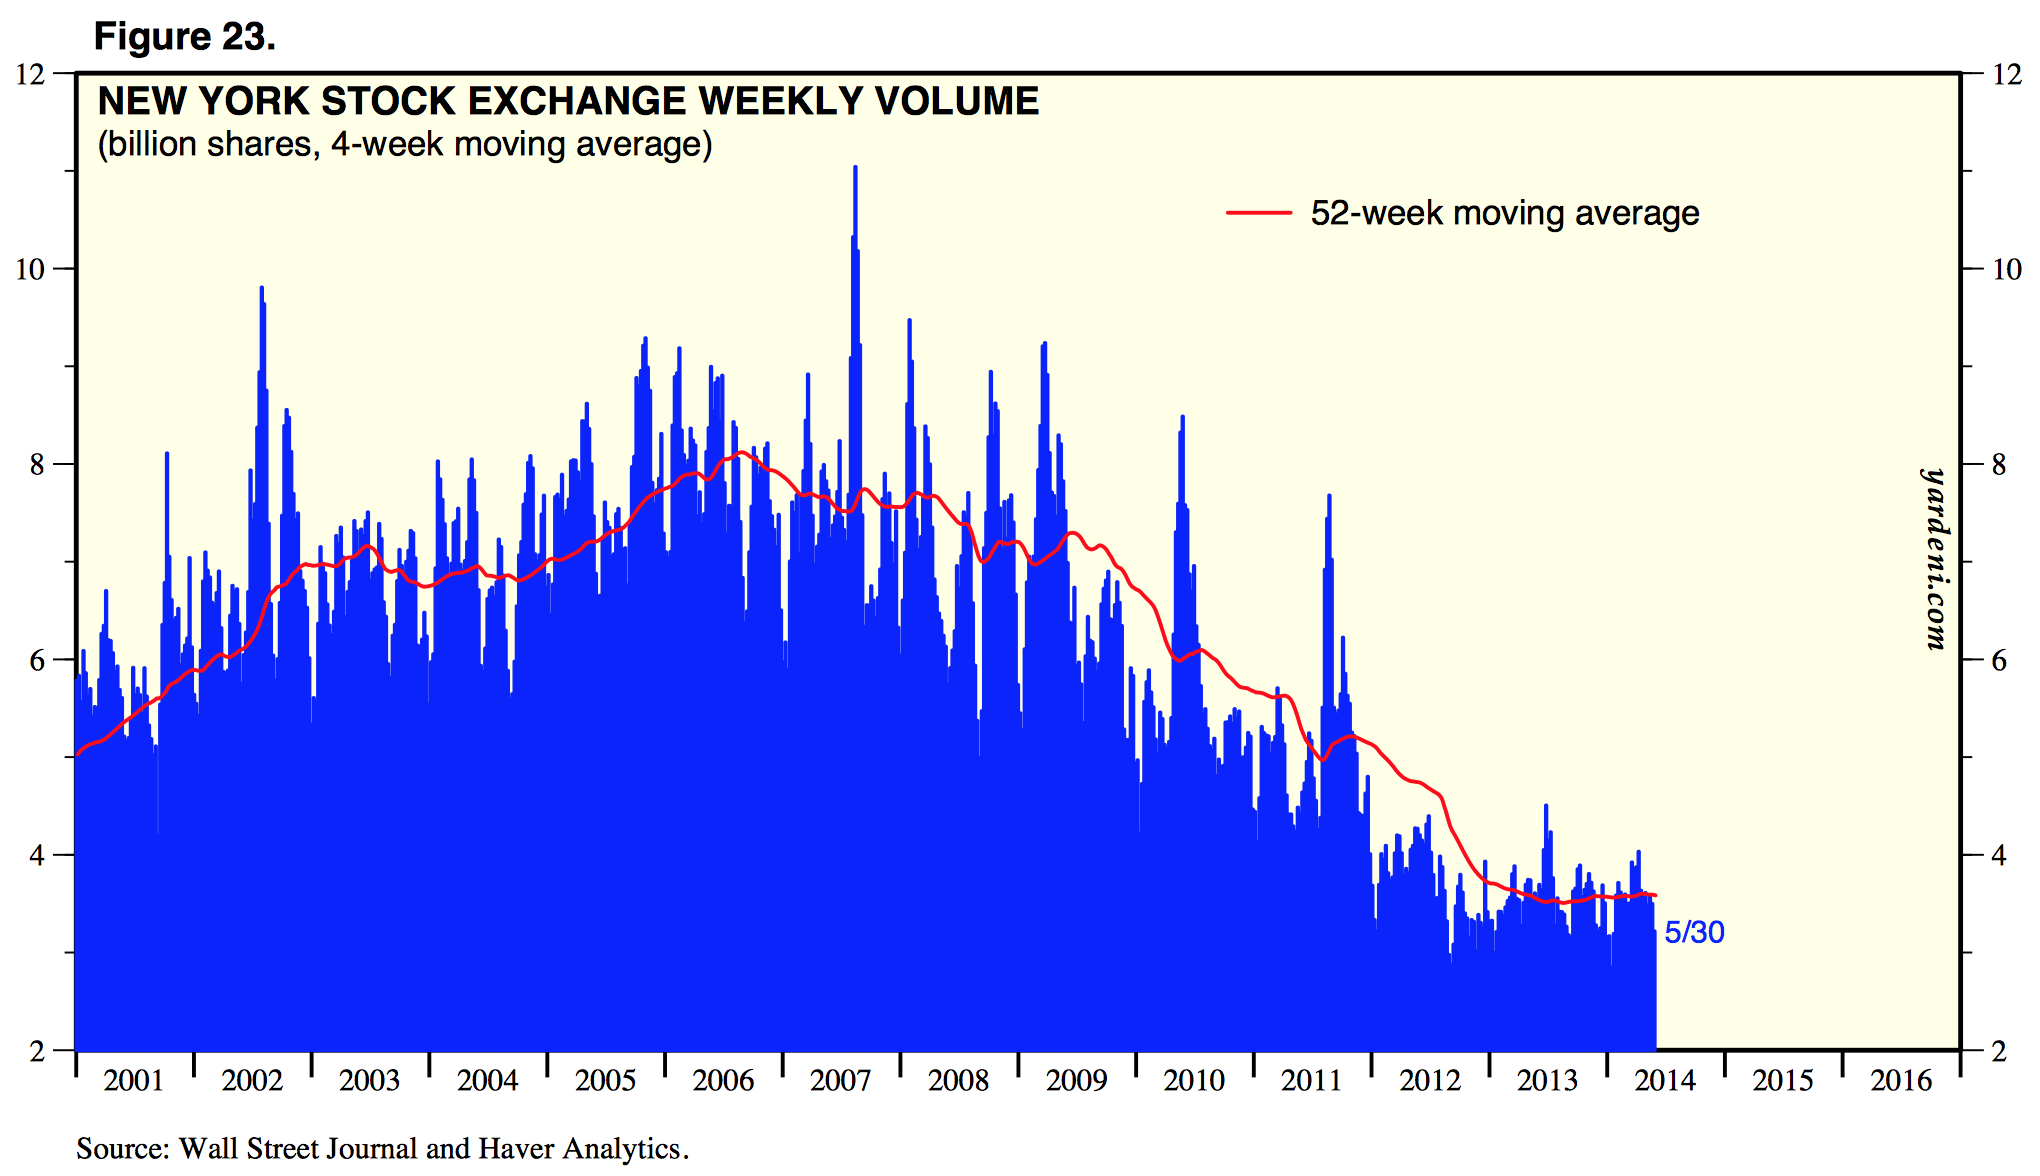
We see evidence for the demographic headwind in shrinking trading volumes, and if we couple that with the readings in household exposure to equities, fund manager allocations, and institutional versus private buying, which suggest saturation, I suggest it is unlikely that we have the fuel for another significant move higher in ‘new buyers’.
I then look at the extremes, spike and reversal in leverage and it is unlikely that increased ‘buying-on-credit’ can provide the fuel for another significant move higher from here. So even if the solar maximum were to extend beyond expectations then I suggest it is highly unlikely that equities would be bid up significantly higher from here, as if this were 1928, as both ‘more-buyers’ and ‘more-leverage’ look exhausted.
Since 2014 began, relative performance of utilities and treasuries, breadth loss in equities, and developments in sentiment have all echoed previous stock market peaks. These warning signals are now mature and add to the likelihood of stocks breaking lower from here, not higher. Not only that, but the combined settings of leverage, complacency, euphoria and levitation suggest that we are on a cliff-edge heading for a sharp crash.
I’ve added short again on US stock indices as I continue to see a historic opportunity at hand, and I believe the evidence suggests there is little fuel for a significant leg higher. Rather, the evidence suggests that we are in the last gasp of a topping process.

I would add shorts positions +17K Dow Jones, +8K Dax +7K Ftse +11K Ibex. We need a little more euphoria, must regard the surpassing process in logarithmic scale in the Dow Jones from 2000-07-14 -the trendline; similar process -no in timing-, 1909-16-19.
As you know I mantein that they modified the 1966-83 structure in 2012 and now they develop the 1906-23 structure, before the final step, the tremendous spike from 217-18 to 2023, the end of the 300-years-cycle from 1720, and the Capitalism Label with a roughly 90% discount from the top.
The top is likely, as I wrote before now, in jun´14 or may be with marginal highs btw ago-sep´14 similar to 2007- jan-jun-sep- 1 month before.
Downwards scenarios> 1st. to the MMA 11K 2nd -0,76 fib. 9K and 3rd scenario to reset the previous bottom around 7K.
Regards.
@apanalis
Great analysis; thanks.
Interesting observation John. Thank you.
However, how do you know that this matter for the future of markets?
Interest rates are 0 and money is being printed globally. Perhaps, a better comparison would not be recent events such as 1999-2000 etc, but for example Weimar or Zimbabwe etc.
Maybe you could compile a study of various hyperinflations with the solar cycle and see how markets behaved then and use this in your analysis too.
Thank you for sharing your thoughts.
Also… many individual stocks are still very cheap which was not the case 1929, 1999 and 2008. Only indicies are a dangerous indicator.
Also, the volume study would suggest that there are still paper buyers out there on the sidelines that may come back to the markets. I can not easily reconsile the ideas about demographics with low volume. Can you propose some evidence for this. Kind regards
Disinflation, meagre growth and low revenues in the major nations despite 5 years money printing and ZIRP; Answer = demographics.
Look at this chart….
http://www.stocktiming.com/Tuesday-DailyMarketUpdate.htm
http://www.peakprosperity.com/podcast/85680/steen-jakobsen-expect-30-stock-market-correction-2014
Charts today start with this interesting observation from the GaveKal Capital blog (link here): ‘ The previous two peaks in equity mutual fund assets as a percent of total money market assets occurred in the 2.6-2.7x range. Today equity mutual fund assets are 3x money market assets and have leapt all the way to 3.75x when we include ETF assets’
In 1929, the Federal Reserve raised interest rates several times in an attempt to cool the overheated economy and stock market. By October, a powerful bear market had commenced. On Thursday, October 24th 1929, a spate of panic selling occurred as Stock Market Crash of 1929 Newspaperinvestors began to realize that the stock boom was actually an over-inflated speculative bubble. Margin investors were being decimated as large numbers of stock investors tried to liquidate their shares to no avail.
Same in 1999 and 2008…. Short term interest rates need to rise for margin investors to get hurt – until then they enjoy the yield spread. =)
Yield spread – yes, it all depends on what brokerage firms charge for margin. In my experience it can be as high as 8%, even in this ultra-low rate environment. I am not so sure the yield is positive as you suggest.
Try Interactive Brokers
I know IB – but also consider that UBS (as but one example) charges 6.4% on debit balances of $1MM, and 7.5% on $100K. In a declining market, this negative carry can really begin to bite investors.
I wonder how much margin investors influence the market.
Not more than 10%.
Interest rates must be positive ,+5% to give the millions of baby boomers a livable return. Until then…….. its a BULL market
Here, the ZIRP leads to the idea that “the rising stock market will never break”, but we know that this is not true.
The stock market did and can break down on ZIRP, two sizable corrections occurred in between the QE interventions, this has been posted on John’s blog several times:
John, you are selling near the top of an “n”, you will be rewarded by sitting tight on your shorts. and wait for the turn.
I am holding some shorts for my own reason…setting up my bragging right.LOL.
Kimble has a S&P500 target of 1929 as a 261.8% Fib target from the 1974 low. That would be a few days away. Will Draghi’s ECB speech set off the reversal?
http://blog.kimblechartingsolutions.com/2014/06/sp-500-within-1-of-target-price-now-where-do-we-go-from-here/
Either reversal or breakout. Indices at key points …
NDX double top
Dow at multi year resistence
SPX at fib extension
Russell hanging onto 200sma
Im now of the opinion that we shall get a correction but no bear market as per presidential cycle.
Every strategy is just theory until proven to work. Testing will not only be at the mercy of testers’ wishful thinking, but for some reasons unforseen things will pop up when putting a system into practice. ‘You can’t tell till you bet’ – J. Livermore.
So, if day trader knows within weeks that something doesn’t work, long term trader needs years to be proven wrong. He needs to trade around at least 3 solar cycles to see if it works for real. Until then, it’s just theory. With the benefit of hindsight everything looks clear and obvious, but when it’s in the making, it looks different. I used to laugh at TA patterns explained in a chart the way the pattern was highlighted after completion. Show me how the pattern starts, and notice how many times within the same chart it looked like starting but morphed into something else.
Mr Ben Shalom Bernanke apologized for “the Great Depression. You’re right, we did it. We’re very sorry. But thanks to you, we won’t do it again”. Someone else will be apologizing in 100 years for what’s happening today. How many years the public needs to learn a long term pattern?
Because these are unprecedented times, history is not so important. The public was put off by 2 bear markets in the last decade and this bull was sold into. Onto whom the big hand would unload their stocks now? They won’t be selling; the public thinks they were smart to give up a little strange rally, “which would end soon as the times are ugly….”
John, you say it is one of the longest bull markets. Is there any correlation of length to the other ones i.e. solar minimum etc or a big depression etc. Many thanks.
There should be few solvent jump-the-gun bears remaining. All this seemingly endless thrashing about and Caldaro has had it nailed all along. Good job I was introduced to Elliott wave theory, because that is the only market-related theory that has ever appeared to work with any semblance of real-time success.
Hi Peter, what would Caldaro’s forecast specifically be?
Here’s his blog: http://caldaro.wordpress.com/
Every weekend he posts about the big picture. Here’s his most recent weekend post: http://caldaro.wordpress.com/2014/05/31/weekend-update-450/
Hi John. Thank you for your excellent analysis of the markets. My two cents: We are now going into the summer rally period which seasonally has been the weakest period for the equity markets. First two days of June normally bullish but as week goes on it gets gradually more bearish with Friday being a particularly bearish day. Leading into and after triple witching on June 20 markets historically go very bearish and I will be looking for markets to if not already in an intermediary downtrend to start one. September has historically been the weakest of all months which should pour more fuel to the fire but after the midterm elections markets should yet again muster a strong move up which has historically been a very strong period for the equity markets. Let’s see.
Thanks Lars for your inputs. Surprisingly, Reader Scott Liou (30-years experience in lunar astrology) in one of the messages in this Blog also suggested June 6 as possible Top. He also mentioned October 2014 as possible bottom month and then rally up to Sep 2015.
Please continue to post for the benefit of all.
Thanks for your interest,
The following are my humble personal view points for your reference.
In the Chinese astrology, the calculation is like this.
Each year, month or day is symbolized by a combination of upper(sky) and lower(land) factor. The upper is obvious and the lower is hidden and ready to show up any time. The year of 2014 is wood(upper)/fire(lower). Wood adds strength to fire. So, the dominant factor is fire. And the lunar month of May and June is gold(upper)/fire(lower). Fire melts gold. If year and month factors are taken together into consideration, you will see year wood enhances two fires in year and month. The weak gold is sure to be melt during these two months. Pathetically, in 2014, gold stands for fortune, and fire, your enemy. So June and July will see people take away your money frantically. But nobody will sit and wait to be robbed, so there are wars over fortune. The lunar May starts from June 6, which is a starting point of the 2-month choppy market, not necessarily the peak. I choose to stay on cash and have a long vacation in Hong Kong and Singapore.
Thanks Scott for the explanation.
I now understand as per your calculation 2 months from June 6 (roughly up to Aug beginning) could be volatile and we may see both – up and down moves in Equity markets during this time.
Now, I want to ask you one more thing. You mentioned October 2014 to be worst month in 2014. Does this mean we may see sharp downside again in Oct 2014 after beginning Aug?
Dear Jigs,
June and July are choppy months, when equity markets go up and down. But at least you see some ups. In August and September, the markets seem to become stagant and less volatile. Perhaps the fed steps in to help. But beware! The last bomb in 2014 is October. But this is also a turning point from bad to good. From 7 November to new year end, the market is to look up. For your reference.
Scott, could you elaborate on the connection between the Chinese calendar and the solar cycle? I believe the full era is 120 years — 12 animals, 5 elements, 2 polarities, taken from observation of Saturn/Jupiter conjunction and periodicity of 10, 12 years. In a sense, it is similar to the solar cycle of either 10 or 12 years.
If so, does it say that 2014 as a whole is a bad year? What about 2015?
Dear John Li,
The following is just my personally opinions, just for your reference.
Generally speaking, there are two categories in Chinese astrology, all of which are based on lunar studies, one to forecast the future of an individual and the other, geographic prediction. The former is widely studied with established rules, while the latter is less accessible. But a company (such as PG or DJIA) can also be viewed as a person, effectively applied to the former model. The calculation is based on 60 combinations of 10 upper factors and 12 lower factors, namely, fire, earth, gold, water, and wood. The calculation process is very, very complicated. The solar cycle is similar to it in terms of 10-12 year period. Since NYSE is my arena, there are three things I trace almost every day — 1) the luck of mine and my employees’, 2) the trend of DJIA, and 3) the trend of US economy. (Sorry to skip 1)) For DAJI, 2014 is definitely worse than 2013. 2015 is worse than 2013 but better than 2014. As to the trend of US economy, I turn to a theory of geographic prediction. According to the theory, the lot of a place changes every 20 years, and there are nine diverse cycles. So, the whole thing will repeat every 180 years. That is, US economy in 2014 is similar to that in 1834. To be more precisely, the trend and people’s feelings are similar. If you compare the US economy data of 1780-1834 with those of 1960-2014, you’ll be amazed to find almost all the booms or panics correspond. The history does rhyme! What astonishes me is that there was a horrible 8-year panic starting from Aug. 1835, with a 75% equity shrinkage. Combining 2) and 3), I am convinced that a financial catastrophe is to hit us in the fall of 2015. John Hampson is the only expert to look into this in different aspects objectively. He has my compliments.
Thanks Scott for your explanation. I have monthly chart of 1834’s S & P 500 and I see that in 1834 in the months of Jan, Feb and Mar it was down. Then for the rest of 1834 it was only up. In 2014 we have seen Jan and Feb down. Does that mean that S &P 500 will not come down at all in 2014?. May be It may remain just sideways?
As you said correctly in 1835 it started big decline from Sep 1835 and bottom was made only in July 1842.
Dear Jigs,
Astrology, lunar or solar, only predicts trend, not magnitude. Cycle 24 is said to be the smallest one ever, but will the corresponding financial crisis be less or more harmful? By how much in terms of money? Nobody knows. But bottoms and peaks are similar, which help in prediction. You may compare a general chart of 1780-1834 with one of 1960-2014, and focus on the corresponding bottoms and peaks. You’ll see what I mean. Astrology is like jigsaw puzzle. You’ll never have the whole pieces. For your reference.
ZIRP might only last another couple of days – when the ECB introduce negative deposit rates. And we are repeatedly threatened with the forthcoming “bail-ins” (if not later this year, then early next…).
And now this: http://www.telegraph.co.uk/technology/internet-security/10870594/Police-sting-protects-Britons-bank-accounts-from-Russian-hackers-for-two-weeks.html
Those damn Ruskies are coming to empty our bank accounts!!!
When money starts to leave bank/savings accounts, where might it go?
1. to perceived safety (US stocks?)
2. follow standard industry advice (US stocks?)
3. chase high prices, as most investors love to do (US stocks?)
This market is becoming a greater farce day by day. The numbers and satistics showed by John have to be respected but this market is ignoring everything.
http://www.zerohedge.com/news/2014-06-03/top-first-quarter-corporate-profits-tumble-most-lehman
Major market tops appear to correlate to the “Top 1% US Pre-Tax Income Share”, it is now at the comparable levels of 1929, 2000, 2007.
Top 1% US Pre-Tax Income Share, 1913 – 2012:
http://www.newyorker.com/online/blogs/johncassidy/2013/11/inequality-and-growth-what-do-we-know.html
This is an example where some of these long term indicators that are being bandied about should be treated with caution.
What about the fact that in 1972 the market looked cheap by this metric and then it halved?
Not only 1972, there were certainly many sizable corrections in a secular trend.
If the 1929 level is seen as an indicator that foretells a secular turn, then loft levels (2000, 2007, present) comparable to that of 1929 should also be treated similarly. Furthermore, the occurrence of multiple ‘turns’ since 2000 seems to echo the interventions by the Fed through stages of monetary policy (to combat the secular turn).
Perma-bears singing the same old song on a different day.
Gianna, I have been a trader for a very long time and your “perma-bear” comment is quite frankly disrespecful to those of us that refuse to buy the hyped up speculation of a late stage bull market and it is “cliche” to say the very least.
Your perogative is to buy the hype if you so choose, but you are ignoring just about every indicator one can find that shows this market is done. The easy money was to be made from 2009 through to mid/late 2013.
If you think this market deserves the risk, fine, but read this first!
Cheers
From SentimenTrader:
“As of April, the latest data available, there was $4.05 invested in stocks for every $1 stored in money markets. That is 31% above what was seen in 2000 and 19% above the peak in 2007”
I find your comment in particular, disrespectful to our host!
Perma-bears? Is the solar cycle at a perma-low? The song has changed with the cycle as John has pointed out – you seem to have missed the entire point of the articulate posts…. too bad for you.. lol.
Is it me, or are there no more geomagnetic storms lately? Is that the reason why the market is holding up despite lower sunspot counts?
There has been enough disturbance for a downward sloping cumulative geomag trend, but no major storm since Feb

Thanks! How do you generate the data for the red line? I would like to do some regressions on excel.
http://www.swpc.noaa.gov/ftpdir/latest/DGD.txt
Thank you!
Thanks everyone.
Sornette bubble-end flagging a second time on SP500:
https://solarcycles.net/?attachment_id=7051
Also: Investors Intelligence Bulls up to 62.2. Other times >60% Dec ’13 (61.6), Oct ’07 (62.0%), Dec ’04 (62.9%), Aug ’87 (60.8%)
There is ONE thing of which I am certain. So many bulls are going to get taken to the cleaners. They think they can out smart this market and get out before things get ugly.
Sure a few will time it right, most by luck rather than by any sort of good management. Those that get left behind as the door slams shut will be left to close or sell into a vacuum. There will be NO bidders and if there are they will be so far under any offers as to appear inconceivable to any thought of justification.
This market is going to be brutal in its lesson………BRUTAL!
Allan, I am not so sure. I think the bears lost this cycle….many of them are now bullish. For example, GMO. This the bulls you mention are former bears. Also many hedge funds are shutting down — by definition, they short and underperform. So even if they want to stay in, they are forced to liquidate.
I say this as a bear…our payday will come, but let’s not get emotional from the solar max. I know the bull taunts are difficult…
John, bull taunts don’t bother me, disrespect does.
As for the market,, I point blank refuse to buy a market based solely on price, especialy a market that ignores just about every market indicator ever devised.
This current top is no different to the last one and the one before that. Many of the players may be different, but they tread the same pathway amd are destined to ignore the lessons of history jst as they did before.
The one thing my father taught me to respect above all else, RISK!
The level of risk in this current market exceeds anything I have seen in 32 years.
Allan, agreed. The biggest tragedy is when really smart people capitulate and buy. Newton did in the South Sea bubble. Now GMO, while not saying it directly, is saying markets will rise and they have an allocation abet small. Hugh Henry capitulated last year — and then lost early in the year when the market did dip. (http://www.zerohedge.com/news/2013-11-22/hugh-hendry-capitulates-cant-look-himself-mirror-he-throws-towel-turns-bullish) I have many more examples, which I note in my diary.
As for shorting, that is a much harder game, which I have not yet mastered. I have been infinitely patient, but the market is even more so. The most difficult part about being short is the bulls taunts, because emotions lead to reflex actions that by-passes the neo-cortex — and it then leads to Newton buying at the high, etc. Even the smartest person withdraws his hand from the fire, as the primitive brain takes precedence in times of pain. I find the solar maximum interesting because it enhances all of our emotions.
This equity bull market has to be one of the most hated in history. Hence why it probably keeps going up.
The only indicator that counts in the present, in the ‘now’, is price – and unfortunately, we are still seeing a pattern of higher highs and higher lows.
Sorry but I don’t buy that reasoning. If price was always the justification for buying then the market would never have a bear market.
And so goes rhe saying “Mr Market is always right”…..
Was it right in August 1929?….Was it right in 2000 with Nasdaq 5175?
I don’t think so.
I agree with the bulls that the market will not crash like 2008, which did not crash like 2000. I don’t really see the point of arguing that the P/E ratios in 2000 were far worse, because yes, they are indeed worse than today. Why should we always use the last two data points anyway?
But what about the previous 3 before?
China/Hong Kong 1997
– Real estate bubble. Sounds like the current situation in China.
Japan 1990
– Over leveraged system with bad loans. Sounds like China today.
Nifty Fifty 1969-1974
– This was a much hated bull market too. People bought because of inflation concern, and hoped that the nifty growth stocks could outgrow inflation.
Could you provide evidence that the current bull market is more hated than that of 1970s?
I have said this several times before. My real concern right now is that this solar maximum is like 1959, where no crash that I can find came, unless you count the one 3 years later. If it is like 1929, at least I know I am waiting for something to come.
Other than 1959, and excluding World Wars which shifts the crash to man-made timetables, we always had a crash around solar maximum. Yes, 1873 came late and before that my data is very spotty.
I hear that phrase “most hated market” relentlessly on CNBC. How is this measured?
http://www.grindtv.com/outdoor/nature/post/unprecedented-solar-eruption-filmed-nasa/
Interesting article on impact of prospective ECB activities:
http://www.marketwatch.com/story/5-unintended-consequences-of-draghis-big-bazooka-2014-06-04?dist=beforebell
Allan, you miss my point. Ever since the equity bottom in march 09,, numerous pundits have been calling for the bear market resumption – robert pretcher is a prime example. Admittedly, they’re slowly giving up – hugh hendry ‘threw the towel in’ in december. So, i’m not sure if everybody is ‘all in’ at the moment. The gold bugs certainly aren’t.
Also, you quote the major tops of 1929 and 2000. But what are the chances of catching it? Major turning points may occur once or twice a decade.
All i,m saying is maybe we should wait for a pattern of lower lows and lower highs.
Some believe that the S&P 500 is not in a bubble and I agree. I also don’t believe that gold is currently in a bubble. I know that there are dozens of charts thrown around to support both bulls and bears, but I choose to focus only on where I believe the bubble is.
Bubbles don’t have to occur in the same place — they seldom do. This time around the mispricing is in small cap stocks — a Google search on valuation can determine this. Thus the relevant indices are the Nasdaq Composite and the Russell 2000.
The Nasdaq Composite did make a lower low on 4/15/2014 and I believe is making a lower high soon. I just don’t know the timing as to whether it is 6/2014 or 9/2014. I assume if that does occur, your desired pattern is complete?
You are right on the chances of the bears. It is about 20% in a given year, if you assume that they have no skill at all.
Assuming we agree that bears have no skill, they are wrong 80% in a given year, and have been calling a crash for 3-4 years now. The chances they will catch it in any 3 year period is thus about 50%. Not a very good statistic to be a bear, but at this point, not something the bulls would want to bet against either.
Hi all
For what it’s worth low volume with a grinding higher price is indicative of long positions just holding, not many buyers at this level so price goes higher to test the greed.
Whilst i appreciate the work and cases made here based on cycles and things that seem to fit with historical outcomes I wouldn’t and don’t trade on them at all. The tape is all that matters and as a few have said until we see lower highs and lows and/or key levels violated the low volume holding pattern will continue. Having said that I have taken non-leveraged short positions on SPX now which I will hold more as a hedge against other somewhat non-related long positions in other areas with a view that I may make 20%+ profit at some point by autumn. If key levels are broken I am happy to add.
Carry trades are performing well and look like they could continue especially if ecb cut a 10-15 points soon although these are relatively small positions.
I am a bear from a fundamentals point of view but I don’t trade on those or historical cycles. I differentiate between trading and investing and separate pots for the different activities. As such from an investing point of view I am happy to hold gold miners, China and Brazil having bought on weakness over the last weeks and months.
Of course I could change my mind tomorrow at the drop of a hat:)
Good luck all.
J
The markets always seem to recover heavily towards the end of the day. Someone really wants to keep this market up!
I put the following up for all to decde for themselves. Many will think it rubbish.
Here is a weekly chart of the SPX going back 3 years. Take particular note of not only price, but also the negative divergences beginning the first week of April
The markets were in what could only be described as a precarious situation.
Price was within a breath of breaking below uptrend from the 2011 low. Negative divergences signalled a imminent disaster.
And what happened? Miraculously markets did an about face for absolutely NO reason whatsoever.
I remember the days on which it ccurred and the actuall time of day it occurred because I havebstudied the tape carefully.This was IMO of no coicidence. I know this will be met with disdain from many.
I know many will say it is circumstantial, but as far as I am concerned the evdence speaks for itself and explains why the market has been fighting John’s SC turn.
Just look at the volume. They definitely know what to buy to achieve their end result……..how much longer can they keep the illusion going though?
http://stockcharts.com/h-sc/ui?s=$TRAN&p=W&b=5&g=0&id=p76344963287
Sorry wrong NDX but similar applies
http://stockcharts.com/h-sc/ui?s=$SPX&p=W&b=5&g=0&id=p72181093134
The ECB announcement tomorrow could be interesting. It ‘could’ send the markets flying.
SCARY FOR BEARS
http://advisorperspectives.com/dshort/guest/Chris-Puplava-140604-Two-Events.php
Nice link. Quote:
“Summary
Markets entered this week at a short-term overbought condition and are likely to pause. Adding support for a pause are the two big news events that come later in the week: the ECB meets on Thursday and we are treated to May’s jobs report on Friday. Germany has remained the biggest opposition to large scale monetary easing by the ECB, although a weakening German economy and inflation rates approaching negative territory may put some pressure on the Germans to soften at the edges and allow the ECB to act more aggressively at this coming Thursday meeting. On the domestic front, estimates for May’s jobs report are for a monthly gain of 215K payroll additions, down from April’s 288K growth pace.
If either or both the ECB meeting and the jobs report underwhelm expectations, we are likely to see some weakness in the markets as would be expected. However, given the level of bearishness by hedge funds and with BOFML’s Fund Manager Survey showing active managers’ cash levels at a two-year high, there is a great deal of healthy institutional bearishness that suggests markets continue to climb a wall of worry. Also, given how commercial traders—i.e. “smart money”—are positioned, I’d tend to side with the bulls in not expecting a major top anytime soon.”
Sums up what i’m feeling.
Ref NYSE investor credit. A related chart is NYSE margin debt. It is quadrabolic! The rise into the 2000 top was parabolic as well as into 2007 and now. Plus the entire chart from 1982 is parabolic. That is 4. When it breaks, the margin calls will break records.
Some believe that hedge funds which are not around in 1980s skew these numbers — as they are both long and short, we don’t see the net position. In addition, markets/gdp grow over time, and so we have to normalize for that. I believe that the system is better protected than 1929, where margin was 10:1, and there are no circuit breakers.
As usual im finding lots of very compelling articles to get very long and very short, rydex chart from yesterday i posted and now chris paplova today.
its sometimes best to read nothing and just look at the chart and do wot its trending until it changes
the russell 2000 is looking like 1173 is likely to complete right shoulder.we are in wave 4 correction at moment from daily chart w3 was 1.6 x w1 and i get breakout from w4 as 1134 if u add w1 to w4 breakout gives 1173
Market is relentless in squeezing bears. Either today is last gasp of exhaustion and market closes lower on daily or this will continue into weeks and probably months.
I agree. John had a great entry on his shorts, but I have been short for longer, and would not be claiming victory even if it crashes now.
An s&p market top of 1929 would be neat !
Reminds me of the 666 march 09 bottom lol.
Would then the crash be similar as in 1929 ?
S&P500 just missed 1929 today. 1929 is a 261.8% Fib target from the low in the year of 1974. There should be some resistance around it.
Another reader posted this a month or two ago: http://www.safehaven.com/article/33230/the-64-month-bubble-pattern
SP500 is now in month 64. I remember reading about this pattern in the gold market back in 2009, but it failed then.
I would ideally like to see a spike up until the middle of next week for an excellent shorting opportunity.
For all our talk and analysis, I would love it if this simple model will prove superior to all in timing this peak!
Interesting that the average solar cycle is 128 months. 128 x 0.5 = 64 months. I wonder if there is a relationship.
I hadn’t thought of that relationship before.
Here’s a possible connection:- all of the successful 64 month bubbles/bursts mentioned in the article happened at solar peaks; wheras the 1987 SP500 one failed (so did the 2009 gold one).
But then again, it all depends on whether we’re at SC24 peak now, or not until 2015/6 – so I’m back where I started!
Very Interesting. I posted David Nichols’ 64 month bubble pattern and his work is fractal based. All fractals have to be related to cycles. Have a look at the Metonic Cycle which is 19 years made up of 11 year and 8 year sub cycles. These are points where the sun, moon, and earth are aligned in the same pattern in the sky.
Metonic Cycle
Maybe it is this cycle that completes one cycle or subcycle of the vortex motion of the solar system as it travels through space.
Vortex helical model:
Thanks peterslane1 – I find it easy to accept that these re-alignments of the sky would create a very important cycle.
Going back 19 years, 1995 marked the sudden beginning of the hyper-speculative modern-age markets: http://www.chartsrus.com/charts.php?image=http://www.sharelynx.com/chartsfixed/USDJCOMP.gif
If its going to reset now, will markets revert to their older, more sedate state; or will the current monetary hyper-inflation cause prices to go even more ballistic?!
Add the Tetrad, the Lunar Standstill and the persistent solar maximum – we’ll have the priviledge of living through changes, the likes of which we’ve never witnessed before..!
As an aside, a lot of banks are still technically insolvent – check out the spread between base and mortgage rates. That’s why I think that low interest rates and QE will continue for many months yet and I therefore think that we will not have large declines in the indices yet. We will probably see some 10-20% corrections along the way this year but I doubt we will see anything big because the banking system cannot handle this when a good proportion of their capital ratios consists of their own stock.
Another facet of wealth transfer where institutions and corporations can borrow at record low rates whilst taxpayers are not able to – at least not to anywhere the same degree. ..
All imho of course.
J
market may be top, sell apple stock.