
1. Biotech followed through on Friday’s high volume down day with a second one yesterday:

Source: Stockcharts
2. Greed and Fear Index has rallied up to extreme greed territory:
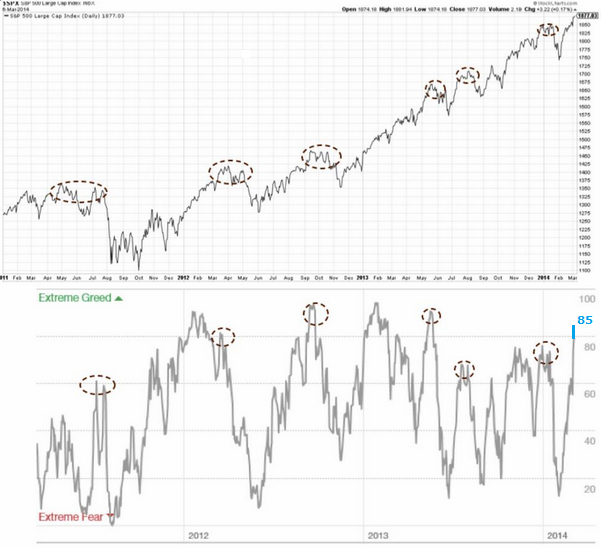 Source: UKarlewitz
3. High yield corporate bonds to 20+ year treasuries shows a divergence with the stock market that has previously marked tops:
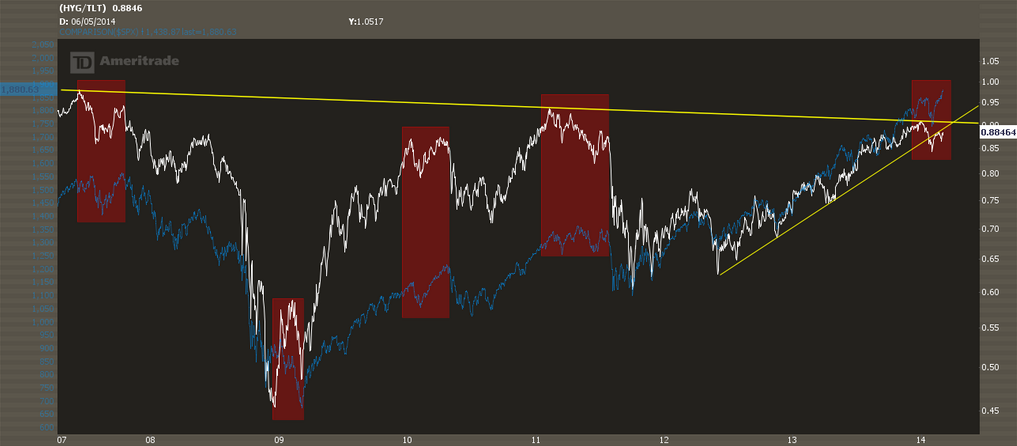 Source: Inflated Temper
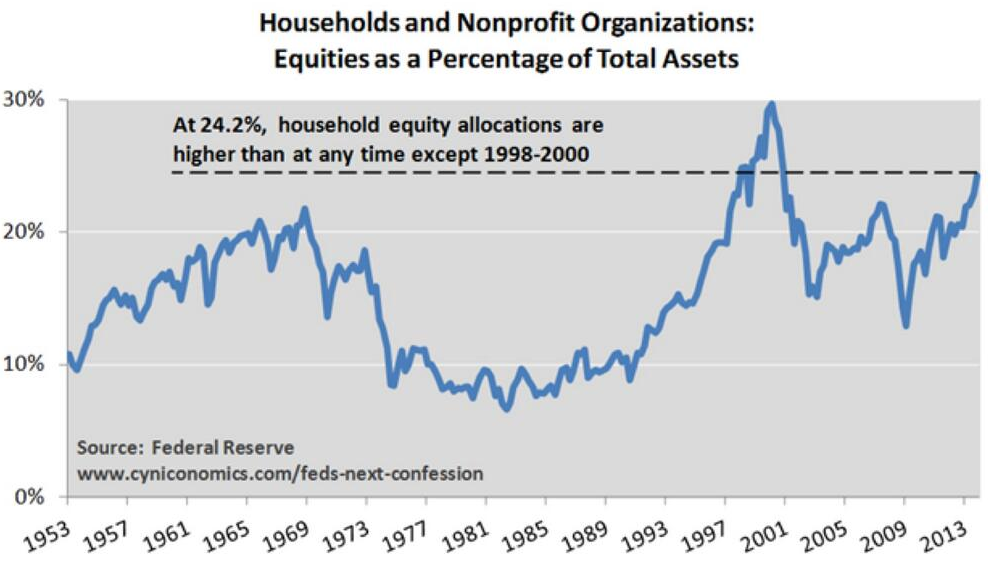
4. Household and non-profit organisations allocations to equities:
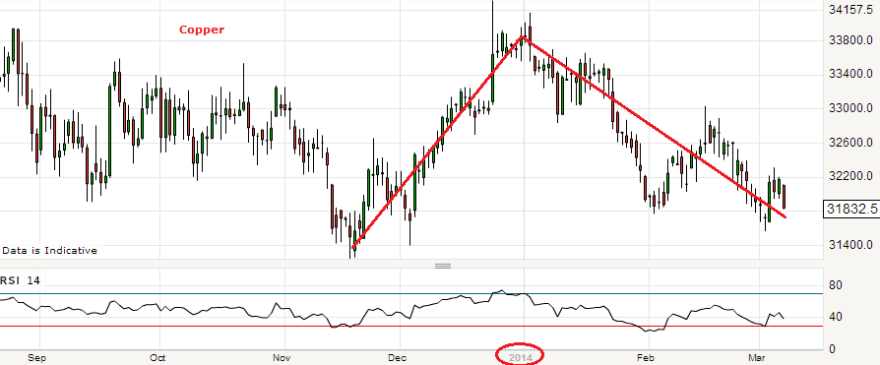
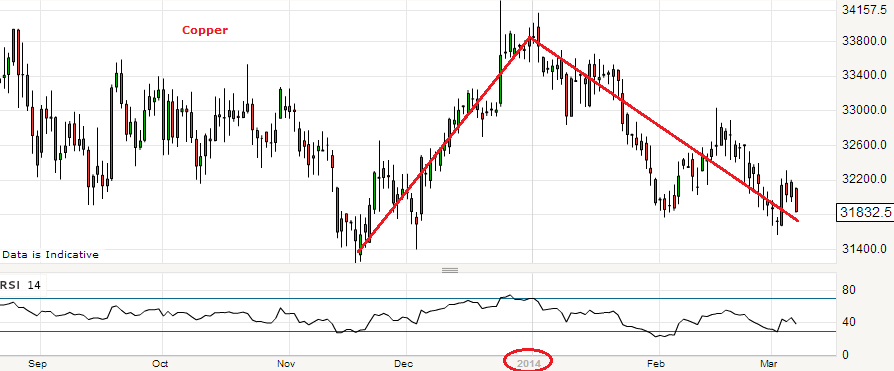
5. Dr.Copper does not think much of the global economy in 2014:
 6. Natural Gas inventories are some way below their historic normal range and I expect this commodity can make a renewed bid for $5:
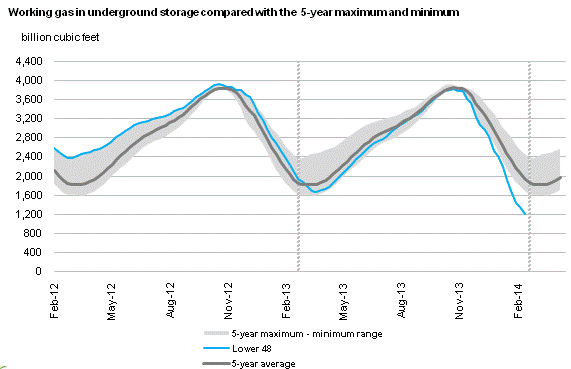 Source: EIA

Hope you don’t mind, John, but here is a great article below by Jeff at greedometer.com. In 30 years of trading I have rarely seen charts showing such extreme readings, and never so many such charts at the same moment in time.
https://www.greedometer.com/precision-vs-accuracy-greedometers/
Thanks Simon
thanks for sharing the link Simon.
thanks for sharing
personally i believe a deeper pullback is due but extreme can be more extreme…
anyway, thank a lot.
John
Slightly off topic but do you have a viewpoint on UK house prices?
Duncan
I expect a deflationary recession, so I expect house prices to decline again.
In trading any forecast, it is still important to enter on your own set of tools that you know from years of use. Even to this day it is still my greatest weakness to take a sub optimal trade entry based on a totally convincing forecast, i.e. putting the forecast ahead of the tools.EVERY forecaster I have ever read has been wrong BIG TIME at least a few times…My own forecasts have been wrong BIG TIME a few times…
Demographic analysis done by H.S. Dent (harrydent.com) fully supports John’s work. One can deny all kind of technical and fundamental signals, but no one can dismiss demographics. Crash maybe down the road, but its sure to happen this year.
A Friday gap up reversal would fit the bill nicely thankyou!
John, ref your inquiry as to why failing a/d line might not be a leading indicator. Finally found it at http://www.Classen Research.com. Basically, this is a liquidity driven market and when the faucet is turned off, that is it. He equates this with that is what has been the situation in Japan since 1990. It also implies more inverted V type tops. However, the US 2000 and 2007 tops seemed prolonged not inverted V. Right now, if we are even right about this being a major top it is acting a lot like Sep 2007. After 5 years of a bull market, even the 2nd chance/last chance rally seems scary to bears and a longer term broadening top, an interminable lashing.
Very good, thanks Kent
From the curve shape we are at the bottom for unemployment. Jobs are gone forever to aging demographics, automation, outsourcing, etc. So if this is the peak of our economy, with all the government spending to prop it up, it looks pretty bad.
Great work John… interesting comment on liquidity Kent. I’ve been thinking aside from QE and suppressed interest rates, corporations and individuals continue to hoard cash. Recently a large cache of gold was discovered by a couple behind their home buried in the ground underneath a tree. speculation puts the date at the turn of the 20th century near about the “Rich Man’s Panic”. It seems a bit ironic doesn’t it? Investors, holding the smart money, seem to be hoarding cash more than gold. If gold has de-linked from it’s supposed relationship with inflation (difficult to say in a deflationary environment), and instead gold has become simply a barometer of fear, then it makes sense to me that something else would be hoarded in response to economic tumult. Cash! But what happens next? That will be the key to whether or not the drop finds a floor quickly to resume a secular bull, or reignites the secular bear… http://www.thewire.com/business/2014/01/companies-hoard-cash-trillion/357254/ what economic allure will attract capital investment?
This chart is currently the “bears” best friend:
http://stockcharts.com/h-sc/ui?s=TVIX&p=D&b=5&g=0&id=p34067104703
Agreed, Allan. The gap left by that island reversal will be filled, and soon.
Until the game of rotation ends, money will/is flowing into stocks. Today the Nasdaq stocks get hit and money then flows into big caps–Dow & SPX. When the declines begin to encompass ALL the indexes—-the decline will begin
VIX Sell signal 15:53 GMT Mar 7 2014
http://screencast.com/t/8Fam7ttzV3vp
Not to keep harping on this but the dow is completing its multi year broadening top formation near 16500, todays high would qualify as a lower high and given the leverage in this market a sharp sell off beckons for sure.
Thanks all
I have two technicians I have some faith in. One has the top right here at 1884, the other sees a fifth wave extension to 1900+/-. Anyway you look at it the end is near.
To me it looks like just another day for not fighting with the FED. They do tend to work hard with the “money”. Good job the markets are not being left totally to the hedgies, what? That would be a real horror movie.
John
Check out the action in copper on friday……..HHHMMMMMM
Yes, been watching coper for some time now as I have Aussie gold stocks as well. Both are great leading indicators for not exactly the same, but also at times of particular market action, not dissimilar reasons.
The Aussie gold sector is continuing to underperform the metals and is signalling a new decline, perhaps to new lows for both precious metals, whilst copper is signalling that all is not quite right economically.
Joining all the dots ie, diverging Aussie gold sector, copper, market internals, the obvious poping of the Biotech bubble this week, VIX instruments TVIX et’al showing strength and as John has tirelessly and so generously pointed out, the absurd extremes of margin debt, sentiment etc, combined with historical evidence of solar cycle influences upon the market.
I think it is safe to say……LOOKOUT BELOW!
John,
Do you expect a Recession in Australia or worse, a Depression? or do you see growth in the immediate future?
Thanks
Mat
I expect global recession later this year
Thanks John, great work mate, great work
Hi John
My T-projection for SPX had a topping interval around March 1-10
I had a topping setup for Norway, and so far the closing high was on Tuesday March 4.
For SPX I have again a setup for a momtnum top (New year) and a marginally higher price top about 2 months later, which is now.
My 4 month solar tide cycle is topping here.
The 6 month solar wind cycle is also topping around March – a left-translated SPX-cycle should trend down from here and to ~June, while a bullish right translated wave/cycle could go on up into April-May.
My conclusion is to look for a downtrend from March to ~June. But we still may go sideways for some weeks to establish a shoulder in SPX (while many markets still havent made a higher high in March and could be leading down)
A bit off topic but relevant – Kissinger on the Ukraine situation:
http://www.washingtonpost.com/opinions/henry-kissinger-to-settle-the-ukraine-crisis-start-at-the-end/2014/03/05/46dad868-a496-11e3-8466-d34c451760b9_story.html
the baltic dry index despite its recent rally is about 1/8 th of its value it hit in 2008, this along with the near 40% fall in gold since its top near 1950 are strong arguments for an upcoming deflationary spiral
China. In 2005-7, the US housing market was collapsing and few knew about and those who did were ignored. Is that happening in China now?