

So far in 2014, the SP500 has made a correction similar to those of 2013, and a larger correction remains historically overdue:
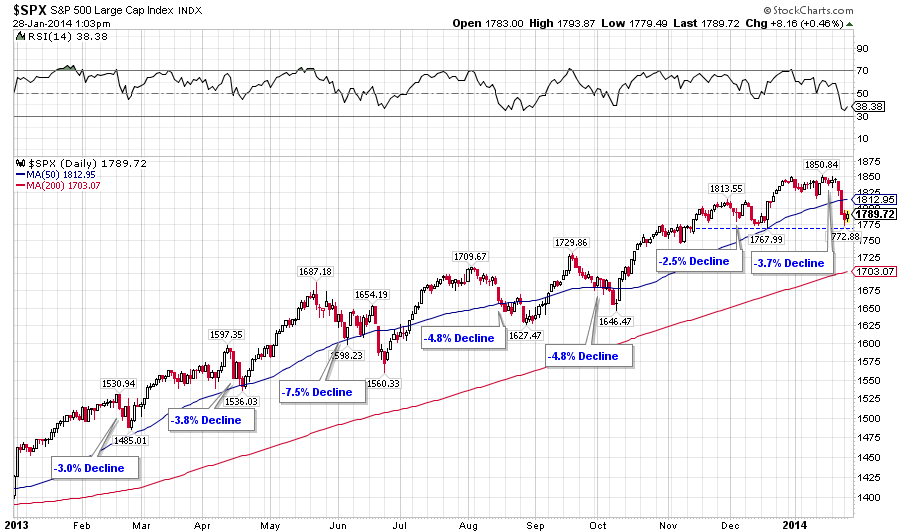 Source: Charlie Bilello
Yesterday’s bullish candle also came at a key support level, shown dotted above.
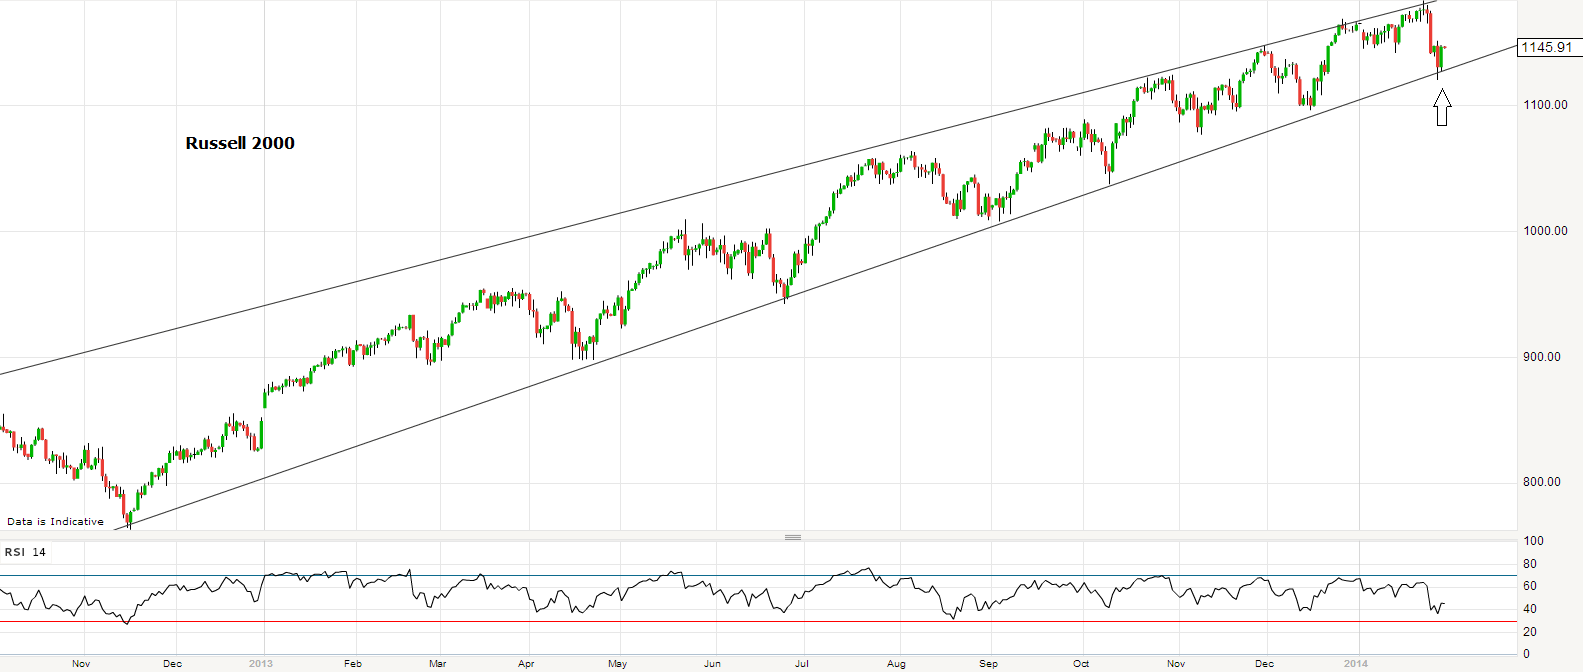
The bull save came at an important point on the Russell 2000 also, at channel support:
Both teasingly keep bull and bear cases in tact.
Tomorrow is the new moon and we are still in a seasonal low period for geomagnetism. Barring any adverse reaction to today’s FOMC output or economic/earnings data, the next few days would ordinarily be bullish on that moon/geomagnetism combination, before we roll over on both:

However, the potential for a market crash remains present with the extremes reached in sentiment, leverage, Skew and positioning, echoing May 2010 and 1987.
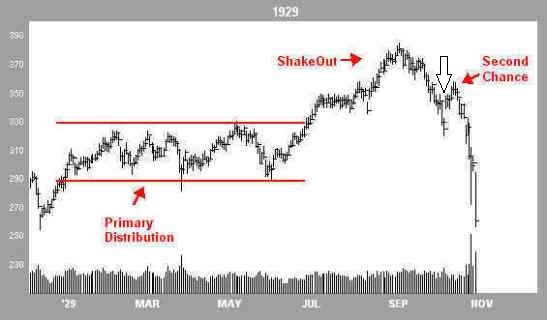
The Dow looks like this, and I have marked the potential position on the analog, given that we have pulled back to the top of the primary distribution range:

A little more retracing of the falls over the next few days would fit, creating a head and shoulders pattern and teeing up declines in February.
Why not head to new highs on all indices? Firstly, I had a multi-angled case for a market top 31 December 2013, which is so far being honoured on Dow and Nikkei (and Sp500 double top). Secondly, this is a parabolic top rather than a topping range, and we see typically see similar lower-high second-chance patterns on parabolic bubble charts, as opposed to marginal higher highs on divergences in topping ranges. Thirdly, there is a change in backdrop here in January: economic data has started to disappoint in line with leading indicators having predicted an economic peak between November-February and we have seen money flows into treasuries and defensive sectors away from cyclicals. Fourthly, the correction in equities over the past week has further to go, by multiple indicators.
The put/call ratio still signals complacency:
 Source: Stockcharts
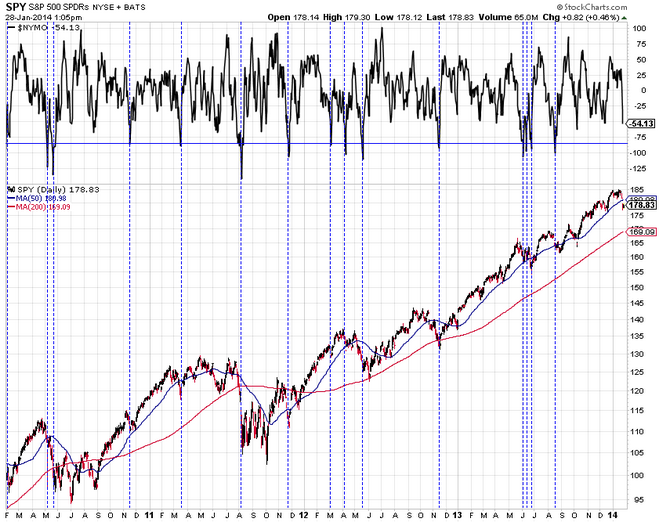
Nymo suggests more downside is required to complete a wash-out:
 Source: Charlie Bilello
Friday was a 90% down major distribution day, and typically from a new high they normally come in clusters of more than one. Yesterday’s volume was unimpressive which also hints at more downside ahead. Skew remains elevated and divergence in breadth has increased. Sentiment measures are still lopsided.
December margin debt data is in, hitting a new record and an even steeper spike:
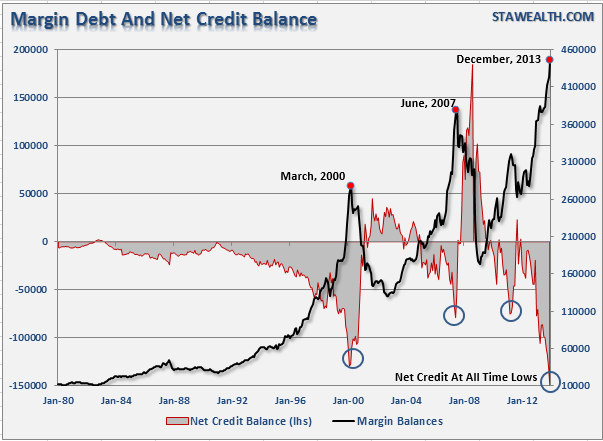
Source: STA Wealth
It has now reached 2.6% of GDP, similar to peaks in 2000 and 2007. With January’s price action in the stock markets, I expect that may turn out to be the peak in leverage. If margin debt, stock indices and the solar maximum peaked out at the end of December it will echo March 2000 where all peaked out together.
It remains too early to judge whether commodities are going to rally as a class as late cyclicals. Precious metals continue to base but are as yet without momentum. I believe that will come once equities more clearly enter a downtrend. Energy has been firmer, in part linked to the US cold spell, but whether oil and gas can rally if stocks more sharply decline remains to be seen. The risk-off days that we have seen have typically been pro-yen and anti-dollar, which could mean we see the support for commodities of a declining US dollar, should those equity declines erupt again. Soft commodities have yet to advance in a meaningful way, but scientists believe El Nino is forming and historically this has been positive for agri prices through the supply effects of increased droughts and floods. El Nino years have produced some of the hottest years on record. Global temperature variation has a correlation with solar cycling once the global warming trend is removed, so the combination of the solar maximum and El Nino would give potential for a new hottest year on record, but we will see how things develop.
China’s repo rate remains elevated heading into their week-long holiday. The markets welcomed Turkey’s large rate hike, but emerging market issues continue to simmer. US earnings reports this season have so far had a similar theme to previous quarters: poor revenues or weak sales guidance, profits through cost cutting, and share buybacks. The blended earnings growth rate for Q4 is 6.4% so far, but the blended revenue growth rate is just 0.7%.
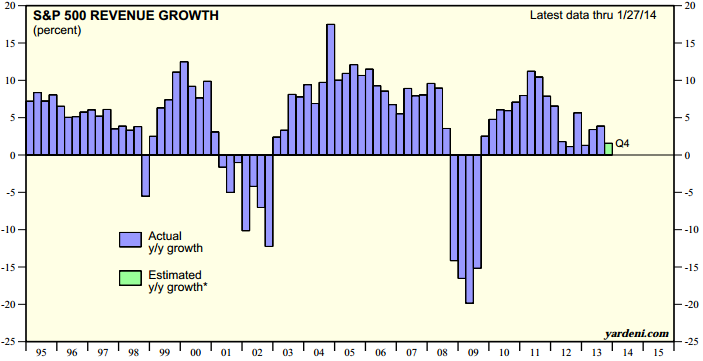 Source: Yardeni
Barring some stellar revenue reports in the remainder of the earnings season, this is another impediment to further price gains in US equities.

Top 10 biggest percentage loss days in the Dow’s history:
19oct1987 3 days before new moon
26oct1987 4 days after new moon
28&29oct1929 3&4 days before new moon
6nov1929 5 days after new moon
12aug1932 4 days before full moon
14mar1907 on new moon
15oct2008 1 day after full moon
18dec1899 1 day after full moon
21jul1933 1 day before new moon
New moon not such a positive in this regard.
Hi John
As I said in my last post we are undoubtedly entering a period in the Pres cycle and Obamas Pres cycle that would normally be a weak patch, which would normally last the second and third quarters. This coupled with the red flags that you, as usual, have pointed out so lucidly mean that it is indeed right to be short.
You often need the first move to change the tempo and widen the boll bands. Then you get the rally and then the “flash” is in the context of rising volatility.
Overlaying a number of these timeframes it prob looks more likely that you will see weakness until 15th/25 Feb then strength into mid March,even into April, and then the price distribution has broadened enough for a flash move to happen.
I’d be interested to know whether the capitulation signal hit 10 in the first dip in Feb 2010?
Will
Thanks Will. Check Quantifiable Edge’s posts archive for 2010 for the CBI.
No interest in posting against what John posts.Because he allows here for a retrace,will link…. see 1/27 at mypivots.com.
Thanks John
I didn’t realise that they had a archive.
That margin debt and net credit balance chart shows just how probable a crash is. That is a spectacular chart. Final analysis, I agree with this long odds call. More bearish stuff. George Lindsay’s methods of time intervals, 3 peaks and a domed house, and measured move from the middle section all coalesced on Dec 31st. Lindsay was one of 5 all time great market forecasters. Ed Carlson has taken up the banner and can be found at safehaven.com
5 major crashes started with a top on the new moon followed by a decline to the next new moon. That is what we has done so far this year. The pattern would call for a 2 week rally to the full moon that leads to a crash low on the next full moon (eclipse). They were 1929, 1987, 1980 gold, 97 SE Asia, and 2000 Tech Crash. (from Peutz). The next full moon is Feb 14th, and then Mar 16th for final low. The lunar eclipse is Apr 15th and solar eclipse is Apr 29th. That doesn’t fit the pattern very well except it is eerily similar to the 2000 crash.
Thanks Kent
Hi Kent.
For what its worth there are some other timing guys that specialize in Fib. and Geometry time work that are calling for a major, major date on Mar. 14th or Mar. 17th. Ermanometry is one (ermanometry.com).
Thanks, Tophersabella.
Hi
Could you share the link to these guys? I could not find anything about this on ermanometry.com, it seems like they haven’t updated the site for some time. I am assuming some big investment firms put William Erman on their payroll and he is not putting out work for free anymore.
John,
Just another note to say thanks for sharing your exceptional research. I especially liked the “Timing Major Market Peaks” post last week and the ‘new moon’ comment above. Never miss an issue . .
As an investor and not a trader I have sold most positions with gains but am holding GE, PCG and two commodity stocks with gains. Each have sell targets if the market cooperates and I am prepared to hold them through a deep dark winter if required. Simplistic as it is, my strategy is to only sell when I have a gain (I have not always succeeded). I value all positions in US$ and in AU (date in/date out) and look to achieve a minimum 10% annualized gain in each medium.
I have nothing to add to the technical research you and commenters post here but my belief is that the radical turn has not yet come. A trend correction yes but I believe the real top is some months away. That said, as noted above, most of my skin is out of the game. I do believe there will eventually be a PM parabolic but not until ~2018-2025. Again, nothing to back it up, just my thoughts from reading and observation.
Good profits to you in 2014.
geopark
Thanks geopark
30th Jan and 4th Feb should prove to be important dates. http://algorithmicswingtrader.wordpress.com/
We should see a bounce into the weekend then back down into 4th Feb
Hi John,
Do you see the large amount of computer/quant trading (which is presumably not affected by geo, solar or moon phases etc.) altering market reactions cf: 1929, 1987, etc.? Are there still enough fleshy fingers on buttons?!
About the 2007-09 period all the literature about the day to day reaction of the big quant traders revealed that at first they let their programs run thinking the market would revert and when it did not and the losses piled up the fleshy fingers began hitting the buttons.
Slater knows better than I
My neighbor across the street used to be a Spx 500 pit trader in Chicago before computers dominated. The goal of the pit was to take the money that flowed into the pit from outside accounts and not to take money from each other.. If a trader was allowed to blow up, it meant there was one less player to keep the game going to the point that if a trader got stuck in a bad trade the other traders would help him bail. Similarly, the algo game a certain critical mass to keep going.In the last blow up, the heads of the algo firms were getting on the phone and calling each other trying to find out who was selling so relentlessly that they were causing the algo’s to not work.
John,
In reference to your Stock Market Guide for 2014 chart, it appears that the market will drop then rise into the 2nd/3rd quarter then dive again to a low around Oct before it rises into 2015.
1. Do you consider the 2nd/3rd quarter rise as the “Second Chance” bounce?
2. If so, do you think the market will then keep going down for the next decade or so after the “Second Chance” bounce?
However, another scenario which may happen is the following:
1. The chart has the market rising from Oct 2014 into 2015. Since 1895, the average return for a year ending in 5 has been around 29%.
2. Next comes the secular bull market 17 year cycle. Since the secular bull market of the 80s & 90s peaked in 2000, the end would be around 2017. Which means that a new secular bull would start soon after the anticipated big gains in 2015.
Which scenario will happen?
Jack
Hi Jack, it’s a guide based on the historic seasonality of geomagnetism and lunar phase oscillation, and doesn’t change much from year to year. Hence there is a seasonality to stock market performance and we can differentiate clear lunar returns over the longer term. But in any one month or in any one year, we can have an atypical stock market performance, so understand it is a guide rather than a hard prediction. To that end, I track actual geomagnetism on my other models, and we can see there where it differs greatly from the seasonal model. In addition, there are a cluster of major historic market tops around the turn of the year at the seasonal max and around new moons. There are a cluster of market crashes around the seasonal lows, and the heaviest historic fall days have typically been close to new or full moons and often on Mondays. That adds to the guide.
If we are to get that second chance bounce then it should come now into February. I’m not a subscriber to either the decadal or 17 year cycle.
John,
Thanks for the reply.
As I understand it, the second chance bounce that will occur from now into February should not be as high as the December 2013 market highs according to historical precedent.
Also, according to historical precedent, after the second chance bounce, there may be a waterfall decline with occasional pops that occur within an overall declining market.
Let’s wait and see how 2014 plays out. I am cautiously optimistic for the secular bull case, but I am a born optimist.
Jack
Post FOMC and at the time of writing (European markets opening) both options remain in play: either stock markets rally for a few days from here (second chance rally per the analogs) or stock markets fall hard (flash crash backdrop mirror). SP500 weekly looks like this:
http://wp.me/a2cZun-1DK
Triple support to argue for the rally, but equally a break beneath would likely trigger the sharp falls. Today’s new moon adds to the balance, as typically bullish but a cluster of the heaviest historic fall days have occurred close to the new moon.
http://www.bloomberg.com/news/2011-09-22/why-identifying-a-bubble-is-so-much-trouble-john-h-cochrane.html
As always… great work… regardless of the direction we head and the depth or height of the move. I have to say it’s taken a lot of discipline to stay the course and not simply go to cash… white knuckles even… should the bottom fall out I’ll need a support group to work out my denial issues.
Thought you might like the piece Cochrane wrote a few years back… Hope we have that froth that’s been missing… and I’d personally appreciate a bit more consolidation to get a firmer bounce.
Best,
HVA
Thanks – what do you consider to be missing, froth-wise?
We´re on the rigth track
@apanalis
Just reporting….the same setup that took GLD to a new low triggered in SLV on 1/14/14… IF SLV hits new low, setup will have done its job. This is of interest to me here because based on the previous TLT chart shown, at yesterday’s high to the penny.the same setup is now in place allowing for a marginal new low in bonds.However, no trade signal was generated so as it stands now it is a waiting game.
1115 WATCHING GLD and SLV…… i think that in this case waiting for the new low may be a hook…. have covered…. think good chance that something dynamic could happen
If we are to get a big move downwards the initial decline should be in the 10% area within the first 25 days. So far the downmove has been to shallow. The rebound should then complete within 41 days from the peak. If we look at the Dec 31 as the top we need a rather big move down by Wednesday.
If we don’t get the move I am afraid we are looking at no more than a normal correction in a bull market of a max of 20% over months.
Interesting, thanks, but could you expand on what’s behind your calculation
I am talking of corrections from all time highs specifically.
I know you don’t really give much weight to planetary movements, but in addition to a new moon tomorrow, the planet Mercury is entering the constellation pisces. I looked back on the SPX from 1995 and found that price increased strongly upward over 80% of the time. It also marked the bottom of the 2007-09 bear market. For this reason I’m expecting a very strong upward move on Friday, as Mercury enters pisces at 8:30am EST, precisely at the opening bell. Will be looking to establish short positions @ end of day.
OK, thanks
Friday update:
A bullish day yesterday negated by overnight weakness, adding to the mixed recent action. Indicators are mixed too, but I can summarise that they generally allow for more upside but on the way to a lower low, i.e. downside not done. Time of writing is European markets early and still too tentative to call.
My case for a Dec 31 top, along with the validity of the topping parallels of this post, stand until disproven.
https://solarcycles.net/2013/12/27/us-stock-market-top/
Dow 1929, Dow 1987, Nikkei 1989. From the topping candle to the peak of the ‘second chance’ lower high (the ideal time and place to short), the trading day count is 28 days, 28 days and 30 days respectively. Today is the 21st trading day after Dec 31. Clearly we should not expect an exact copy of any of them, but my reasoning is that they are similar in patterns of price and time due to similar waves of crowd psychology playing out against similar backdrops of extremes in valuation, sentiment, leverage and technical indicators, so we therefore have a case for expecting ‘similar’, and so far that’s what we see. In short, we are moving towards that point, but there would also be room for further upward price movement next week before the falls. Either way, we are edging towards a point of proving or disproving.
Today’s price action could make a significant difference to both the weekly and monthly candles on the indices, if more decisively bullish or bearish.
Did you see the US is the second most expensive in the world by CAPE?

Yesterday OEX-put/call volume didn’t express a bearish necessity of „smart money“ for hedges. That made me think, there will still come some updays like 1929 at this juncture. Meanwhile DAX and US-Futures broke their support. Maybe this is just part of the confusing violent struggle between bulls and bears and not telling much. But I’m expecting an immediate crash, should the indices fail to recover on an usually bullish Friday.
John, thank you for all of your work! I am regular visitor here.
Did you count:
1. How many trading days it took the crash to finish for all Dow 1929, Dow 1987 and Nikkei 1989?
2. How big were the retracements of the initial move up? Any fibonacci relationship between initial wave down (about to finish any time soon) and crash leg down? I ask for the case if there is any wave to find out how deep the correction may be if the crash will occur.
Thx!
Yesterday OEX put/call-volume didn’t express a bearish necessity of „smart money“ for hedges. That made me think, there will still come some updays like 1929 at this juncture. Meanwhile DAX and US-Futures broke their support. Maybe this is just part of the confusing violent struggle between bulls and bears and not telling much. But I’m expecting an immediate crash, should the indices fail to recover on an usually bullish Friday.
Thanks
As a technical trader I am asked what is my most important tool.For me it is an ABC retrace that completes at .382. I have thousands of archived examples of this. 85% of the time price will take out the bottom of pattern.At yesterday’s high, the TNA completed an ABC retrace to the .382 to the penny.
No one was more surprised than me when my my whole list of rebuy levels lit up on my screen simultaneously this morning…. i covered my shorts; but, had one of those moments where it is hard to act…
John, no calculations involved just observations. Compare 66 Dow top to 73 Dow top
66 was 24 days to initial low @9.5 %
73 was 20 days to initial low @10.5%
very similar but the bounce in 66 topped out 51 days after the high and 73 was 23 days after the high.
the drops were 26% for 66 and 46% for 73.
The time it takes to get to the lower high is a real key. Dow 1929, Dow 1987, Nikkei 1989 that you mentioned above had initial drops of 12%, 9% and 6.6%.
Nikkei had the shallowest drop so that is my line in the sand % wise and 66 puts my line in the sand at 25days for the initial low.
Added some shorts today in hopes of a big move today and Monday.
Thanks for your blog by the way. You’ve done a great job. Very generous.
Move up should begin next week
http://algorithmicswingtrader.wordpress.com/
My tools give me a perspective I would like to share At the recent highs, indexes and hundreds of stock reached their long term targets..At the recent lows, the index etfs reached or missed by pennies their short term downside targets given by the tools.If price breaks sharply here that would be acceptable because the next set of targets are sharply lower.What would be lacking in my work would be a target given by a downsloping line vs the current upsloping line target.If price turn up here and moves to a new high once again kissing the line that turned it down, I would then be able to draw a target line with the INDU at least 3000pts lower.Neither scenario negates John’s work.The move to new highs would simply allow me to trade for much larger targets than my tools gave off the initial high.
The next shoe to drop may be Chinese Government announcing after the lunar holidays how its debt problem will be handled and who (private institutions and the local governments) will take the plunge.
Since the Government has already “covertly” put investors on notice that 1) the future will be driven by market forces; and 2)deposit insurance are in place….the stage is set to allow shadow banking products to default/bankrupt. Bail out can not be expected, except for the biggest banks..
Hi John,
Many thanks for your analysis, it has been very interesting and helpful. I wonder with the price action on 3 feb, whether you are still looking for a head and shoulder formation; a rebound before a bigger fall?
Thanks. New post coming up today, was out all day yesterday.