

Economic growth occurs two ways: increasing population and increasing productivity per capita (which can be achieved through technological evolution and improvements in organistation/management/systems). Both increase overall GDP.
World population has grown exponentially over the last 2000 years:

Source: Sub-dude
As has GDP per capita:
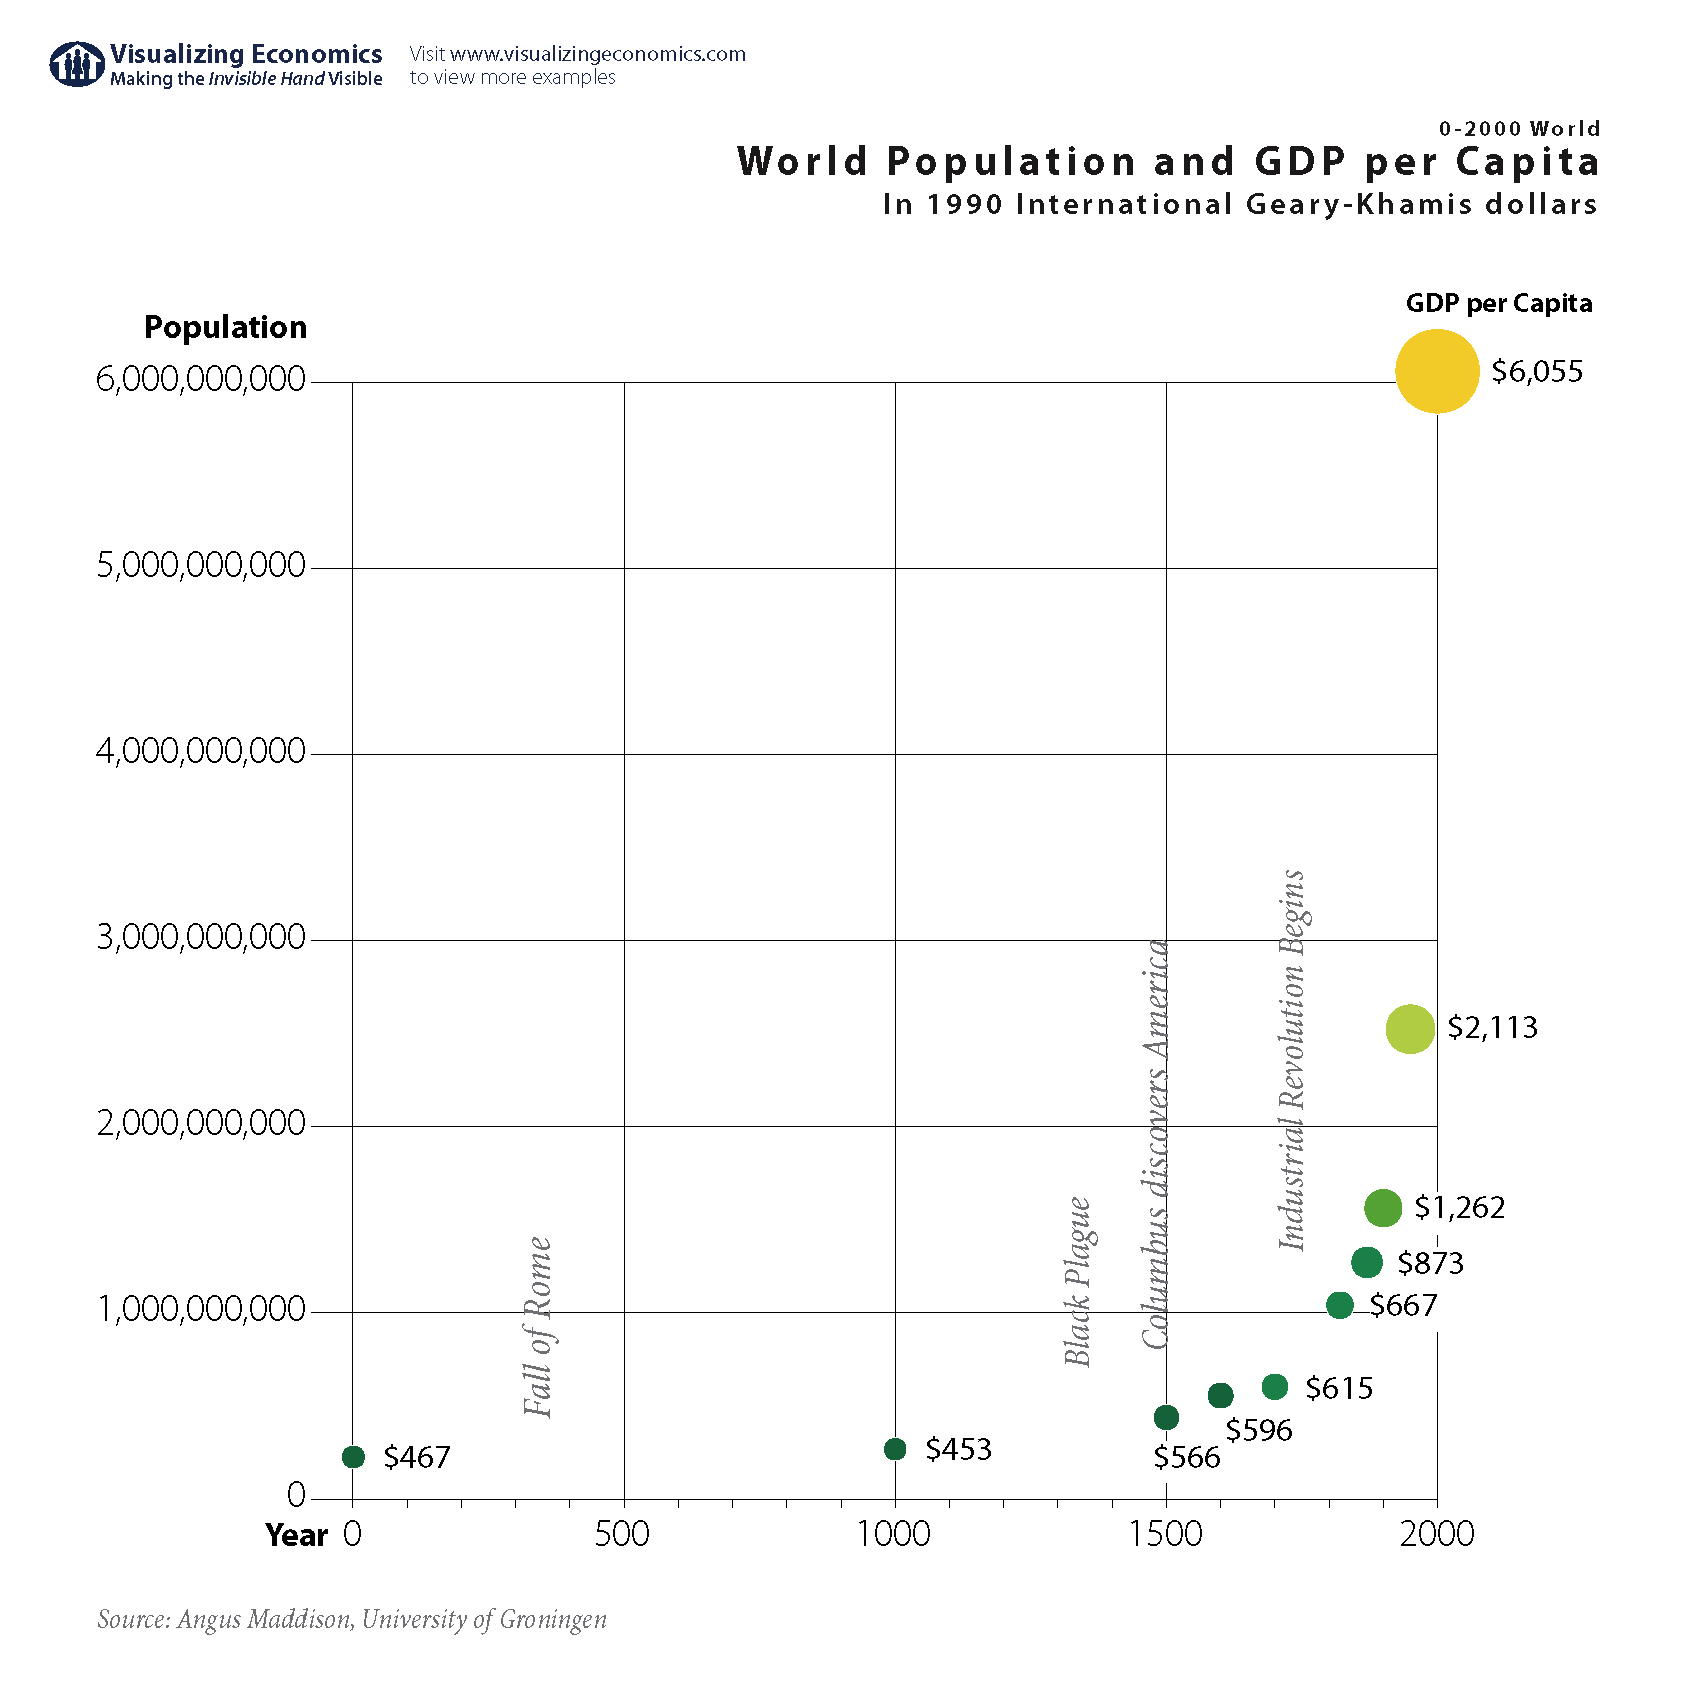
Source: filipspagnoli
A principle of the globally adopted capitalist economic model is that compound growth enables long term poverty reduction: that people can pursue their own self-interests and help themselves to disproportionate shares of the pie as long as the whole pie grows so that more people find themselves better off than less. Hence countries typically target 2%-10% annual growth, which when compounded means exponential growth. To achieve exponential economic growth we need either exponential population growth or exponential per capita growth (ideally both). The latter reflects human progress and technological evolution whereas the former is more of a ponzi scheme, requiring ever increasing numbers of people to maintain an ‘illusion’ of increasing prosperity.
Something changed around the 1970s. The growth rate in world population went into decline:
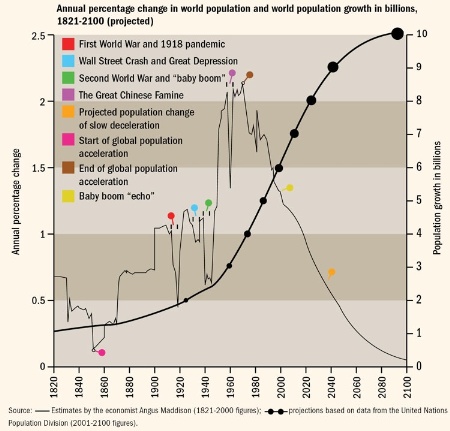
Source: TimesHigherEducation
World GDP growth and GDP per capita growth also trended to a peak.
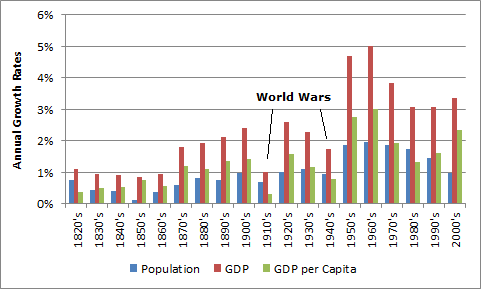
Source: DoctorCopper
The pick up in GDP and per capita GDP in the 2000s is now rolling over again, suggesting the secular trend remains down:
 Source: TheNextRecession
 Source: TheNextRecession
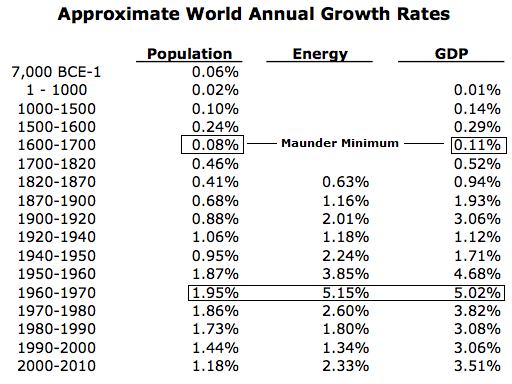
The peak in population, GDP and GDP per capita growth rates fits with the peak in solar variation: the grand solar maximum:
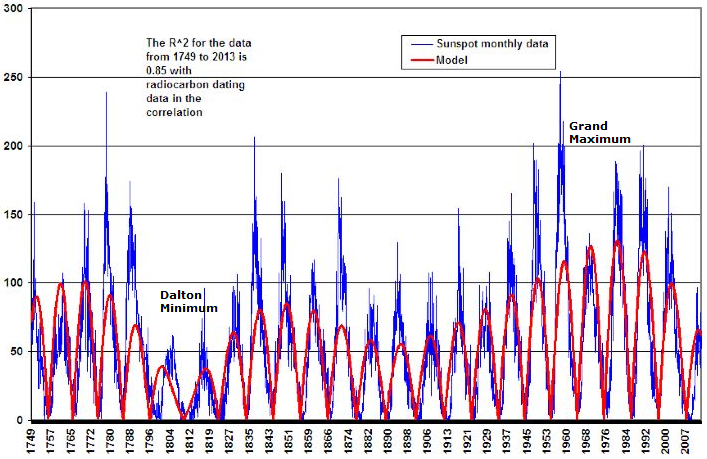 Source: WattsUpWithThat
The trend in long term solar variation suggests we are now headed for another minimum, like the Dalton or Maunder. These historic minima corresponded to lower GDP growth and lower population growth, cementing the relationships between the three.
Inflation also peaked around the 1970s:
 Source: Yardeni
As did growth in energy supply.
 Source: Financial Press
Declining rates of growth in population, GDP, GDP per capita, inflation and energy supply spell major trouble for a global system reliant on exponential economic growth as well as inflation and employment targetting. However, the true impact of this has been postponed in two ways.
Firstly, the ‘gap’ has been filled by increasing debt:

Source: isj.org.uk
However, we have reached the point of debt monetisation in US, UK and Japan, i.e. the end game. The question is how long the end game can last.
Secondly, sub-demographic trends of the major economic nations have largely been supportive since the 1970s, peaking out in phases.
Here is US population growth per decade. Forward it by 40 years so that the births become the important ‘middle’ age bracket and we get the secular trends in real US stock prices: down into 1980, up into 2000, then down projected out to 2030.

Source: Business Insider
Here is Japan’s 5-yearly population growth rate. Again, forward it 40 years and we have a big spike in the middle bracket to deliver a major peak in equities and real estate around 1990, a small relief uptrend in the current window 2010-2015 (as we have been seeing) and otherwise a fairly grim outlook.
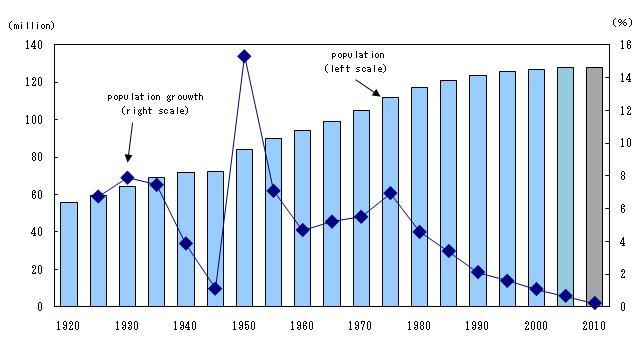
Source: Stat.go.jp
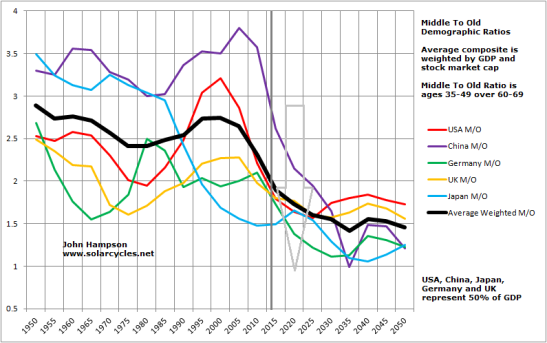
Collective dependency ratios, middle-to-old ratios and net investor ratios in the major nations were largely positive until recently, with China the last to break down:


In summary, we have postponed the impacts of the major growth rate peaks (GDP/GDP per capita/population) of the 1970s through debt until we have reached the point of monetisation, and the support from demographic sub-trends of the major nations has now expired. Solar maxima have historically given way to recession, and solar variation predicts a new grand minimum ahead which has historically correlated with low GDP and population growth. I am therefore led to the fairly bleak conclusion that this solar maximum speculative peak will turn out to be a major historic peak for the world.

Hi John, I’m just writing these lines to thank you your generosity for sharing your knowledge with us. This is one of the best websites I have in my “favourites”, if not the best.
About geomagnetism, John, where I can found data in order to study it? How do you construct your geomagnetism charts?
Thanks Jordi
NOAA provides the data
Last 4 weeks http://www.swpc.noaa.gov/ftpdir/latest/DGD.txt
3 week forecast
http://www.swpc.noaa.gov/ftpdir/weekly/27DO.txt
The rest I do myself on excel
Hi John. Your kindness in sharing your research (and reasoned opinion) has been appreciated as I have visited this site for quite some time now. Wishing You great success in your investments. God Bless
This morning at mypivots.com I loaded a set of long term charts
that supports John’s work.On the home page on the right side you will
find a list of recent posts.. hit LONG TERM.
Thanks
based on the same set of tools, TLT has reached initial upside target 342 pm.
slater, do you have this TLT chart on your website? tia.
great charts slater….
Hi, again, John, your current thesis is that a low below 2009 min in US indices will be seen? Thanks
Correct, but I don’t know whether we get there in one cyclical bear or more than one (i.e. with cyclical bull inbetween)
John, your evidence based study concludes “I am therefore led to the fairly bleak conclusion that this solar maximum speculative peak will turn out to be a major historic peak for the world.”
While I am sure you will adjust your trades based on future evidence, for now, How much suffering (in term of % market decline) would you guess? and over how long of a period?
You are truly turning into a master.
Thanks. I refer you to this chart, but the cyclical bulls and bears within it are just a guess. Maybe we head down there in one devastating bear, maybe several legs. That will become clearer with time.

You have turned on my light bulb by your recognition that debt is used to fill the gap of declining growth:-))
John great post especially typing energy in the 1970’s into this entire future potential macroeconomic purview.
Assuming QE and ZIRP or negative values less then ZIRP or asset confiscation is utilized… My curiousity to have a part 2 to this blog entry is the velocity of money and M2/M3 during the last 100 years. If demographics reveal deflation, it also reveals a slowdown in money velocity. However if more money is printed, the value per central bank note decreases, requiring more (or inflation) for purchasing power which then impacts money velocity. Your point about indices falling to mid 1990’s levels in the future would be based on price action today. Even for those that do not implicitly trace by share price, you have to take this further to what I said above on future profits, investment, and innovation. If a currency note is inflated to fight deflation, profits are going to sound a lot bigger, prices will go up, etc. Demand will drop in some categories like real estate so housing will still be affordable to this generation with some bumps in-between.
I think your answer is going to lie with further analysis of the 1880 – 1930 era in U.S. and Great Britain factory output (tied to solar cycles) and how it relates to population of the time. I’d be curious if 1918 noted any minor deflation. Since currency was different then, the data may not be comparable, but dropping populations and demand could actually force interest rates higher due to less consumption and production. At the same time taxes may go lower, because there is less demand on the government. GDP will be affected by all of this of course.
Less population and less jobs does not mean there will not be enough jobs. I think since 2000 we have been in a deflationary glut that will continue to shed jobs and push people to be unemployed. Eventually those 55 and older holding on jobs will be unable to work and youth unemployment will drop. In the next 20 to 40 years, those 55 and older will be gone and demographics should stabilize for some time.
I still maintain that a new global banking and reserve system will be established as a result of the population change like a reset button. A fix to the old Triffin dillema.
I see the next fake-bull post 2017-2019 (indices go up due to deliberate massive inflation) being a result of fighting the deflation before a sober realization it can’t be a battle won. This may be where we see gold increase in value because its not QE but actual devaluing of the currency. Stock prices wont go up per se, just inflated. Volume will remain low.
I don’t think we’re going to see petrol get cheaper or commodities get cheaper because of demographics. Price inflation may actually ensue to maintain profits as a tax of sorts. Net impact is money velocity.
Thanks. MZM velocity and t-bond yields both peaked out around 1980, I suspect we can tie that in, will look at that in due course.
Such a large number of people to be getting the ongoing kick in the butt, what! Sore butts can make easy war. Does large scale war follow economic cycles or just interfere a little sometimes? Perhaps the much awaited increase of velocity of money will be improved via massive war spending and maybe some Pol Pot type demographic changes can also be made. Its a good job we can rely on the banking system to survive and thrive no matter what, I believe they have a very good track record in the conflict dept. The internet will need to be switched off, of course…
Thanks
Hi John, I have to agree with Jordi and others. Thank you so much for such an insightful articles and sharing this knowledge with all of us. It is by far the best site I came across and is bookmarked in my favorites. Thanks again.
Thanks Mirka
WOW John, magnificent post. I just wanted to make some analogy with what is going on with world population and economics. A good example may be the gold bull market from 2000 to 2011. From 2000 onward, every time gold fell to its 200 day moving average, it was a buy. It got to where everybody was a gold expert correctly calling the next leg up. Then in 2011, something changed. It fell back to its 200 day and just sat there or rallied slightly, before eventually crashing through and starting a bear market. According to Gann’s Master Time Cycle, the 30, 60, and 120 year cycle, 2010-12 are like gold hitting its 200 day moving average and a strong rally should begin. It did in the stock market, but not the economy or commodities. Past cycles would indicate we should start a repeat of the 1950’s.. But we could very well be going in to a paradigm shift and a new transformation is beginning. The end of adolescent parabolic growth and turmoil to growth of maturity. The transition may be difficult as the caterpillar must “die” to become the butterfly. The butterfly being a world civilization.
Thanks Kent
excellent post. What is your estimate of when we come out of the forecasted grand minimum. 2040s?
Scientists don’t know for sure that we are headed into a grand solar minimum, but extrapolating the recent sunspot trend and using mathematical models based on planetary cycles the possible window is 30-100 years.
Hai Jhon, do you think in the short term when it expires decline to rally back before the crash occurred?tq Jhon.Gbu
By history, some relief rally for the bulls would be normal around February, but it should fall short of the highs.
Thanks John.Gbu
Very sharp selloff in global share indices today. It’s apparently been led mostly by a withdrawal in exposure to emerging market equities, and the fact that it dragged developed market equities means if the BRICs lurch downwards even more, the developed countries could experience a period of depressed activity.
http://www.reuters.com/article/2014/01/24/us-markets-global-idUSBRE96S00E20140124
A global market strategist quoted in this article says “It’s just the final realization that they (EMs) can’t continue to grow as an economy the same way they did before”
This all ties back to the excessive commodity reliance of countries like Russia. If Oil is all Russia has to sell, a selloff in Oil will scupper their recovery badly.
Thanks
Weekend update.
The steep declines on Friday were very one-sided – there were no relief rallies for the bulls. Closing at the lows sets up further declines on Monday. Recall the predominance of crash days on Mondays after weekend deliberations, so be aware. I still rather expect a crash to come further out, maybe March time, but the high leverage and other ‘all-in’ signals mean it could happen at any time, particularly if an ‘event’ is at hand. The sharp declines in emerging market currencies and steep rises in emerging market CDSs Thu-Fri, together with the recent cluster of high Skew readings and a steep drop on Friday in inflation expectations suggest a deflationary shock could be about to occur. If so, we could potentially see very rapid and large movements in the financial markets and it would be important to be nimble.
Was wondering the same tonight as i looked at my work… ”What if price simply dropped to the nearest targets across all stocks?”
John, what tools do you use to determine when to cover your shorts?
I am also short and one of my favorite tools is “$NYADV::$NYDEC” to determine the level of extreme bearishness.
There are talented men out there and for you to share your exceptional analysis so generously, that’s rarity!
Your December 31st market top call is looking very plausible now.
Thanks Newt. We can use mutliple pointers – will post on those when we get nearer to such an eventuality.
http://www.bloomberg.com/news/2014-01-23/china-trust-products-gone-awry-evoke-soros-echoes-of-08-crisis.html
Thanks Gary
Thank you John for presenting a calm and detailed technical analysis. Appreciate the lack of emotional trauma on this site. What is, is. It’s a big picture, and somehow comforting to see a long term view, as opposed to the Armageddon scenario. When the baby boomers all retire there should be more than enough jobs. Very interesting to think the world population may shrink all on it’s own (albeit over a long period of time). We certainly live in an interesting time.
Thanks Khiori
Thankyou John as always for you thorough and on-point analysis
I believe the market is close to a significant low within the next 2 days.
http://algorithmicswingtrader.wordpress.com/
Thanks AST
Up we go.
If crowd psychology is about tossing between extreme optimism to pessimism, then the market has plenty of downside potential. Just look at $CPC… hitting multi-year extreme low level when John called the top on Dec. 31st.
Now is the turn for the bears to sit tight?