

Permabears turned bullish, normally reliable analysts ignoring a flood of warning signs, a united view that the US and world economy is returning to solid growth this year which is based on little other than hope, and mass complacency. Just the way it should be at a solar-maximum-inspired speculative finale, and great to see it first hand.
Don’t lose sight. Each of the warning signals that I compiled HERE (to which we can add insider selling, Rydex buying power, RSI divergences, and money flows out of consumer discretionary equities and into gold miners and treasuries) has been a reliable historic indicator of either a correction or bear market. To have them all in congregation is rare indeed, and a trader’s opportunity.
The sentiment extremes persist:
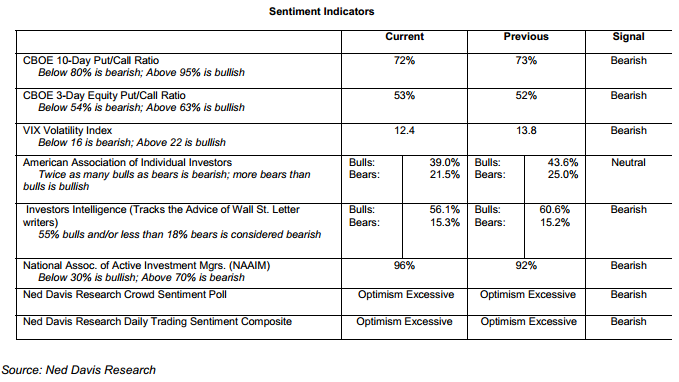 Source: Baird/Bittles
Put/call ratio extremes persist:
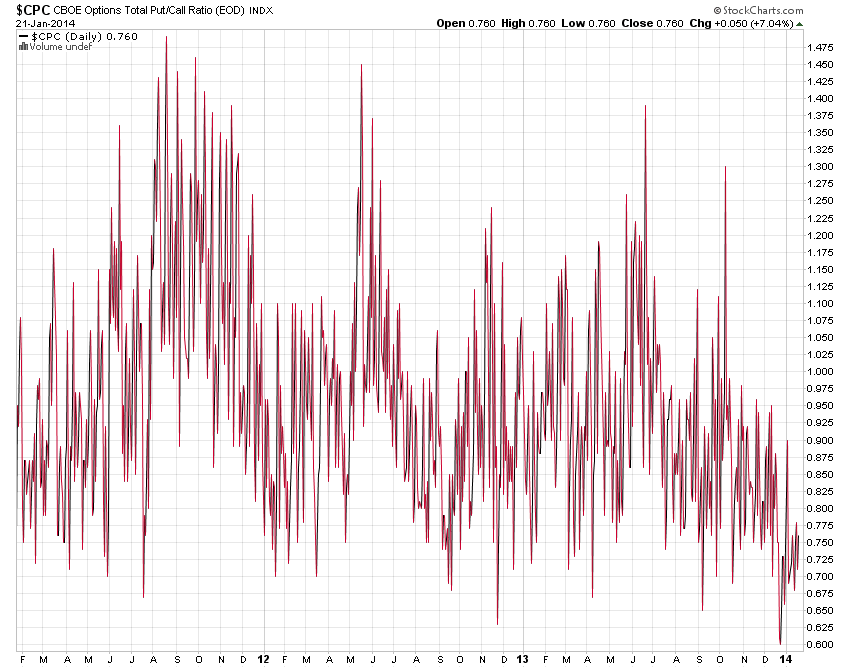 Source: Stockcharts
Historic elevated Skew persists:
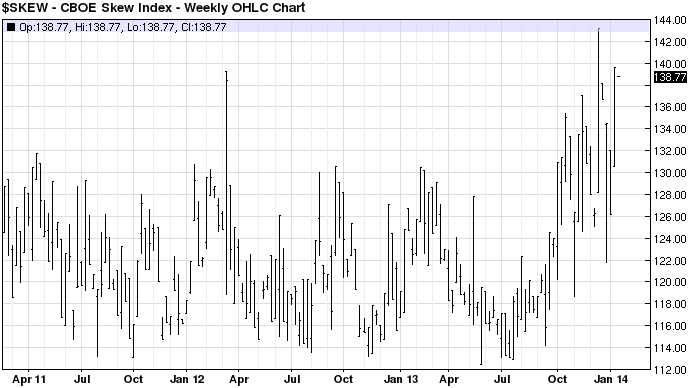 Source: Barcharts
Contrarian global equities allocations persist:
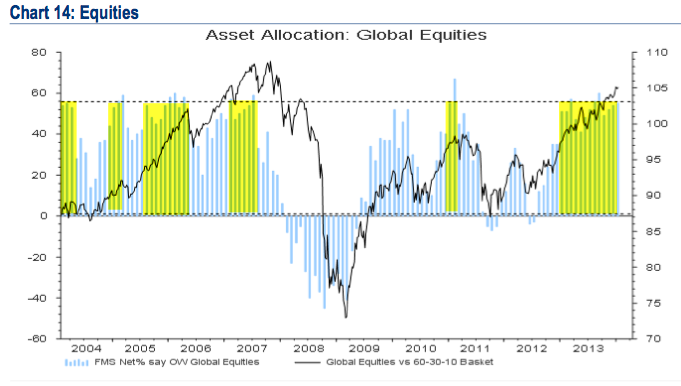 Source: Fat-Pitch
There is no doubt in my mind that this will all look obvious with hindsight once a major correction kicks in, but for now the majority don’t buy any other scenario for equities other than up. Which brings us to the near term action.
The stock market since the turn of the year has been a bull-bear battle and an overall sideways range on US indices. The Nasdaq and Russell have been edging up to new highs, whilst the SP500 has tracked overall flat and the Dow has been in a downward bias. At this point it remains to be seen whether the bulls will resume control and break the markets upward further into steepening parabolic, or whether the bears are about to become the dominant force and begin the correction.
My case for a 31 December top remains, as per the mutli-angled case I put together. The Dow and Nikkei and SP500 (which double topped) are honouring it currently and the action for the remainder of this week will be telling. If I am correct about that top, and the relevance of the 1929 analog, then I see us here:
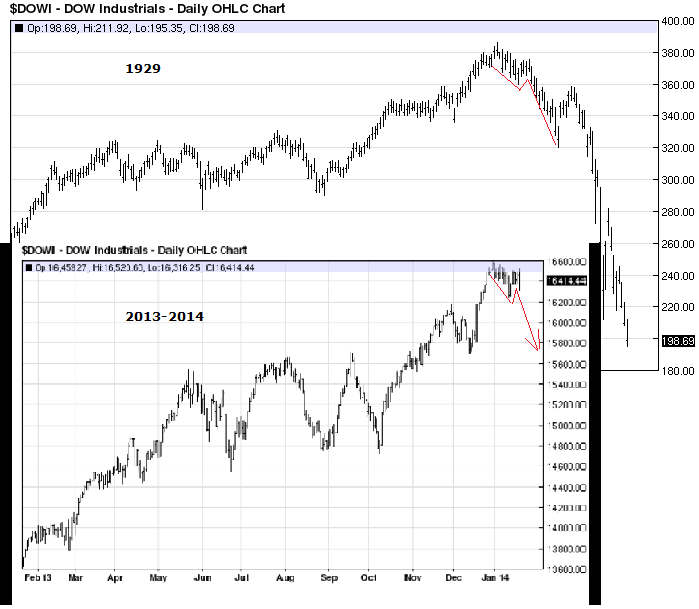
Underlying Charts: Barcharts
The bull-bear battle should continue but the bears should overwhelm from here and drive the action.
If I am wrong and the market breaks upwards, then we have the lunar positive fortnight to support this, together with low forecast geomagnetism, and I would look to the next new moon of 30th January to potentially mark a top. But for now, I remain optimistic that the bears will take the edge here. We have seen recent signs in gold miners and treasuries holding up and advancing, even as equities have been rising. We have also seen a breakdown in the consumer discretionary sector which has been a key leader of this bull.
Below are daily charts since 2009 for Google, Amazon, and Biotech, all leading stocks/sectors in this bull. The parabolics are clear to see, and Biotech has particularly gone vertical, which suggests a blow-off top is likely before the month is out.


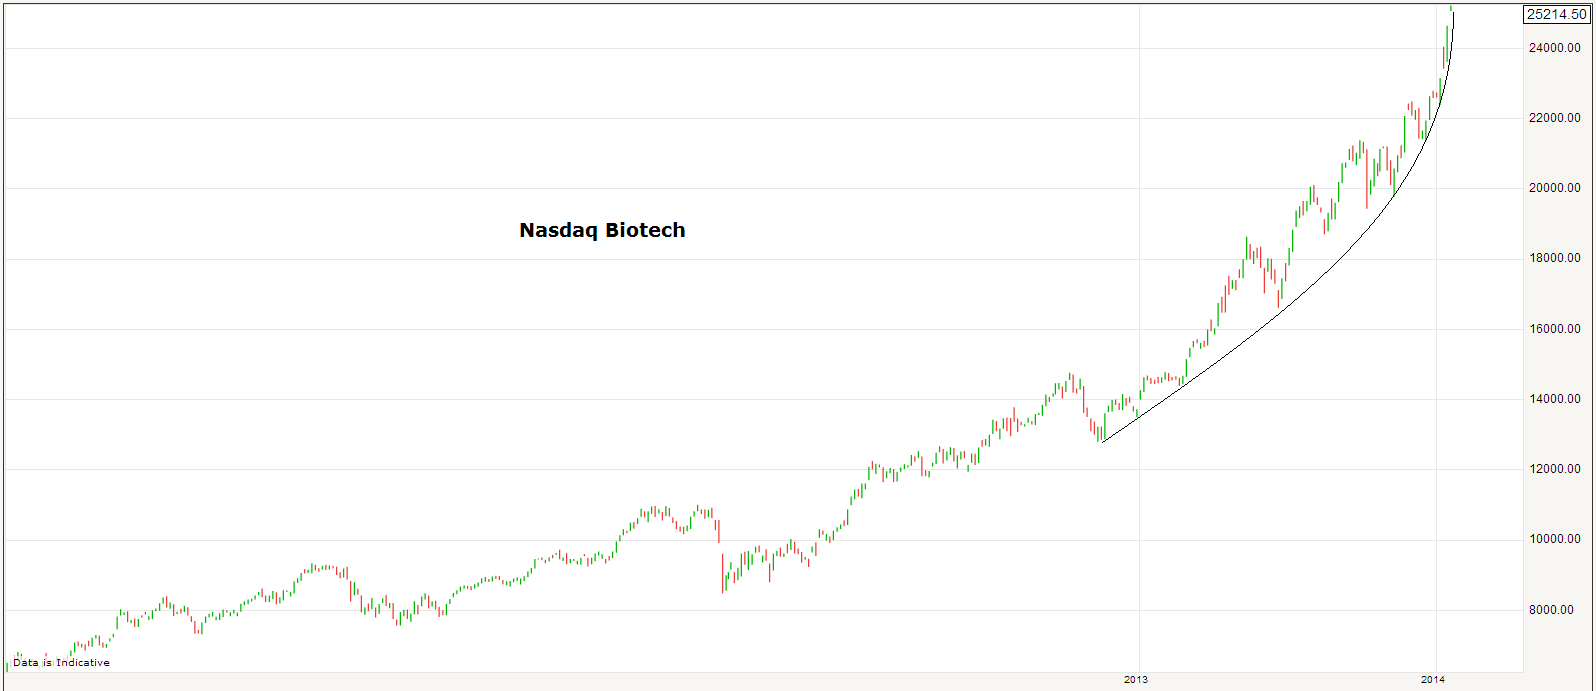 We need to see all three break. Until then they remain the embodiment of the danger to the bear case: that we first break upwards in an even steeper parabolic in US indices, before a collapse occurs.
I end with the SP500 monthly chart which shows the difference in the technical shaping of the 2000 and 2007 tops to now.
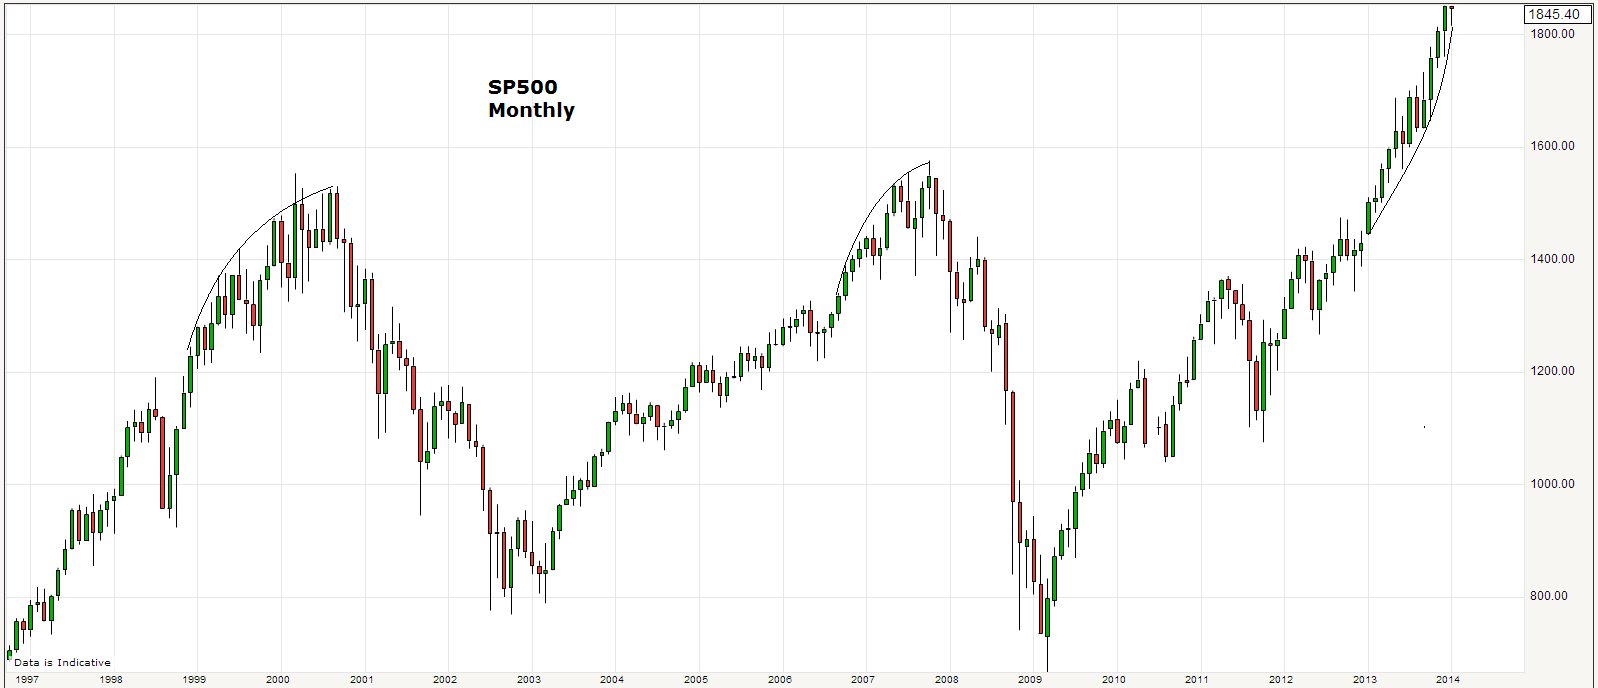
These last two peaks saw a gradual loss of momentum give way to multi-month topping ranges, whereas the last 12 months of the current bull has become a parabolic bubble, set to pop in a similar way to the club below:
 Source: DailyFinance

Good morning all!
Further to a post several days ago where I outlined some of the very basic reasons why I think we haven’t seen the top yet (everyone *expecting* a correction etc), I would like to put forward an idea more based on simple technical analysis to supplement the earlier post, because it would be rare indeed (in my experience) to have a serious crash when a lot of people are waiting for a correction (unless there are macro events that cause concern).
On the SPX, as far as I can see as long as we don’t have a close below 1815 initially then we are going to drift higher. If we break 1815, I would assume that we would be looking at levels around 1770 or 1730 for support. I wouldn’t be surprised if the backtest is fairly quick like we saw towards the end of the year where we dropped back sharply over a period of 2 days – but I *suspect* that because a lot of people are expecting a 5-7% correction that these types of levels is where there will be buying as people who are late to the party are holding back so they can get on the “bull gravy train”.
Personally, I think we may see an overshoot to 1860 odd, then down to 1770-1730 where we rally again and I think 1960-70 on the SPX over the next 4-6 months is quite possible. At that point I think we would have an important top in place, the 31st December high feels more like a “tactical top”…..due to sentiment.
I am heavily invested in gold miners as per previous posts, I am currently down about 8% overall having accumulated for the last 3 months but these are not trading positions, but rather “investing” positions. I could see gold rally to perhaps $1550 or so over the same period I talk about in relation to the SPX above.
That aside, I do agree that demographics are extremely important to longer term investing, but I see these personally as less useful to shorter term trading. Demographics and solar activity seem to me more useful as indicators on a longer term basis and difficult to use in terms of calling tops. Having said that, my prediction of 1970 or so on the SPX is not many % points away from where we are today. I certainly will not be adding long positions at this point, although I may be tempted around 1750 if seen. Depending on level of support there the bounce could be strong.
If we break the 1730ish level, the 200sma is at around 1700 today which is an area of support potentially, but if we get that far I think we may overshoot to the downside to around 1660 or so as a “fakeout”.
Apologies for the long post, I am no technical star although I find it very useful personally to take the emotion out of trading. I just wanted to add some detail from a price perspective, to my earlier post (Red Flags thread) from a “sentiment” perspective.
Take care
J
Thanks for your case Jegersmart
Thanks J,,,very interesting thinking and on balance I tend to agree with you.
Here is a way of looking at the market that is already in synch with John’s work yet allows for the 5% that may be left on the upside…. The majority of the dow30 have traded to their upside targets and turned down on their initial break..Simple technical retraces to resells accompanied by moves to upside targets by the laggards would give the final 5%…
Thanks Slater
And the math behind the 5% is this.The $indu is dollar weighted. If every dow stock went up $3.41 from yesterday’s closing price, the 5% would result.
John
Do you have a view on the DAX? Ive seen your previous charts on FTSE and we are up against some key resistence levels. However, it appears to be very strong at these levels whilst the DOW is weak
Duncan
Not been tracking that one so close Duncan. But this is how I see it: if the US markets go down, everything will go down.
Thanks John. Certainly some weakness on the Dow. Only problem is R2k and Nasdaq continue higher and europe staying strong too. Would be nice if they were to follow suit too.
John, days ago I argued the cycles (Dow Jones) as I understand them> 300y-cycle; 90-100y-cycle; and 17-y-cycle.
You answered me they were to basic, but they have worked secularly.
Some months ago, you thought we were in a bull-trend- prior a natural drop, but changed your mind and I´m suprised with your new thesis, based in your Demographics trends.
I respect you, but I manteined for some years ago european and US indices were following the steps of Nikkei´90, but before european and after -must respect Dow Jones Cycle-, Us indices, after finishing 17-y-cycle, in 2017 and last step, parabolic step to new highs in 2023+-, similar structure 1923-29.
You can see the upward strcture of it in the current Dow.
But this time 2023 will be the end of 300-y-cycle from 1720 and the final of the Capitalism and we wil see unfolding the Nikkei´90, intensified and for a long time, like the 1720-1835 strcture.
Yes, we are in a top, more or less, but this is not the parabolic top preceded huge plunges, like 29 or 1835, 1720, Dow Jones must finish the 17-y-cycle and the top, as I studied migth be around +4 years after surpassing the current top 2019+4> 2023+-, like 1925+4> 2029 or 1983+4> 1987 (but this is not the case), and the exception for the 17-y cycles after a sell-ff is like this:add 17 years to the low of the prior 17-y-cycle, 1914-15+17> 1932 and so on.
I´m sorry if I disturb your analysis, but I´d like to contribute a different view of your thesis from Historical Charting.
Thanks. @apanalis.
I appreciate your analysis Antonio, and can’t rule out your prediction. We will get more clues with time. For now we both expect the correction.
Blinded by the Sun, terrific and poetic title. The basic CNBC mantra is only 10 or 20% up this year for the market, but we could have a correction. In 1987, a large number (everybody) was expecting a correction. I interpret a large call for corrections that emotional bullishness has been slightly tempered by the bearish evidence John has presented so well. Of course, a top can be like a backwash at high slack tide making one feel the tide will never go out. I like the part that considering the last two tops, it is crashes’ turn.
Thanks Kent
Antonio
The cycles that you talk about and I have read about elsewhere (differing lengths, frequencies etc), my comment or approach to these have been: “why do these cycles exist”? What causes them? In order for me to take these seriously I would need some plausible points to consider why they seem to occur, rather than take them at face value because they have been happening for x time. How many 300 year cycles can we include anyway? I tend to try to think like the turkey in the book Black Swan by Taleb. Just because something has been happening for a while doesn’t mean it is going to continue. To paraphrase Taleb: “there is nothing in the turkey’s experience or existence over the past 350 days that would even indicate the *possibility* that tomorrow will be different” (referring to of course when the Xmas turkey gets his chance to make a good meal for someone).
From that viewpoint, I agree with John although perhaps for different reasons. I do not follow cycles unless I feel reasonably confident that I understand some of the factors that cause the cycle to exist. This is important to me because it may allow the possibility to detect a change coming if one has some knowledge of the factors. If you have any on that subject I would be very interested to hear them as I have not been able to find too much on the subject.
I appreciate that for some my post will bring into light considerations such as definitions for “knowledge” is and how this is actually defined when they are based on a subjective observation or logic based on one’s own experience, cognisance and so on, but I am trying to keep thing simple to keep my limited brain from overheating. My questions would be this:
1. The 300 year cycle, what is it based on? What was the 1420 to 1720 cycle like? And the 1120 to 1420 and 820 to 1120? What were the reasons for these? The South Sea bubble was devastating for the UK at least, but I am no historian so don’t know the details there.
2. In relation to the 1720-1835 structure, do you mean there was a 115 year long bear market?
I am aware I am asking for reasons, when these may not exist. I am a firm believer that we should bear in mind the difference between “what we know” and “what we think we know” – although this is far easier said than done….for obvious reasons…:)
Look forward to hearing from you.
J
Why must you know the reason for cycles? The scientist in me agrees that one should look for the reason. However, sailors had no idea for thousands of years of what invisible force caused the tides, but they used them constantly. The problem with the cycles we use is that tsunamis, typhoons, etc easily overrun the lesser cycles. One overriding storm force is the credit cycle or printing of money.
Cycles are based in human behaviors and human tend to do the same things over time. I come to these conclusions after studing hard past years, I´m only a long term-run trader-investor, short or long depending the structure, with no leverege, or minus. I´ve studied the Dow Jones index, the oldest one and the prospections have made before based in UK and US economy, also universal ancient centuries.
Never is the same, but similar, +-300y-cycle; 90-100 y-cycle, 17 y-cycle within and so, you can check it, but in the short term, mid-term, the market make some clues that must identify and you can be wrong for a while, like me from summer 2012 to nowdays, I thought the strructure was likley to 1966-83 in the Industrials, but the Fed altered ans distorted the current structure, or may be i was wrong in the short term, and currently the structure that fits, is the s&p 1980, from 1974 (1966-83) or the upwards wedge 1909-16-19, prior to 1929 crash as explained above.
I´m a med-long term investor.
Did you hear about warren Buffet?
He trade in the long run, but is not obstacle to loose in the short term but you are right in the long term. but he don´t use historical chartind, as far as I know, he is fundamental analyst.
I do not force anyone to belive it.
I do not have any web, blog, site, I often write ina a spanish forum, I was so popular in Spain, I was proposed for an international fund- investor firm, but I prefer to work for me.
Also people are so interested in the short term, they like easy profits, for today, for next month, for a year. this is not my proposal.
Also the responsibility is only mine.
I have a account on twitter> @apanalis, but I prefer discretion, I can not diclose all my sources.
Yes, from 1720 to 1780 was a devasting market and only more tha 100 years after reach similar levels.
it is up to you belive or not.
I suggest to study by yourself, is the best way to reach knolwdge.
I´m not economist, in university don´t indicate cycles, not suit them!
And read Mark Twain
@apanalis
Hi Antonio,
Yes Buffett is a fundamental investor, but he also likes 17 year cycles
http://www.17yearstockmarketcycle.com/2012/11/warren-buffett-in-fortune-magazine_3.html
ATB,
Kerry
Hi John, excellent stuff once again! you certainly go through all the
angles with your work 🙂
hey I think I noted here somewhere back in December that my stuff
was lining up with yours with a larger-degree peak in the process of
forming. the 180-day wave had suggested higher highs, however,
into at least mid-January of this year – which we have obviously now
met, with the highest high made for the SPX last week at the 1850.84
figure.
I have no clue whether any major high is in place, but I am guessing
that higher highs are still out there following any short-term corrections,
as per McClellan’s ratio-adjusted Summation index, which ended
yesterday’s session at the +611 level.
for more on that:
http://www.mcoscillator.com/learning_center/weekly_chart/summation_indices_messages/
for me, the current dividing line with the SPX CASH is 1767.00 intraday.
that is, if taken out to the downside at any point, then a larger correction
should be in play, one that could be in the range of 18% or better off the
top.
for Gold, I see the dividing line there at the 1267.50 figure. If taken out
higher, I would expect continued strength into mid-March, and a move up
to the 1430-1480’s before all is said and done.
http://goldwavetrader.com/page17.html
the above are key levels to keep in mind going forward, at least from
what I am seeing at the present time.
Thanks for your input Jim
geometry at today’s high allows for another trip lower until exceeded
John,
A couple comments on timing the top or correction. I think it has a better chance to occur during your next focus point around Jan. 30th.
I think the popularity of the DeMark ’29 crash call and Hussman’s focus on the Sornette Bubble got too many people looking at mid-Jan as a top and subsequent crash. It seems like a ripe set-up for another push higher to take out those currently positioned bearish.
However the Red Flags remain and I think it is only a matter of time. There are a couple aspects of the Jan. 30th period that I like in addition to the new moon. One is the FOMC meeting on the 29th, and if prices push up in the days ahead then they are likely to hold up into that period. Another is some Fib. based Log Spiral work that I have done that indicates the Jan 30th period as important from drawing projections from prior pivots since 09.
So my personal best guess is a decline from Jan. 30th (+/-) into mid-March targeting either 1655 or 1580SPX, then a retest of the high into mid-July.
Thanks.
Thanks. We’ll see.
I wonder who is doing what with the surplus funds of the 85 individuals that are said net worth equatable to the lower level 50% of all humanity. All circa 3.5 billion of them.
Does their vast wealth lead us or follow us? I just wonder, because this revelation just beggars belief, and yet I am not shocked.
Otherwise I just gasp at the Bitcoin hoohah and wonder about its core establishment and lack of information about its supposedly infallible control. As if untouched by anything human, just another an immaculate conception.
Some things just appear to move in mysterious ways.
P.S.: Gold P&F just flipped back to bullish on a double top breakout. Recoil underway. Target zone moved to $1410. Gold miners went bullish a few days already. Great entertainment value regardless.
Thanks
http://www.bloomberg.com/news/2014-01-21/why-bill-fleckenstein-is-almost-ready-to-short-stocks.html
Thanks
Up we go ^^^^
http://algorithmicswingtrader.wordpress.com/
My compliments on your work! I personally stumbled across the sun spot/stock market correlation purely by accident via an article on global warming which led me to a NASA article on sun spot cycles. As a macro market analyst I immediately recognized the potential correlation between sun spots and the stock market which led me to a deeper dive into the possibilities.
If I understand what I’ve discovered correctly, the “solar-maximum” peak should occur when the sun’s magnetic field changes polarity marking the mid-point of Solar Cycle 24. NASA originally predicted the peak to occur in May of 2013 but later predicated a “double peak” which should take place by Dec 2013.
As near as I can tell, the double peak has yet to form and we are still waiting for the polarity shift. The most recent NASA info I could find suggests that the double peak may not occur until 2015.
In your historical research, have you found that the polarity shift precedes the stock market drop?
NASA suggests that there will be increased solar activity following the peak and the polarity shift. Does your research suggest the market will drop when solar activity begins to subside after these events?
Hi Leo , both poles actually have flipped now. Combining that with the sunspot forecasts of Nasa, Noaa, Solen suggests the solar maximum should be peaking around now, and so the speculative peak in the markets too.
Hi Kent
Your question as to why I feel the need to know the reason for cycles could lead to a very complicated discussion involving empiricism, philosophy, environment/genetics as well as subjectivity. But in simple terms, I tend to distrust basing decisions on cycles just because they have existed in the past because this may change at any time. I therefore feel the need to understand if possible why cycles occur so that I have other parameters to monitor for clues.
This is just a personal view, I guess there is no right or wrong here…:)
J
I’m with you Jegersmart, I want both evidence and reasoning for it. We have enough stock market history now to always ‘find’ an analog, fractal or cycle on all different timescales. Most will be red herrings, some will be the ‘gold’.
Read my above my response, jeger. This is up to you, but I think your distrust will be an obstacle in the mid-long terms.
Take the historical Dow Jones chart and the prior prospections ans take a Commodities chart, like old CRB and prior prospections, Gold, Oil, etc and take your own notes, or for example the EurUsd parity, you will be very suprised!
@apanalis
Things looking more promising for commodities to make that late cyclicals rally (as equities top, and playing their usual role of sucking the remaining life out of the economy) and in doing so maybe that higher high above 2011 on the CCI. Momentum is with oil and gas, and inventories of both have been declining. Inventories across the metals spectrum have also largely been declining, removing some of the excess slack. Precious metals further basing. Agri has yet to join in any meaningful way. Early days, so let’s see.
crucial moment for the computers……
….and the humans
off the sell algo on yesterday’s close in the SPY, price exceeded the exact price by 13 cent needed to launch price once again to a marginal new high in late jan coincident with the lunar… if today’s low holds, the upside target would set up the exact same algo, but on a much larger scale…the bears know this and want to vigorously take out this mornings low to show who is in charge. we shall see!
at today’s lows a pattern set up that i have not seen in the market in years… it is correct in every way…. until it is taken out i can not stay short…
looking at my records i have not seen the setup used to turn price ….in years…. that is why i think it may be suspect, a hook,,, but also why i was no longer willing to be short until it is taken out..
Magnetic pulse can stop migraine
http://www.telegraph.co.uk/health/healthnews/10588318/Magentic-pulse-can-stop-migraine.html
This shows even more that all day long we are influenced by magnetism.
Computers act like human because they are produced and instructed by humans, therefore they will react to influence of solar cycles indirectly as a result of human reactions. They only can react the same way faster.
Slater, fair to say the morning’s lows were taken out or do you have to wait to see how the index finishes EOD?
Not necessarily “the end” but we are getting closer 🙂
Great work John. I hope your industry and passion is rewarded.
FWIW, I think we need the next full moon to see the sell off. But WTFDIK.
GL
Thanks all
Hey TDL, not seen you for a while! Hope you are well bud?
Good thanks jegs,
Well, what a difference a day makes!
Just as an aside, I have been in touch with Commerzbank and their economists seem to be expecting that the ECB will lower the refinancing rate to 0.1% and the deposit rate to -0.1% (no specific timeline) which if occurs will probably result in a considerable amount of funds looking for a new home (and yield). Of course, this could end up anywhere but I thought it interesting to share.
J
Definately worth sharing, thanks.
Oh come on. People are hardly feeling optimistic due to “hope.” Global output gaps are thrinking, which means growth is going to pick up. Exactly how long this is going to last is debatable (no one really knows what the new buisiness cycle length is), and if world governments mess up we could still have a major economic crisis. But the case that growth is going to pick up in 2014 is pretty strong:
* The post-2008 global economic adjustment is going well. Both the U.S. and China’s current account imbalances are much closer to sustainable (we won’t know if they really are until the Chinese economy reaches a “new normal” and the U.S. returns to full employment).
* Wages are accelerating, while current accounts in developed countries are roughly sustainable. Combine this with low inflation, and there’s a fair amount of room for consumption to grow (this year, at least).
* The output gap in the U.S. is shrinking rapidly, at least as measured by the government’s Industrial Capacity And Resource Utilization statistics.
There’s a lot of reasons why people should feel optimistic about this year’s economic performance. Whether or not it’ll last is another question, of course.
OECD derived leading indicators suggest a Jan/Feb global economic peak; Narrow money leading indicators suggest a peak occurred around November. That’s why I said ‘hope’.