

The opposing trends in the Dow and gold over the last 2 years have doubled the Dow-gold ratio from its 2011 low to around 11 today:
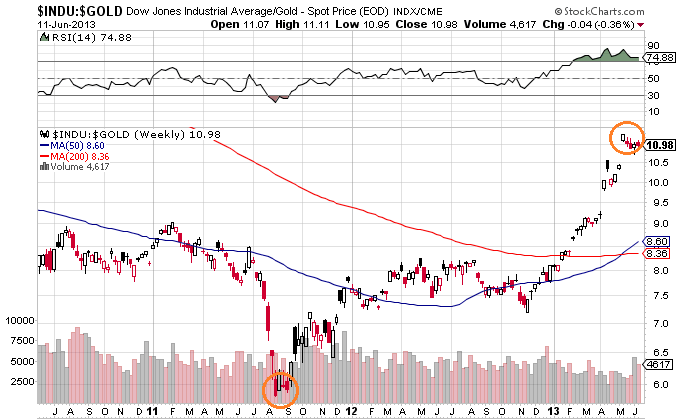 Source: Stockcharts
Another delve into demographics reveals that the US Middle / Young ratio topped and bottomed historically very closely with the Dow-gold ratio (click charts to view larger):
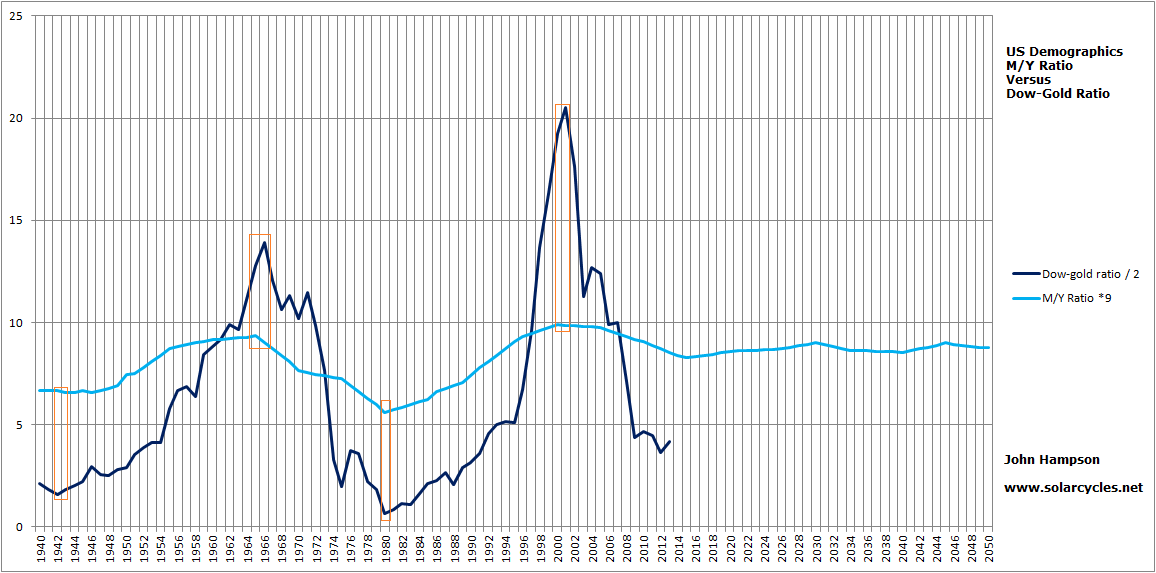 The demographic data points in the chart are 5 -yearly but a more detailed view of the M/Y ratio for the USA reveals a flattening from 2014-2019 and a true bottom and pick up from 2019. That would suggest a bottom for the Dow-gold ratio in that 5 year window, but with a bias towards 2019. However, ‘secular’ bull markets have typically historically peaked around solar maxima, which could bring the bias back towards 2014 (if the solar peak is this year).
Drawing in the other key demographic measures of Middle-Old ratio and Net Investors, the correlation is reinforced:
 However, the projected window for a Dow-gold ratio bottom widens to 2014-2022 (again viewing more detailed data than my 5-yearly above). Furthermore, from here forwards we see much flatter and also divergent demographics which may potentially spell a new era, in which more balance between gold and equities is maintained, with less wild swings between the two.
The UK FTSE-gold ratio history looks like this:
 Source: Goldmadesimplenews
The UK demographics look like this:
 The FTSE-gold top around 1965 matches the demographics top. The FTSE-gold bottom 1975-1980 matches the demographics bottom. The FTSE-gold ratio topped in 2000 around 5 years before the demographics topped, and I would suggest the US influenced this. The bottom for UK demographics is from around 2020-2025.
Adding China, Japan and Germany to the USA and UK into a weighted model (by GDP and stock market cap) also pushes the demographic bottom out to around 2025, but again divergent and flatter trends put a question mark over that point and thereafter:

Drawing all together, I would suggest the likely window for the Dow-gold ratio to bottom is 2014-2025. As ‘secular’ bulls historically have ended close to solar peaks, then I would refine that and suggest the likely bottom for the Dow-gold ratio is either 2014 OR 2025 (based on solar peak projections of this year and around 2025). If the middle-young ratio is the more dominant demographic ratio for stocks-commodities then 2014 is more likely, both by US and weighted-composite demographics. However, gold would need to take off soon (and/or the Dow collapse) to enable that. Either way, going forward we might expect less long and less wild ‘secular’ swings in the battle between gold and stocks, based on flattening and divergent demographics ahead. We might rather find alternating cyclical bulls and bears between the two.

I have joined Twitter: @SolarCyclesNet
@apanalis
John,
Your Lunar Edge goes by calendar days, correct?
Yes, calendar days
most probably the C-down in an ABC-correction has started in US. Must be confirmed by breaking previous low. Target for DOW somewhere around the April low
Looks so, well called
John, check FTSE in gold in 2011. It was under five in August.
Anyway, nobody mention double top in gold in 40’s. 1947, and 1951 the higher one.
Have you looked at this? Last Winter/Spring change. 😉
Yes, for each secular commodities peak in the past, commodities came again a couple of years later. I guess the story doesn’t get resolved overnight.
John, I noticed you added arabica coffee the other day but it got hammered last night again. They say there is a leave rust problem in central America but Brazil large crop this year will more than make up for it. So can we really ignore fundamentals like this when trading coffee?
Yes it’s down for fundamental reasons. I’m simply trying to gauge where I see the best chances of future upside. I believe I’m buying low.
For Norway I have a very high probability of soon going below the April-low (down ~2-3%)
And later (within months) also testing the November-low (-9% from today)
Norway about to give a ~3 day bounce signal. Its up to SPX today: C-down or a bearflag up to 1650 again?
Oil. Cramer, who parrots hedge fund thinking say OPEC is manipulating market to keep prices up. Pompanofrog, an excellent commenter on Seekingalpha about the credit cycle, says oil prices are being suppressed? Inventories are at 80 year highs, which could be bullish – bulls are born in the depths of despair, but prices are high. So I looked at commitment of traders (COT). The commercials are selling at over 25 year highs. The speculators are buying it all at similar 25 yr record levels. This has been going on for 2 years. No guarantee, but that is extremely bearish. At extremes, commercials are usually right and speculators are usually wrong. Short term, the COT is at levels that saw oil drop from $110 to $80. So even though oil looks bullish chart wise, I interpret COT to mean another big deflationary flush is on the way led by oil.
The theory is that the commercials have more oil to sell every day. Whereas the speculators have relatively finite buying power. So either a new source of buying appears, or supply will overwhelm the speculators.
Hi Kent
I like your comment
But there is still lots of DEMAND in the market.
How do we see if somebody (China) is stockpiling and at the same time , getting out of dollars?
Bob
Why would someone want to get rid of U.S. dollars? its a bull market, excellent buy here!
the truth is nobody has any money, its all borrowed, speculative. Margin debt is near all time highs. When that margin call comes they’ll be begging for dollars.
SPX chose the way that Norway suggested (and FTSE). We were too oversold, but didnt crash… so up we go again.
Should cancel the ABC-correction (who wants to be short ahead of FOMC?)
And instead we will do this
http://www.forextradingplus.com/gartley-patterns.htm
Last planetary tidal peak was May 16, and the normal sunspot-lag is about 40 days, suggesting a sunspot-peak around end of June.
However the Sun has died, and sunspots topped just after the tidal-peak.
So it is getting late for any surge in sunspots from the latest tide, and it is a while to the next tide. Could be a very boring Sun this summer.
Added to MSCI Brazil, JPM Russia, copper, gold, natural gas, and cocoa today
and ETC Agri
Marting Pring latest:
Click to access TA_JunIssue2013.pdf
John, How long do you think it is for a puoto crash, is it imminent. what are your thoughts, thanks Tony
A puoto crash?
sunspots are picking up a bit again… probably the ~40 day lagging top after the May 16 tidal peak
Perhaps a Puetz crash window…
Excellent analysis John. My time ratio analysis also agrees with a 2014 (late) top. I have been getting more and more interested in solar cycle analysis and your website is a gold mine of information. Thank you for keeping it open to all users. I share a similar attitude with my work as far as keeping much of my analyses free and open for an interested readers – though my work is still very beginner and amateur compared to yours. Thanks again!
Thanks