

Both sunspot and geomagnetism cycles correlate with long term global temperature variation, with geomagnetism having the closest correlation co-efficient:

Source: Landscheidt
Changes in global temperature have been demonstrated to influence fertility and birth rates. A composite of 19 countries below shows the inverse relationship between temperature and birth rate over the last century:
 Source: ScienceDirect / Harry Fisch
Sunspot and geomagnetism cycles therefore affect demographics through global temperature variation.
There is also a global temperature oscillation related to solar cycling, shown below. Therefore we have two solar influences on climate: an 11 yearly oscillation and a long term trend following long term changes in solar activity.
Source: C Camp
There is typically a spike in births around solar maxima – an 11-yearly peak – oscillating like the above:
 Source: W Randall
Additionally, birth rates have been shown to vary with the economy, typically declining during recessions and rising during boom times.
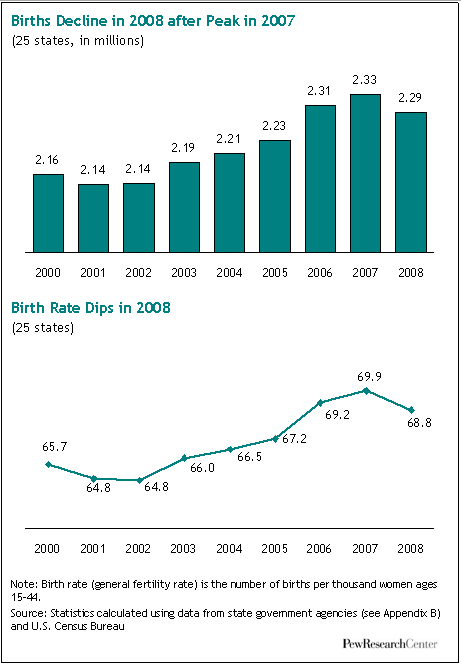
Source: Pew Social Trends
There is a pattern to recessions following solar peaks, and therefore births declining following solar peaks. The chart below shows all three for the US, with the solar peaks marked in black. There is generally a spike up in births at the solar peak followed by a pullback or flattening in births aligned with a recession.

The major peaks in births occurred close to the solar maximums of 1917, 1958 and 1989.
Typically there is growthflation in the economy into a solar peak – which should encourage more births – and human excitement peaks with the sun. Perhaps human excitement at the solar peak also translates into more births, in terms of human behaviour effects, as snow shoe hare populations have been shown to peak around solar maximums. Then, following the solar peak recession and unemployment peaks typically occur, which would pull back the birth rate.
In asset markets we also see both an 11-yearly oscillation correlated to solar cycles and additionally a mapping of long term trend. This is a busy chart, but it attempts to show both the 11 year solar oscillation and the long term solar variance trend against risk assets, demographics and temperature – click to view larger:
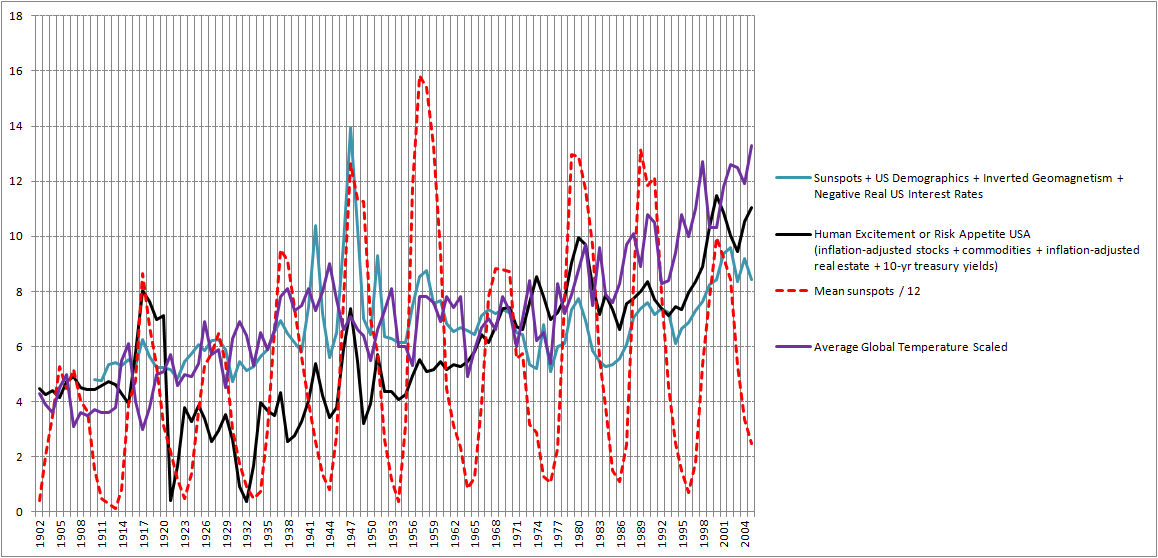
So we have a six-way relationship between sunspots, geomagnetism, climate, demographics, the economy and the financial markets. The sun is the agent, and temperature and human behaviour (which translates into economic, risk asset and birth rate effects) are the subjects. There are two patterns: an 11-yearly oscillation and a long term trend variance. Within this multi-relationship there also appears to be a cause and effect chain from the sun to global temperature to birth rate (which becomes demographics) to long term risk asset performance in stocks and real estate.
If we are moving into a long solar quiet period then global cooling should become the theme and this should have implications for fertility, producing a trend of increasing global births. However, if man-made warming overrides the cycle of cooling then the opposite could occur. Whichever wins out should have implications for the world economy and financial markets later in the century.

very good again John 🙂

Earlier we had a small discussion on household debt/debt-burden. I think this may be one of the better numbers to look at: the debt as percentage of income
Has declined somewhat, but still above 100% and looks saturated to me
btw in Norway I think it is more than 200% of household income…
in fact it was 240% in 2011, and risen since…
Thanks Jan
if cooling gives higher birth rate, then I guess there will be some kind of lag before it has an effect on economy. So anyway I see trouble the next ~10 years…
“If we are moving into a long solar quiet period then global cooling should become the theme and this should have implications for fertility, producing a trend of increasing global births.”
John, should this read “producing a trend of DECREASING global births” or am I misunderstanding you piece?
TDL
TDL and Wxguru, the second chart shows the inverse relationship between temperature and birth rate. I found three papers all coming to this conclusion, which means global cooling should increase global birth rate.
Can you send/share a link?
If you factor in virology and cellular health and how electromagnetic fields influence, should be able to find correlation that viruses and bacteria, sickness in general also tampers population growth during minima or low sunspot…ergo bubonic plague, 1918 flu? Okay, maybe way off topic for here, maybe not? If we’re trying to forcecast but also explain the past with forecasting methods.
More conceptions occur during the cold months in all species. A breakdown of average births by month should show this 9 month human gestation in utero traced back to conception.
http://www.sciencedirect.com/science/article/pii/S0306987703000616
http://rsbl.royalsocietypublishing.org/content/2/2/289.full
http://www.ajol.info/index.php/gjes/article/view/2410
I had looked for the pandemic link – here’s a chart making the claim: http://www.science-frontiers.com/sf068/p068-11.gif
Hi TDL and Wxguru
I understood the post the same as you….global warming gives a higher birthrate.
But logically, if its cold , you stay home do whatever.
regards bob
Thanks John
A higher birthrate to compensate for harsher conditions/ higher mortality rates perhaps?
Interesting points in respect of virology wxguru!
TDL, there are a few links out there if you google “virology sunspot”. Plant and animal correlations. However, I have not read close enough yet but I recall cooling or lower sun activity as being good for viruses.
Birth control has also caused the flattening..Otherwise later part of the CDC population graphic should have had a higher arc in red line towards the 1980’s. Good to try and look for other species excitability in nature like the hare you suggested. Human excitability is there, but the birth control tapers the outcome.
As for cooling triggering increased births, is that a typo? I don’t see the evidence here and is contrary to all whats been discussed to date.
Also man made global warming shouldn’t be a factor. I think we influence things much less then some with big egos and currency signs in their eyes would like us to believe. Newsweek in 1974 around a point in solar cycle was tying erratic weather here in the U.S. to global cooling. All an agenda. Think the solar cycles and geomagnetism compel plenty on their own.
Good post.
Good point re birth control thanks.
John, a beautiful picture to capture previous posts about how the orbital bodies disturb the normal geomagnetism (Bradley) but also exert a force on the sun itself encouraging or discouraging sunspots and the solar cycle intensities.
http://en.wikipedia.org/wiki/Interplanetary_magnetic_field
http://en.wikipedia.org/wiki/Electric_field
Not that far off from the 2008 NASA post about how the Moon moves around Earth in its 28 day cycle and causes disturbances, ratcheted up on grander scale. The photo is what I’d like a model of, not just a picture, see how the model aligns with current records for sunspots and solar cycles.
http://tallbloke.wordpress.com/2011/07/31/bart-modeling-the-historical-sunspot-record-from-planetary-periods/
Click to access 4451_leplae5.pdf
http://helios.gsfc.nasa.gov/solarmag.html
Need to try and graph influences of 17 year cycle of magnetic fields influence relative to sunspots, demographics, excitability. I figure there is decent solar wind data, temperature data. This will of course still observe things. A lot of what is charted is like observing a Higgs Boson without having a particle accelerator there to prove its existence.
Thanks for the links.
The 22 year cycle doesn’t appear to make obvious markers in my stuff. If I consider demographic charts, different asset charts, the temperature chart etc then every 2nd solar cycle would occasionally have relevance, but so does every 3rd, 4th, 5th and 6th on different charts at times. So the solar cycle, plus any multiple of, appears to be most potent, which could be simplied just to the (~11 year) solar cycle. The 17 year cycle shows on the real global real estate chart but its history is a bit limited, but maybe there’s more to be uncovered on that 1.5 solar cycle.
Hi John,
As I have said before I find your site interesting, I love the good natured and well informed discussions and I think you are a great trader (there is a however coming 🙂 ), however I am a firm believer in the 17.6 year stock market cycle (as you know).
While we have different cycle lengths it just struck me when you said a “1.5 solar cycle” that my cycle comprises uptrends of 4.4 years and downtrends of 2.2 years and 11 years corresponds with Up, Down, Up (4.4+2.2+4.4 years).
Ed Dewey showed that a ~17 year cycle shows up in all kinds of things in addition to property; tree rings, river levels, war (see link)
Click to access dewey-cycleswar.pdf
Food for thought.
Regards,
Kerry
Seems a bit spurious conclusion. We know temps have been rising and birthrates declines, but we can’t conclude they’re related.
Must also note, I think “global warming” is the most absurd idea that a handful of scientists have been able to convince the media of. Also, it’s become another method for taxing and regulating industries.
Sam, see links in the comments above.
I don’t share your view on global warming, though it was clearly overhyped and overstated for a while There is ample evidence for man-made changes, e.g. carbon dioxide, methane and nitrous oxide concentrations in the atmosphere up by 15-30%. The question is to what degree climate change is down to 75% deforestation of the planet etc, and that will only become clearer with time.
Sam, there is empirical evidence that global temperatures have risen since the 1950s on an annual basis. It’s also just basic common sense that the fuels we use pollute the air, any chemistry teacher will tell you.
The birthrate/temperature correlation is striking. For some reason, this reminds me of an episode of Walking With Dinosaurs, set in the Cretaceous. By that time in Earth’s history, volcanicity was high, so the atmosphere was being changed and the global temperature heated up. This coincides with the fact that it was becoming harder for Dinosaurs to reproduce and so they were having less offspring. Maybe the environment was damaging fertility for them.
The rise in temperatures and the fall in human fertility since 1900 is interesting, as contraception only came into play from the mid to late 20th Century. The World Wars caused enormously sharp drops in births too. Really interested in the fact that the Post-war baby boom coincided with a cooling in global temperatures.
Right, when looking at a hundred years of data for an ancient earth. All almanacs have predicted all current weather patterns even, which none can be explained by “man-made” gasses. Not to mention our rates are DRAMATICALLY down from what they were during the industrial revolution, we just didn’t measure it then. Think of how efficient all producing assets have become. It has probably been the most successful marketing ploy of our time. But yes, time will tell. Spurious correlation can be dangerous, as well as statistics can be skewed to “prove” any argument, and that goes for both side 🙂
Pete, yes, since the 1950’s… That’s not even a century of data. Depending on your view, the earth could be 5,000, a million, or even billions of years old… That’s like saying “Well the markets are up Q1 2013, and this will continue indefinitely, 15% a quarter).” Actually, it’d probably be more like comparing a few hours of market trading to explain the rest of the year. It’s just too small a sample size.
Sam, you’ll be surprised by the long-lasting effects of just a century’s worth of global warming. People are talking about the North Pole being non-existent in summer months in the future. The effects of China, India, Brazil, Russia and other nations industrializing over the next century will have an enormous impact on the climate. The smog hanging over Mexico City is a perfect example.
Obviously, you subscribe to the idea that global warming (or as I prefer to call it, climate change as some places may get colder) is a mostly fictional concept. I don’t agree with that notion, because science points towards the idea that, until we use more sustainable energy sources, we’ll be toxifying fresh water sources, producing more chemical waste and causing all kinds of harm to our ecosystem.
Figures might have come down since the industrial revolution, but bear in mind that the human population was a fraction of what it is now, and most of the population alive today lives in industrialising nations like China and India. They want their own slice of prosperity, like the West enjoyed centuries ago. The world population is growing bigger than ever, but the planet we inhabit and the resources we use are finite. More people are chasing less resources, so naturally a crunchtime will occur. Scarcity is a driver of markets, and we may find ourselves living in a state of perpetual price rises unless the right decisions are made in the present.
Gents, there are other forums to discuss this further as neither of you are speaking about solar cycles or the derived points any longer. Thanks.
wxguru, I have to disagree by saying my point is relevant to this website. John has mentioned how he believes a crunch time will occur in the future, regarding resources. This crunch time will have profound effects on the prices of assets, so I think it’s in everyone’s interests that we pay attention to the fact that we face huge problems in the future.
It might seem like I’ve deviated from the topics at hand, but I think it’s all relevant and that this is a public forum for discussion and we are all entitled to contribute in whichever way is helpful for those of us who participate in the markets. I hope you can see where I’m coming from.
Pete – Now I understand your thinking, it was not clear you were trying to connect it to commodities before. It just sounded like two viewpoints on global warming’s impact. On that commodities thought though, I had to do a paper for an environmental course in 2011, I think there will be perhaps a supply/demand opportunity for some of the R&D products cranking out meat and other farmed goods en masse with less of nature’s help. This would be especially true given if the Landscheidt minimum were upon us until the 2030’s. A good investment to watch on these food producer corporations if you get in early. One thing I have not observed John discuss by the way that I have done research on privately is tying the freezing of major water bodies in Europe and North America to the solar cycle minimums. While non CO2 pollutants are a concern, its appears from some research posted here that Ozone along with solar wind help drives climate and seasonality of weather. As a computer scientist and meteorologist, I can tell you folks at NOAA know data is skewed pre-satellite obs. I was part of a start-up non-profit here in the U.S. in improve ground obs in isolated areas among many other things. What I do know is the computer models do not factor in enough variables (ergo solar cycles) (otherwise they would need more computing power) and thus they are skewed. The one we use for Hurricane and cyclone tracking are on even keel and they cannot predict things accurately two weeks out. That said, when I can afford to do so, I plan on adding solar and wind power to my home.
You’re moving at the speed of light John!
I’m still on top timing. LOL
Moving at a snail’s pace, but I’m pretty jazzed at the moment after having just got my first article published on a major financial website!. Check it out. http://www.safehaven.com/article/29893/on-the-lookout-for-a-spike-high-top-in-equities
the euphoric effect of solar flares 🙂
http://www.solarham.net/xray.htm
didnt last all day 😉
this setup in SPX normally gives us 4-5% downside and a low in 1-4 weeks. Then a higher high in about 50-60 days from this top, and then a deeper correction.
Some cases behaved somewhat different, but none since 1996 had more than -6,5% downside the first 20 TDs after the top.
So the target is around 1600 somewhere (1560-1600), which seems logical (previous high, 2007-high, gaps etc)
Suicide may fit in the big pic. The rate is higher now than the great depression..What do you think.
Suicide is a good thing to tie in here. However, I would like to point out statistics are not very good due to how different municipalities reported it now and in the past; ergo, there was probably more then we think in the great depressions and recessions of yesteryear.
Good point but must also consider more govt and social safety nets now then in 1930’s. So would that cancel out the lower suicide number reported number by the number saves by the safety nets of today. Any thoughts
There is some work correlatiing suicide with geomagnetism. Here are a couple of links:
Click to access Sun%20(The%20effect%20of%20geomagnetic%20storms%20on%20suicide).pdf
Click to access suicide_geomagnetic_pdf_early_view.pdf