
1. By the Bradley Siderograph that would be 22 June:
 Source: Amanita
2. By Eurodollar COT it would be now:
 Source: Nowandfutures
3. By the historic seasonality of geomagnetism it would be June or July:
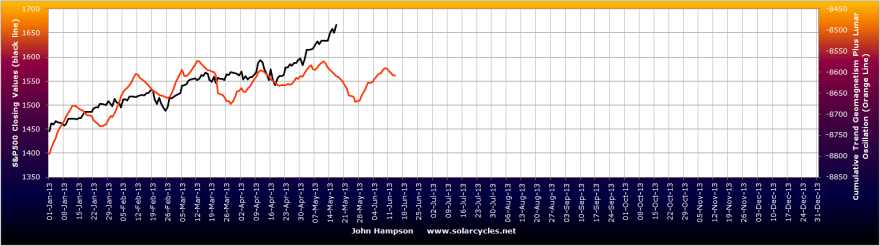
 4. By actual geomagnetism we have the potential for a top here, due to the SP500 pulling away from the model, which has lost its uptrend looking out to mid-June:
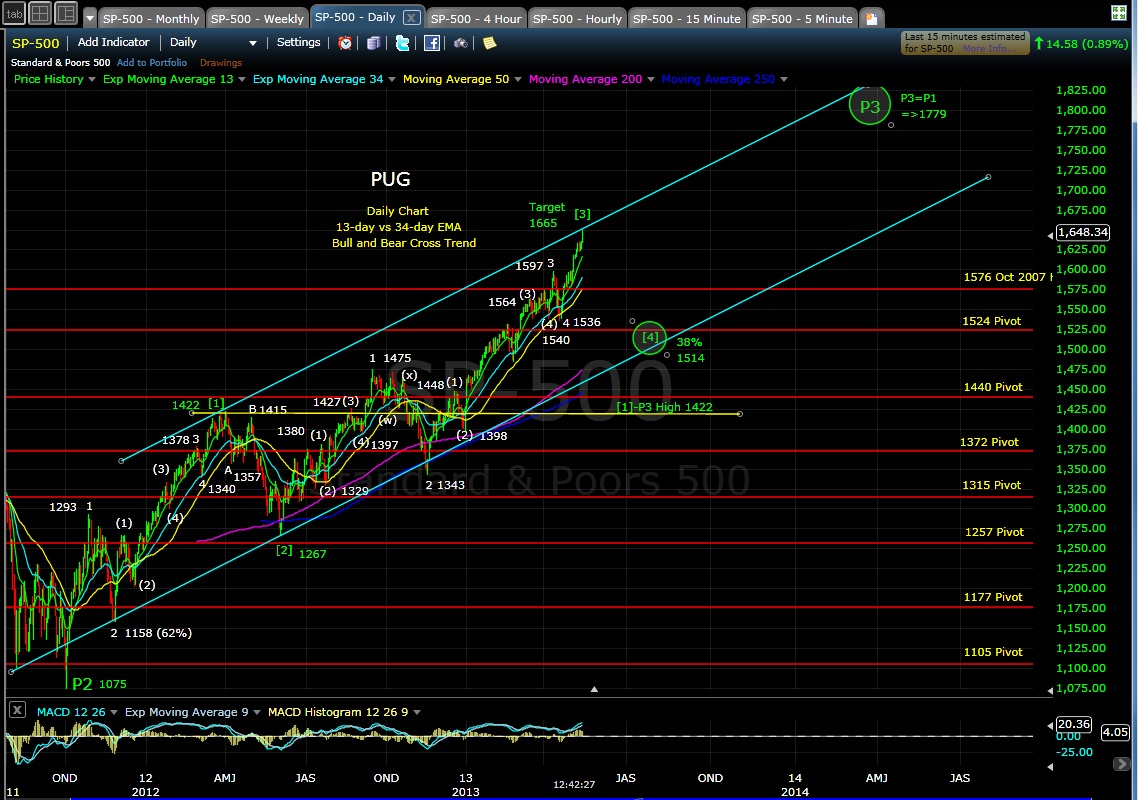
 5. By Pug’s EW a top should be now (and this is echoed in Alphahorn’s EW projections):
Source: PUGSMA
6. Using MRCI’s historic matching tool, 1987 is the closest mirror, which kept rising until October at which point it made one the biggest crashes of all time:
 Source: MRCI
7. To add to that, the lunar/solar eclipse configuration of 1987 which occurred prior to that crash matches this year but instead falls now in May-June, and this is the basis of Puetz’s crash windows:
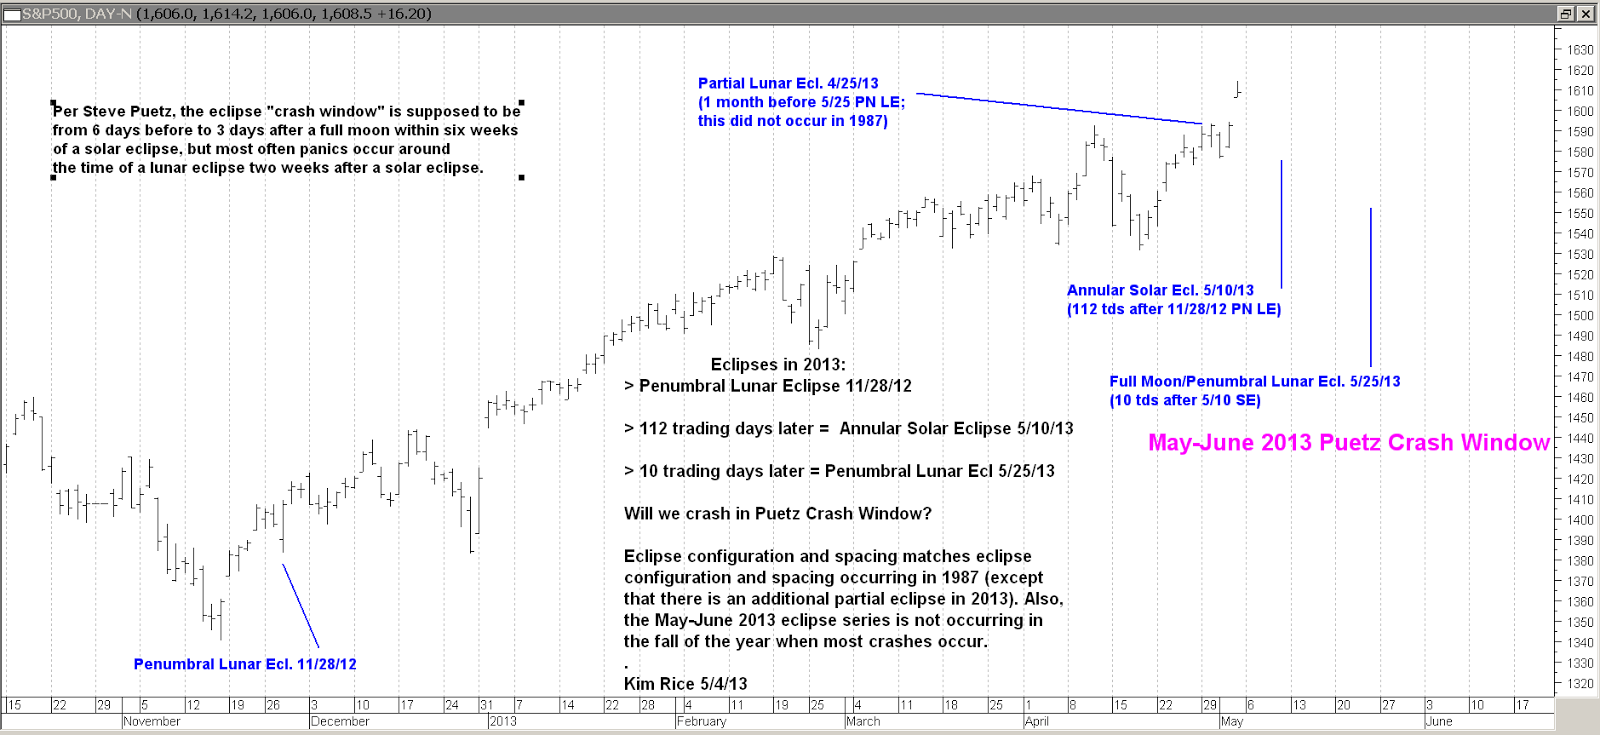 Source: Kim Rice
8. Gann Global draw out the closest historic rhymes as the 1950s and 1920s. The former suggests a retreat is overdue, the latter that the market can keep going until August:
 Source: Gann Global
9. The Presidential cycle echoes the projection for an August top:
 Source: Seasonalcharts
10. By my work, the closest historical mirror is 1946-7. Stocks topped in Q2 1946, with money switching from that point to commodities. With a normal lag in feeding through, inflation took off as of July 1946 and was elevated for 2 years from then, through the solar peak of May 1947.
 Source: Matthew Claassen
Note treasury yields reversed course along with stocks topping, and commodities took over. Note also though the backdrop to this was the lifting of price controls and the Fed reducing its control over the treasury market.
OK, it’s up to you to decide which of the above are valid, if any, as forecasts for a market top. I am not convinced by some, but it does no harm to round up and compare. But I’ll summarise like this. There are generally two types of tops, parabolic peaks that collapse down the other side, or topping processes that are rounded lasting several months. The move in (US) stocks is starting to be parabolic. If this continues and steepens – and some of the models have room for further gains into June, July or August, to allow this – then we might rather expect an ugly subsequent collapse once ‘everyone is in’. If on the other hand we see a pullback shortly and this turns into a topping process, then we can look for a range to be carved out near the peaks whilst internals, and leading indicators, deteriorate. Perhaps most usefully, all the models, bar none, suggest a top should occur between now and August.
Milton Friedman wrote a paper on investor reactions to the 1940s and 1950s government policies – which were similar to today (ultra low rates, interfering in the bond market) – and concluded that the rise in equities into 1946 was not considered durable by investors because of the government artificial supports. That would suggest the current rally in stocks may be on borrowed time, as there has been as yet no reversal in policy, and in fact recent global actions have been to double QE in Japan and drop interest rates yet further in various countries.

Hi John
You are an expert on statistics
Is there a chance that a rounding TOP is more likely?
An inverted “V” is soul destroying.
I have a different idea of when a TOP is likely to take place.
And its very scientific. My Uncle Albert said it was fine.
And it applies to all trading.
When the Top is out of the News , thats when it starts.
And a Top is very much on everybodys mind right now!!
So its not going to happen next week.
regards
Bob
HI John,
I have wrote about similar patterns to the past 18 years for the S&P (’95-’13) vs. similar action in the Dow Jones of the 60s and 70s.
I think this might peak your interest, if only slightly: http://positiveexpectedvalyou.blogspot.com/2013/05/a-story-worth-reading.html
Keep up the great work.
my momentum indicators say we should look for a ~5% pullback in SPX starting in about 0-5 days. But a higher high some 50 days after this top, and then a deeper correction.
6month solar wind cycle still allows a correction into June sometime, and the 4month planetary cycle has a low into June sometime. This cycle can be simplyfied as the Venus-Jupiter cycle, with ~4 months between conjunction/opposition, and the conjunction was on May 16. This produces strong tidal forces on the Sun, and normally produces a lot of sunspot activity and storms.
JAn 🙂
looks like short term momentum is still a bit high, suggesting maybe a short dip and last top in ~5 days…
Reblogged this on thedarklordblog and commented:
Lots of historical analogies as John does his homework.
you had a 17,6 week cycle? The Venus-Jupiter cycle is a couple days less…
Hi Jan,
It was me with a 17.6 week cycle http://www.17yearstockmarketcycle.com/
Thanks for the heads up on Venus-Jupiter, I will investigate.
Regards,
Kerry
On SP-500 we are on the move to the next Fibonacci Level.
http://stockcharts.com/h-sc/ui?s=$SPX&p=W&yr=6&mn=6&dy=0&id=p43035655412&a=297383782&r=1368998468862&cmd=print
Thank you guys.
I have expanded my Dow short this morning.
Other top indicators. Hochfield who is very good says Elliott is in a top area. Balenthiran says a big low this year. Wilder’s Delta calls for a top by fall. Kress cycles call for the 120, 60, 30, 20, 10, 8, 6, 4, 2, and 1 year cycles are all due to bottom in Oct 2014. Ed Carlson’s George Lindsay method calls for a top by fall. Mark, a commenter on this site, gave a link by annonomous showing the Grand Trine 3 major planets topping now and crashing for two years.
One last thing is formations. I will never forget the incredible ABC flat 4 the S&P made from the 2000 top to the 2009 low. It called for a rally to a new high. Gold’s 2008 correction was an abc sharp 4. This new high high as well as the new high on the Dow makes a beautiful formation called a RPW. TO complete the formation would be a close below May’s low. To the aggressive, a close below low of the week or even the day of the high would do it. This formation is similar to a head and shoulders or an Elliott 345 4 5. The QE FED has been trumping all this, so all this is a really dangerous trade.
Timing the top! Music to my ears! 😉
I posted some “fun stuff” in the comments section of a recent post of mine with some 1987 correlational overlays that you might enjoy. Starting here: http://highrevsopenhouse.blogspot.com.es/2013/05/looking-for-reaction.html#comment-897290154
Also, a nice article from Joseph Stuber over on Seeking Alpha that should get everyone’s neurons firing on all cylinders.
http://seekingalpha.com/article/1437121-the-bernanke-agenda-it-isn-t-what-you-think-it-is
John, for Bradley, the downward trend as a good example of what happened 2013/01/20 to 2013/01/29. Good to review behavior of markets at that time as baseline of what is to come.
Plan to get out since June 22nd is full moon, about a week before this around 2013/06/09. Fed meeting also around that time.
Still slowly working on using data from Jet Propulsion Lab for planetary positions and creating a multi-year Bradley with his formulas.
One other thing forgot to mention, companies utilizing an old accounting trick of stock buyback. Balance out debt loads to keep even heel on debt, credit, liquidity, etc. This will explain some of the behavior if enough companies execute buybacks.
Cheers wxguru
Please provide a link to the chart on Nowandfutures…unable to locate on the website…thanks!
> >
http://nowandfutures.com/daily_all64a.html scroll down a few charts