

Here is the lunar geomagnetic model for the stock market for 2013:
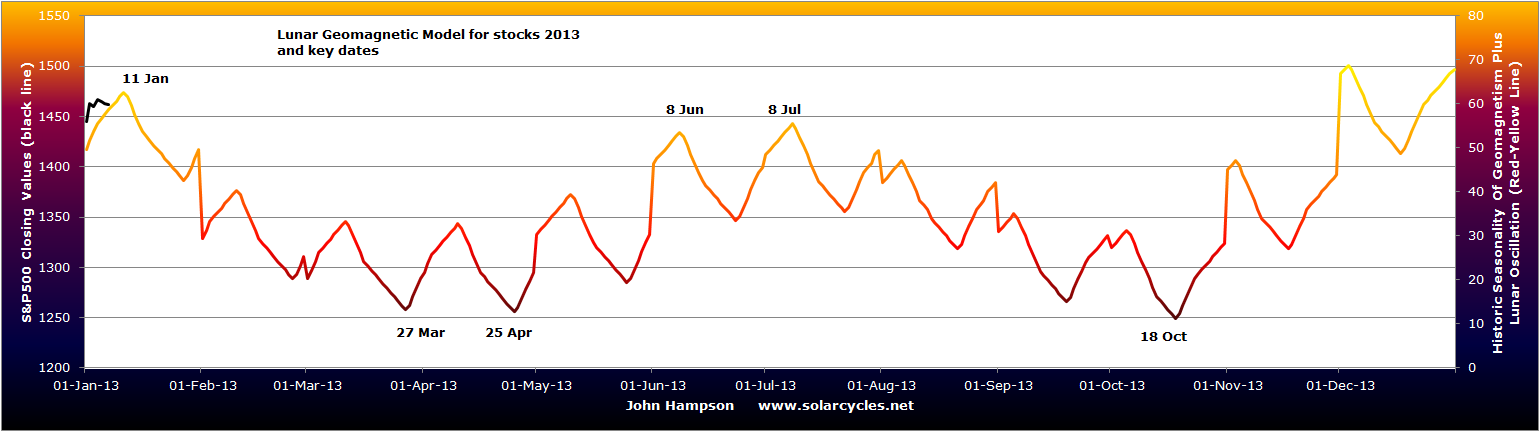 This combines the seasonality of geomagnetism with lunar phase oscillation. Both phenomena influence human sentiment and therefore market performance. The caveat is that some years are more ‘seasonal’ than others, and that lunar phase oscillation doesn’t work all the time, with lunar inversions also occurring. Nonetheless, the key dates are noted with a potential peak this coming Friday, a March-April low, a June-July peak and an October low.
Now take a look at Eurodollar COT as a lead indicator (by 1 year) for equities:

Source: NowAndFutures
There is a clear alignment with my model above: Jan and June peaks, March and Oct lows.
I have found Bradley turns too hit and miss to be a part of my regular toolkit, but for those hits when they occur, I like to keep it on the radar each year. Bradley turns are based on the planets, and it should be noted that whilst chart maps are built on them each year, the turn dates can be either lows or highs so do not actually indicate a path for the market, only trend change points. With that caveat, here is a siderograph for 2013:
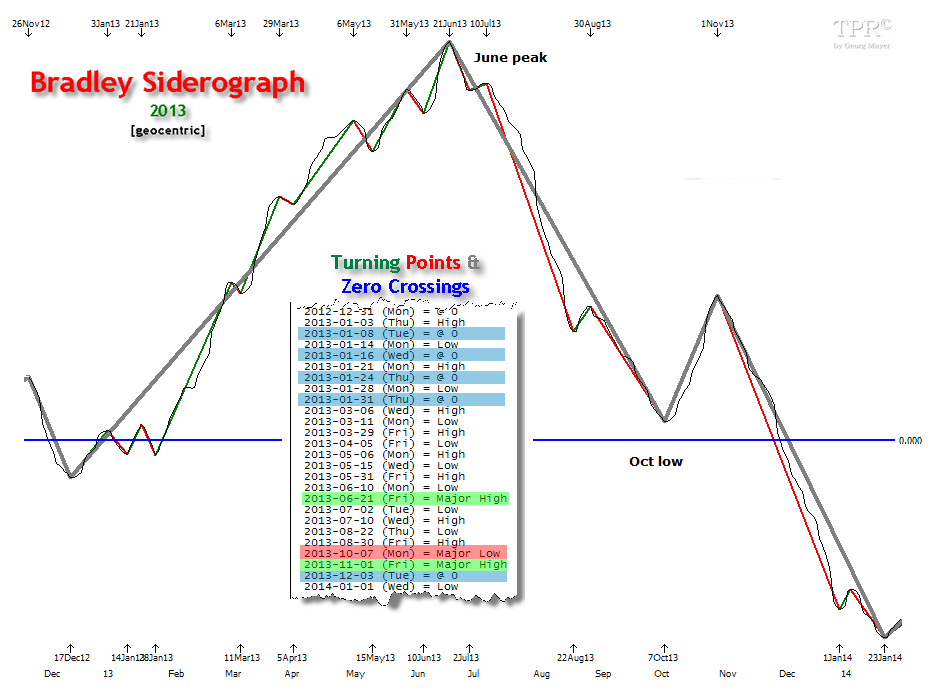
Source: Time-Price-Research-Astrofin Blogspot
A June peak and an October low again, but this time no low around March, just upward into June.
The 45 year cycle was brought up in the comments on my last post. I would argue that this is in fact 4 solar cycles, and suggested this when I reproduced this Dow Jones spectrogram in 2012 showing actual cycles in the Dow Jones. The peaks show real cycles around 11, 33 and 44 years, all approximations and multiples of the solar cycle:

Source: Sergey Tarassov
What perked my interest however was that in Dec 2012 I had shown a chart using MCRI’s tool that revealed 1967 to be the closest mirror from history for US stocks with a 90% correlation, and I now realise this is 45 years ago, which adds weight to the potency of the 45 year or 4 solar cycle repetition in time. The next chart therefore shows what happens next in 1968 with potential connotations for 2013:

Source: MRCI
Interestingly, similar peaks and troughs pop up: Jan high, March low, June peak.
Here’s one more. Presidential seasonality in the year after US elections looks like this:
 Source: SeasonalCharts
Spring low, Summer high, Autumn/Fall low. That’s five models in impressive alignment. But before we get too carried away, I suggest there is likely to be some repetition in the underlying for this range of models, namely common seasonality. By my research, the seasonality of geomagnetism is behind the seasonality of the stock market (see Seasonality section of my Trading The Sun PDF). The majority of years play out similar to the seasonal model. Therefore that overall theme of a Jan high, spring low, summer recovery and bottom around October time, is fairly common looking back at stock market years in history. But sometimes we get an atypical year. Geomagnetism may not follow the usual roadmap or technical and fundamental factors may blow the market off course. One potential such factor is that we enter 2013 with an overall pick up in economic data together with recent technical breakouts in certain key markets, both of which could inspire stocks to perform beyond January. Also recall that cyclical stocks as a leading indicator suggest a peak around March and a mid-year low – quite the opposite to the above:
 Source: PFS Group
However, we do currently see evidence of overbought and overbullish extremes in certain pro-risk markets, which could provide the backdrop to a January high. Look at the excessive optimism across the different US stock market sectors, with one obvious exception in gold miners:
 Source: Sentimentrader
Furthermore, economic surprises for the US appear to be rolling over, which could also drag back equities (although the lead time on that has historically varied):
 Source: Ed Yardeni
In H2 2012 I was on the look out for cyclical stocks bull topping indicators, including: a topping range process lasting several months whilst internals degrade; divergences in breadth and/or leading indicators; a spike in yields and inflation. We didn’t see them, so I remained long equities. Now, in January 2013, if stocks are topping, then they can only be at the beginning of a topping process, because we still do not particularly see those characteristics. That said, I am confident we will see a cyclical stocks bull top in 2013, based on secular/solar history, and it should occur by the latest at the solar peak (forecast for circa Sept 2013 currently). So a mutli-month topping process that began now and completed by mid-2013, would fit well.
Here is a typical example from the last cyclical bull top:
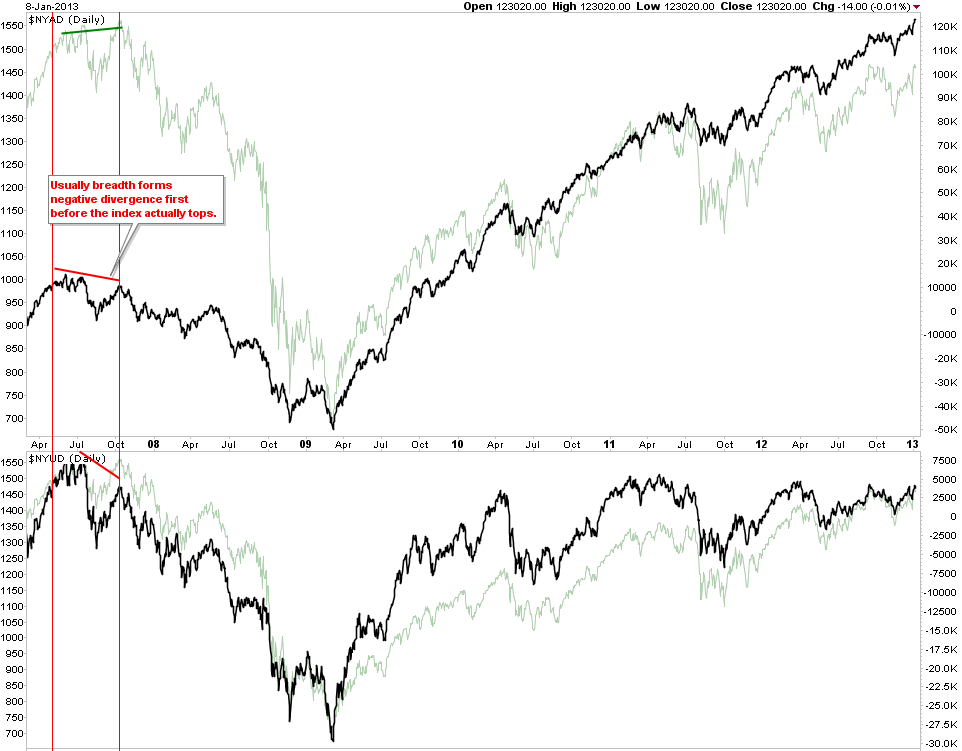 Source: Cobra/Stockcharts
Stocks made a high then a marginal new high several months later, whilst breadth diverged. There were two opportunities to exit stock longs, but the clues for the cyclical top were only in evidence by the second opportunity: the marginal new high.
So here’s a hypothesis. Stocks make a top in January 2013, as per the aligned models, followed by a pullback within an overall topping range process, then a marginal new high around June which bears the divergences of a cyclical bull top. Were this to come good, then that could imply that the first opportunity to exit stock longs would be imminent, possibly Friday of this week. One factor that could play into this is US earnings, which began yesterday with Alcoa. The season really gets going next week, and a ‘sell’ theme could potentially play out on an overall disappointing beat rate or outlook.
An alternative scenario would be that stocks continue to advance into March, as per the cyclical stocks model, with support from recent improvement in economic data, before the topping process begins and lasts through to the Autumn/Fall.
So what to do? I am going to mull this over but if stocks can rise further into bull/bought extremes by the end of this week, I may sell a chunk of long positions. Understand though that as things stand with my equity longs in tact, my bigger pro-risk weighting is to commodities. A concern I have is that if I exit equities I am very much dependent on commodities making a final secular push – a push which one would have to say is currently absent. So let’s have a look at commodities.
As previously noted, many commodities are currently suffering extremes of overbearish sentiment. That sets them up for a potential rally. Supporting this is economic improvement in China – the biggest consumer in commodities. Plus inflation expectations have risen of late, and treasuries have begun to experience outflows, both of which should inspire more money into commodities. All that said, commodities as a class remain without momentum at the moment, despite Gann forecasting acceleration would begin as of November 2012, and solar/secular history also suggesting commodities should accelerate over the course of the 12 months into the solar peak. Here is the current combined solar peak forecast – note that a pick up in sunspots over the last week has helped give the overall solar oscillation more of an uptrend look:
 In short, commodities should accelerate without delay, and start to outperform stocks. Precious metals should be the leading class. A long term look at the Dow-gold ratio reveals that equities are historically cheap compared to precious metals. Long precious metals at this point is therefore a play on a parabolic finale to extreme overvaluation. That may be a dangerous game, but history has fairly reliably delivered such a parabolic finale to a secular bull. There was some question last year over whether silver had in fact made that secular parabolic peak, by comparing it to the Nasdaq bubble:
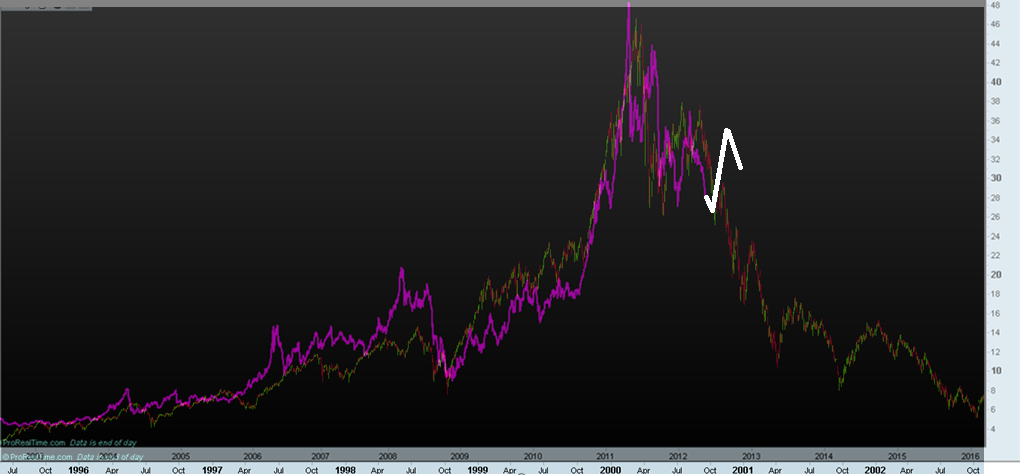
Source: Profitimes
I have added in white what happened since – and in the bulls’ favour it broke free from the analogy and did not collapse into the start of 2013. Gold made no such parabolic but remains range bound over the last year, neither confirming the bull or bear case. In short, I still maintain precious metals will go on to make a parabolic finale ahead this year, along with commodities as a whole, but right now it remains a position of faith. As we are in a multi-year transtion period from secular commodities and treasuries bulls and secular equities bear to the opposite in each, with equities cheap compared to treasuries and commodities, and commodities lacking in momentum, I have concerns about leaving myself heavily weighted to commodities making their finale, until we see that acceleration begin to occur. However, we may potentially be knocking on the door of that development:
 Source: Chris Kimble
This is what I am going to chew over today and tomorrow. If you have anything to add to this, please step forward in the comments below, as I welcome your input.

Some things I’m considering: this is the 4th attack on the 1460-70 area; 7 weeks completed of a vertical ramp in Euroland indices; rises in PMI and ISM- type surveys, but not so much actual perfomance or growth data; Barroso’s comment that the crisis is over, and that absurd platinum coin! 😉
Thanks for your informative presentation, John.
All good points, thanks
John
If there is a 45 year cycle correlation, we can expect the S&P to top early December 2013 then drop in a seesaw pattern to around June 2015 and then rise dramatically to April 2016. This scenario fits in well with the Decennial Pattern which means that years ending in the number 5 have been up years for the S&P since 1885. Also, the scenario fits with the presidential cycle which has the third (2015) and fourth (2016) years as strongest for the S&P. Time will tell.
Jack
I belive the decennial pattern to be a red herring (something I researched in the past) but bullish momentum in 2015 and 2016 certainly fits with my expectations, thanks Jack
You share similar view with Gary Savage (http://smartmoneytracker.blogspot.ca/). He believes that stocks will be making a new high this year, commodities and PM will begin their parabolic move as US dollar bottom (end of 2013/ beginning of 2014?).
Thanks. I used to follow him but gave him up. That is very much aligned though.
Hi John. Nice analysis as always. Impressive cycle alignment I agree! Looks like our respective analysis may be aligning as well. Everything I am working with, from cycles to market structure, suggests that the highest probability scenario is for a pullback and then a rocket shot. What do you think of this as a possibility for 2013? http://mediacdn.disqus.com/uploads/mediaembed/images/413/3890/original.jpg
I’m currently working on a post for this weekend entitled, The Case for a Pullback (range analysis continued), that will be a little long, but worth it I hope. I’ll be referencing this post as well. Good stuff!
Hope you all are having a great trip. Cheers.
Rev’s pullback/rocket shot scenario is similar to mine with pullback to start this Fri-Mon and rocket shot to begin upon a debt ceiling solution, probably in late-Feb but possibly earlier if a moderate to strong pullback incites political action. Looking for a spike top around 1620 in April-Sep with commodities, particularly ag and gold, extending another several months as per John’s theories. My current quandary is whether and how much to hang with my ag, gold, and general commodities during the expected upcoming stock pullback.
I read your post High Rev, thanks. An ‘overthrow’ is very much possible, as that’s normal by cyclical bull endings historically. The rocket shot you both suggest – OK, sunspots inspire speculation and risk-taking, the secular bull asset class is the main recipient for this, but all pro-risk can get a bid – so maybe. Commodities are usually a late outperformer – so first stocks go up then commodities catch up and overtake with stocks toppling over first – however we have had a fair period of that (stocks outperformance) over the last year. And the imminent pullback – I agree.
Interesting post. I think it looks like we might be breaking out after filling gaps in the indices with a top (cyclical pullback) as per sunspots. Very strong technical patterns. January is statistically a very strong month. Major spot forming with spots over 100 so probably some bearishness ahead in the moon cycle, but not selling my value stock positions until the spots actually speak. I have started option shorts on Herbalife http://factsaboutherbalife.com/. The stock is reaching overbought close to the head and shoulders neckline with fib confluence (looking for an AB to C measured move). The funny-mental story is always good stuff to have in the background. If I am lucky that scam may actually collapse.
I have no position in HBL but the cynic in me likes this bull argument: http://brontecapital.blogspot.com/
Good. I do not like to take positions when others agree with me. I only trade on technicals and never on arguments. I am most often wrong but profitable.
Technically strong I concur Robert
Although this interview is dated, I found it quite worthwhile (meaning I agree, I suppose), particularly as it relates to the guest’s comment on where we are in the deleveraging cycle and how that determination impacts one’s view of the direction in rates.
http://macromon.wordpress.com/2012/03/20/kondratiev-wave-30-year-bond-rally-over/
I consider short treasuries a banker. Just the timing, which is why I haven’t taken a full position yet, just a partial.
Fantastic post John, and some very interesting comments. Big news on oil recently. Oil production in US expected to jump 25% by 2014 thanks to shale oil, which will certainly dampen oil prices globally. A major move in stocks in February could easily stem from debt ceiling-related events but the Italian elections are also scheduled for February, so the Euro crisis could easily flare up again.
Perhaps we may see the FTSE MIB drop a little, as we had a crash when the UK went to the polls in 2010, as well as in Greece and France in their respective elections in 2012. However, this could easily not happen, given bond yields in Greece, Italy and Spain are on a downward trajectory, so the markets perceive them to be safer than they were this time last year.
Wheat and Corn prices have started to reverse the price rises we saw in mid 2012, so inflation prospects might moderate a little in the coming months. On the subject of PMs, American Eagle Gold coin sales fell 25% in 2012, but the Gold price finds itself rangebound as the army of sellers is counteracted by the just as large army of buyers. It ticked lower last week when the Fed said QE might end in 2013
Don’t overlook Cyprus elections Feb 17.
Thanks Pete. In short I expect the global pick up, particlarly the China pick up, together with the sunspot inspired speculation, to push commodities (and inflation) a little too far – enough for a tidy profit and then exit as the supply side is definitely catching up.
Great write up John. Lots of things to focus on. Analogs are interesting, also been focused on the analog of the Dow from ’66 – ’73 compared to the SPX 2000 – Current. Interestingly similar. Love the correlation analog chart.
One thing to focus on (imo) also is beta. I measure broad based beta through the Russell 2000 / DJIA ratio. Back in Q2 of 2006 the ratio hit a high (or as can be said, beta hit a high). We did not see markets take a nose dive until Q4 of 2007. The Russell did peak in July of ’07, however the Dow peaked in October 2007 (closing prices).
At the very beginning of Q2 of 2011 we saw the R2K / DJIA ratio return to the same exact level as we saw in Q2 of 2006. If all hold the same, we should have put in a high in the Dow in Q4 of 2012. So far, so good. On October 5th the Dow made a closing high. While the R2K has made new highs in 2013, the Dow has failed to do such, so time will tell here.
Just something else to keep an eye on.
Let me correct something. Instead of nose dive in 2007, we put in highs in price. Nose dive came later. In Q4 2007 is when the Dow put in it’s bull cycle high.
Thanks Ryknow. Plus the Nasdaq is the weakest, with the weak cyclical techs one (amongst few) bearish sign for a top.
John Thank you for putting time and effort
Thanks
Thanks, John. Some questions:
1. The Historic Seasonality Geo+lunar for this year matches to the 45 years cycle+-, but is a really fiable? Not last year, 2012. In 2011 no so bad, but the timing was awful, remember the summer11, the plunge before as expected.
2. I prefer yor Daily Geo and your Geo+lunar acumulat, daily models but as far I can see last year it pointed out a down-trend for markets, more than in 2010, or 2012.
How can you understand and how can you manage with these indicators?
Thanks
Hi Antonio. I believe I have enough evidence for the influence of geomag and the influence of lunar, so I can use them in my primary tool kit. But not alone. Nothing works all the time, whatever indicator or discipline. The models showing cumulative lunar geomag since 2009 have been a good guide, but when last year the SP500 and Dax pulled away, I drew in other disciplines to remain long (rather than take profits or short per the model). Last year was not so seasonal (geomag) but this year may well be, like 2011. Take away the models, and I have confidence that lunar phasing serves me well to time entries and exits, and geomagnetic storm occurences have a bearish influence when they come.
2010 or 2011, sorry
Hi John
Your Lunar Geomagnetic Model refers….
If this model is just 50% correct you will be as famous as Gann.
Tomorrow is the high for the year , give or take a few weeks.
But the million $ question , have you closed all your long positions?
Kind regards
bob
New post coming Bob…
It seems that, analysing in a different way, a few people have the 11th Jan as the high point in their model for the year. I do too.
But the current price is still well below my actual modelled price.
I agree Will. I wanted 1600 to be happy with an overthrow. Maybe we still get that by June time.