
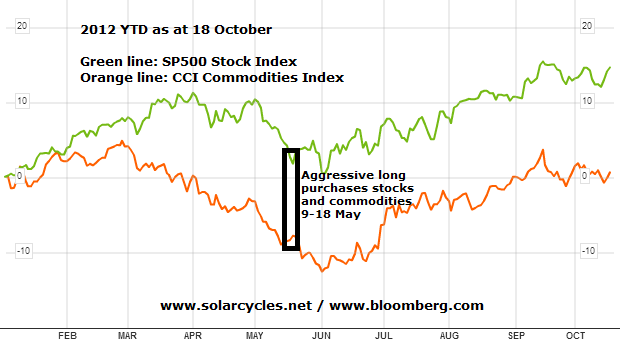
This is the main story of my year: aggressive buying in stocks and commodities in mid-May, and then largely sitting on the portfolio since then.

It looks straight forward with hindsight, but of course the hardest part has been staying put and resisting selling. Now the key question is whether we are going see further upside into year end, or whether the ‘sitting’ should be brought to an end before then.
Based on solar/secular history, the next top in equities should be a cyclical bull top. Based on cyclical bull history, we might expect an overthrow move as the ending move, and given we have just broken out technically in various indices around the globe we are in a good position for that to now occur. Equities should top out (cyclical top) before commodities (secular top), so timing the exit of stock index longs is the most pressing, I believe.
Cyclical stocks bulls have historically ended with a tightening of rates (yields). Too much money pours into pro-risk and out of safety, there is too much buying, speculation and inflation, until a tightening of yields, or central bank rate tightening chokes it off and tips the economy into recession. See here:

Source: Scott Grannis
We last saw this phenomenon when the last cyclical bull ended in 2007. So the question is, has QE and central bank interference broken this mechanism, or are we headed for the same this time round, namely an overbubbling of growthflation and speculation, before we top out? By solar/secular history, we should indeed be heading for an inflationary and speculative finale in 2013 (analysis and evidence here), so I believe this is going to occur. As yet, we don’t see a particularly strong uplift in inflation around the world, but as per that analysis I believe it is coming, and nor do we see excessive froth in pro-risk or a hasty exit out of bonds. We just see tentative evidence of reflation and so I believe the process has some way to go yet before we enter the likely zone of a cyclical equities top. To support this, we do not see the usual cyclical topping indicators yet such as breath divergence, evidence of distribution and a rolling over of leading indicators.
Those who I read who are largely in tune with my view would include the Puplava brothers and Scott Grannis, whilst those on the other side include Marc Faber and Tiho. Marc Faber has been gradually selling out of long positions and moving to cash since May/June time. Because he has been on the wrong side of it for some months now, I believe he has got it wrong for once and was wrong-footed by developments. I believe the same of ECRI and Tiho who also diverged around the same time. I am going to address some of the points that Tiho makes in this post, so I’ll start with evidence that there is historically low levels of money in cash, as a contrarian indicator to get out of pro-risk.
Reducing interest rates to negligble or zero discourages money from being held on deposit. QE then brings down bond yield rates to negative real levels, including the longer end of the spectrum. This discourages money out of bonds and also is currency-devaluing, which further decreases the attractiveness of holding cash. In this environment it is therefore normal to see historically low cash levels and money market fund flows. Because currencies and bonds have international markets, central bank actions in rates and QE have global affects, producing bubbles in assets and pockets of inflation as we have seen over the last few years. Rare earth minerals are a recent example:

Source: Scott Barber
What rate cuts and QE cannot do is directly bring about economic growth or hiring or lending or consumption. However, they reduce the systematic risk and provide an environment that as far as possible encourages money to be put to work rather than held on deposit. In fact, much of the new money through QE has become banking reserves and is not being lent out. The increase in money supply is balanced by the decrease in money velocity. The US Fed and others are continuing with these measures until they see money circulation pick and growth take off in an enduring way. The risk is that they are pressing on this accelerator for too long and could see a sharp inflationary episode ahead as too much of the new money gets lent out or too much money is chased into hard assets in a low-yield environment.
I do not share the view that central bank actions are impotent, and that once this is recognised the markets will tank. If I am correct in that, then the recent succession of rate cuts, the renewed QE and other 2012 stimulus measures (such as China infrastructure programmes) should produce a global reflation, and I believe we now see evidence that this is occurring.
1. Both the Shanghai Composite stock index (green line) and the Baltic Dry Index have broken up out of falling wedges. Still tentative at this stage, but promising.

Source: Bloomberg
2. The Dow Transports has been catching up the Dow Industrials and shrinking the divergence.

Source: Bloomberg
3. Inflation expectations have picked up.

Source: Scott Grannis
4. Stock market breadth is strong – there is no negative divergence.
 Source: SeeItMarket
5. Economic Surprises for the G10 nations have trended up into the positive. Emerging markets are trending down but there is some evidence in leading indicators for improvement ahead.

Source: Citigroup
6. Credit markets have normalised.

Source: Chris Puplava
7. US fundamentals have turned up to follow stocks upwards and resolve the divergence, and they echo improvement in ECRI leading indicators (ECRI WLI growth is forecast to rise again today).


Source both: Ed Yardeni
8. US SP500 earnings so far this season have come in at a 64% beat rate, and show marginal earnings growth year on year. Whilst earnings are not very impressive, the expectation was for negative growth, which so far has not been the case. Google’s report was bad yesterday and dragged down the Nasdaq, but the overall earnings picture has not been so troubling so far. One chart that regularly pops up (in Tiho’s analysis and many others) is this one below, that suggests US corporate profits should come down a long way and mean revert to the historic average importance to GDP.

However, the chart is a red herring because globalisation and the world dominance of multiple US behemoths mean the relation to US GDP is now different. Comparing these global US giants to global GDP is a fairer reflection.

Source: Scott Grannis
9. Global trade may be about to turn up based on global PMIs. This is again tentative but promising.

10. Below top is how the latest Conference Board global leading indicators stand, and beneath that is the table as it was at the end of August. There is a notable improvement across the board, and whilst Japan and Korea are still negative, even they have improved.


Source: Conference Board
11. The combined picture of output, real money and leading indicators in Euroland and China also suggests an upturn.


Source both: Thomson Reuters
I therefore refute assertions that the global economy is deteriorating and that China is heading for hard landing. Whilst both those things could occur at some point in the future, the current picture and near term future show a global economy tentatively reflating and a stabilisation in China rather than an accelerating decline.
Turning to equities, Tiho suggested that the risk-on correlation between corporate bonds and stocks means that an imminent burst in corporate bonds (which reveal excessive inflows and historical pricing) could spell trouble for equities.
Excessive inflows into corporate bonds reflect excessive pessimism in relation to equities. That excessive pessimism can be seen in equity yields recently diverging. I expect that yield gap to be corrected by flows out of corporate bonds and into equities. I don’t subscribe to the view that flows out of corporate bonds would have negative implications for equities – I rather believe they would be a recipient. Corporate bonds are at the end of a 30 year bull market like treasury bonds, rather than in a decade long secular bear like equities. The yields chart below shows this (inverted).

Source: Scott Grannis
Treasury bonds are potentially making a rounded top (yields a rounded bottom), which by Gann is predicted to be the secular top, and based on internal secular history should be the start of a multi-month decline (or advance for yields). If so, that would again be supportive of the normal unfolding into the cyclical stocks bull top as outlined above.

Source: Stockcharts
Neither of the two most widely-followed US stocks sentiment surveys are indicating excessive bullishness currently. Both these should reach bullish extremes to end the cyclical bull.
 Source: Schaeffer Research

Source: Bespoke
And here is Credit Suisse’s global risk appetite updated. Currently around zero it is very neutral, and I would also expect this to reach into the upper extreme in a pro-risk inflationary finale next year.

Underlying Source: Credit Suisse
All things considered, I believe there is sufficient evidence of global reflation to support pro-risk markets, together with a lack of cyclical topping indicators in equities or broader risk excessive frothiness. As always, it’s a probability calculation and I will keep reviewing the technicals and fundamentals as they develop. Things can of course change quickly, but right here right now, I believe the evidence supports maintaining my pro-risk portfolio as it is and further ‘sitting’.
To finish today, a re-sharing of cycles evidence, prompted by Rick’s link. There are many financial markets cycles banded about, but we can verify which are real by spectrograms (for markets with a long enough history). These reveal the greatest concentrations of actual real cycles, shown by the blue lines in the charts below. The first chart is for the Dow Jones and reveals the most important cycles to be 3.5 years (Presidential cycle 4 years plus cyclical bull average 3 years), 9-14 years (solar cycles range from 9 to 14 years averaging 11), 19 years (your causal explanations welcome, readers), 33 years (3 solar cycles or 1 lunisolar cycle) and 44 years (4 solar cycles).

Source: Sergey Tarassov
I suggest this provides good evidence for solar cycles operating in the stock market. It also refutes certain other supposed cycles.
Turning to commodities, here is a spectrogram for wheat. The main cycles are 9-11 years (one solar cycle), 33 years (3 solar cycles or one lunisolar cycle), and something ultra long over 100 years.

Source: Sergey Tarassov
Again, that provides good evidence for solar cycles in the wheat market not only being present but being more dominant than any other cycles.
We can cross reference this with other commodities by looking at long term charts of cattle prices and corn prices with solar cycles and we can see that pattern of price spikes in both every third solar cycle, or one lunisolar cycle, as per my work on my site.

 Source: Sergey Tarassov
I did not choose solar cycles to be dominant in my work, but rather, the evidence led me there. If there are cycles in the market, I want to see statistical/data evidence for them, and scientific or logical reasoning. I do not agree with the approach of those who suggest there are cycles in the market but don’t provide a reasoning as to why. With solar cycles, there is both the evidence for their presence and dominance in stocks and commodities, and the scientific reasoning as to why: the biological impacts on humans and their subsequent behaviour in relation to risk-taking, speculation and sentiment.

Solar cycles are the only thing I can gleam from a 19yr cycle. All I could find was that if the latest solar minimum occurred around 2009, there would be one taking place between 2018 to 2023, but then more significantly the next minimum would occur by 2027 onwards, marking about 19yrs since the 2009 minimum. Just a guess, but it was the best I could come up with.
Another thing that may cause this 19yr cycle is demographics, as a new generation of people are born roughly every 20 or more years apart,, but if we’re talking about developed countries, generational cycles may be closer to 25-35yrs. In developing ones however, the gap between generations would be smaller, closer to 20yrs of age, as childbirth happens earlier in life, and so 19yr cycles, particularly in wheat could be from developing countries.
If there’s already a 19yr cycle for crops from a growing developing world due to demographics, solar cycles could magnify the price fluctuations. Again, just a guess, but done my best.
Appreciate your thoughts
Hi John, Your posts are truly valuable, particularly in the current environment when you are at odds with Tiho. It is very refreshing to have a respectful debate of opposing points of view which forces me to be much more critical in my own thinking rather than relying on a passive reading of what is in front of me.
I recall a somewhat recent post of yours, probably in September, which had various Gann projections in it. I could only see the second half of the month in the archive (maybe just missing a scroll) but I was wondering if you could point me to that post?
One observation regarding the interest rate cycles that precede and precipitate recessions. The Fed (and maybe the ECB, Exchequer, etc) are in a box. They need to keep rates low from a fiscal standpoint because any rise in the cost of deficit financing will be very problematic. I would guess that they are slow to react or maybe won’t react at all to rising inflation. How this plays out in bond markets will be very interesting but I don’t have any idea what that scenario will look like. There are a lot of unconventional and speculative possibilities to consider. One example might be high quality corporates trading at lower yields than treasuries and every model out there that uses a risk-free rate needing to be retooled when assessing WHAT is the risk free rate. The dollar is the other variable in that puzzle. Policy makers seem logically willing to sacrifice their currencies as the path of least resistance toward debt debasement and de-leveraging. How that gets turned around in conjunction with a solar peak 12 months out is a mystery to me. My only take is that it would require a Romney victory and a new hawkish Fed Chairman in 2014.
Thanks for sharing all of the great work. Let me know if you recall the Gann post.
John
Many thanks.
The Gann post: https://solarcycles.net/2012/08/16/roundup-3/
The rates dilemma. I foresee a very gradual rising of rates once growth and inflation is embedded, like following the 1940s:

Low but rising would keep debt servicing OK whilst being in a trend which would be consistent with killing off the gold bull, per the 40s.
Interesting, they did have SP peaking this month, presumably Oct. 26th by the looks of it. Yesterday probably rattled some long side cages. Your own ideas have been a fourth quarter peak. My kids always ask, “Are we there, yet?”
Very recently, Mervyn King accepted the possibility of ignoring a 2% inflation target for a while, so I guess they are of the opinion that a bit of inflating debt away will be ok, and they will only step in to raise rates if personal incomes are being eaten away by inflation too much. Trouble is, real wages have declined constantly since 2008, due to poor wage growth and high inflation, which I imagine is the cause behind this double dip recession.
They did nothing when inflation hit 5.2% last year, and in fact loosened policy through more QE. My guess is they will only act on inflation if it exceeds 5% for a prolonged period. They probably did nothing about inflation in 2011 because most of the inflation would was attributed to tax rises which would drop out of the figures within a year. Until we see high inflation which is unlikely to lessen, they will be reluctant to tighten or else we risk a Japanese deflationary episode.
I’ve found Google Trends is the perfect tool to notice what might be happening with assets, I typed in “oil price” into it and peaks in search volume correlated to a major secular moment in oil, so I guess that’s the best way to check up on what the collective is doing and what the future direction may be for an asset.
I find it interesting that the closest historical mirror is the 1940s yet there will be no-one trading or investing now who was active then. Reminds me of the war cycle – that the gaps between periods of major war in history are wide enough for everyone involved in the previous one to have died off, to enable the same cycle of actions (or mistakes) to be repeated.
It’s an encouraging sign though that the debts we have stacked up over recent years are as a result of actual borrowing for personal consumption as opposed to the 1940s, when debt was accumulated from the world tearing itself apart in the bloodiest war ever. Each crisis and subsequent boom involves some kind of lesson being learnt.
The increase in life expectancy will lead to people being able to impart information of days long gone more than ever before as well, so I guess this will make learning lessons from the crises of the future easier than before. An example of this would be that Japan’s lost decades have had so much coverage over the last 20yrs that should another country find itself in Japan’s position, it will handle the situation to avoid stagnation.
John, could you update the US Citigroup Economic Suprise Index? Thanks
I can’t get it directly any more. Latest reading I have is third chart here:
http://soberlook.com/2012/10/intrade-and-electoral-votes-still-show.html
Thanks
By the by, the chart of Investors Intelligence is similar to the end of 2007. The structure the cycle from marc09 is minor bullish, but the structure of the chart from 2002 and from 2009 is so similar. I point now in the end of 2007.
I always wonder how deep and profound knowledge You must have to produce such amazing analysis. I want to be honest… I try to learn Gann, so some facts are clear, but dependence on so many facts… You must be a brainiac 🙂
Thanks. I believe solar cycles to a large degree underpin Gann, as the mirrors in time occur due to the real cycles.
Great analysis as usual.
What I want to point is that treasury yield curve may lose its predictability of recession due to Fed intervention and environment with extremely low interest rate. For example , 1937 recession occurred even interest rate was very low.
Thanks
First of all, before I even start, it needs to be said that John writes great posts which clearly not just I, but a lot of others enjoy too. They are very detailed and show Johns great in depth of knowledge.
Second, being at odds with me should not be that important. I am not a very good trader and I just follow basic simple fundamentals. Many other traders follow cycles and solar effects and Elliot wave and swing teading and computer systems etc etc. I am not that good. Also, I think John is a very good trader who I have been following for awhile and I am a big fan of his blog (as I always post here). He is much much smarter than I am, so you probably shouldn’t worry about what I say and think.
But basically, in a summary, I have turned bearish around late July and have written many posts on the economy and stock market explaining what my view is quite clearly. These have been warning posts as the way I see it. Without writing too much into it (people interested can read my previous posts) I believe the market in the US is topping right now and will start discounting a recession / drop in earnings and margins into next year and possibly ever year after.
Im not just taking the talk. I have pit my own and my clients money in my hedge fund out on this view. I started shorting majority of positions around early to late August and into early September. I’m short US cyclical sector stocks like Tech, Transports etc etc. I am also short Apple as of late August. There are other short positions I have. Majority is on my blog. Also, I am not a super, perma bear either. I am long Agriculture, Precious Metals, Japanese Yen. My largest fund position has been and still is long Silver for a long time already.
Basically I think Johns forecast is overly confident and too optimistic with him seeing only limited downside. I think it will be wrong. I think he will be shocked and surprised how bad things will get with the Junk Bond market, with the Eurozone Debt, with Chinese property etc etc. If I was only slightly bearish, I would never engage into short positions because I haven’t shorted stocks since 2008. I hardly ever short unless I believe something is overvalued.
Either way, as already stated, regardless of what I think, the market will show us the way. And furthermore many respects to John for even considering my view point. Good luck to all and I wish all of you a lot of profits in your accounts. *smile*
That’s appreciated Tiho. I value your detailed analysis and charts.
I agree with Tiho, from other point of views, the historical charts of DOW JONES, i expleined yesterday, as other days the universal inex, now DOW and look the long frame of Investors Intelligence, the strcture of it, and the older one, that is forgotten my the majority. A lot of index, charts of fundamentals, but the are delayed most of time.
I´m in markets almost from a child and for me 2-3 years up in this mini-cycle from 2009 is compelted, should be completed 2-3 monthes ago.
I apreciatte, John´s work and i think he takes this cycle like a basic cycle.
John,
I believe that your post states that equities should top out (cyclical top) before commodities (secular top) top out in an inflationary and speculative finale around June 2013. However, I feel that the eight months remaining before we reach June 2013 may not be sufficient time, in a normal course of world events, to reach an inflationary blow out top in June 2013. So I am wondering if there might be another catalyst that may accelerate an equities top in the near future and a commodities top around June 2013.
For example, one commentator has stated for several years that according to their interpretation of cycles that a war will occur at the end of 2012 or beginning 2013. If such a scenario occurs in the mid east, the war may act as a catalyst to quickly drive down stock prices and drive up commodities. If this occurs, it is my opinion, that the timing would be shortly after the USA presidential elections. In your previous posts, you have mentioned a possibility of unrest in the world related to solar cycles. Does your interpretation of cycles include the possibility of war within the next few months?
My timing for the inflationary and commodities top is currently the last six months of 2013, based on the average of current solar peak forecasts and solar/secular history. If Nasa are right and the solar peak doesn’t occur until around Sept 2013 then the inflationary/commodities peak could stretch out into early 2014. So there may be more time.
However, escalation through war is very much possible, as there is a correlation historically between war and protest and solar maximums (in the 3 years around the peak). I have previously written about the likely increase in the food price index ahead and how that initiated many of 2011’s protests and revolutions, and also about Iran’s now hyperinflation which could be the spark for conflict in that region.
Jack,
I don’t quite know what will trigger a major decline in the market, war, US downgrade etc, but cycles suggest after we see a trough around elections, we will attempt to make new highs. Some indexes may make new highs, and some may not, like the tech sector, causing bearish divergences. We could most likely see a top in the market in early January when there is a critical reversal period.
After that there are cycles that suggest we will see a considerable drop in the market between January and March of 2013, and then further into 2014, possibly into Q3. I have a target of Dow 8,000 to 8,500 when said and done.
I think that this correction may take people by surprise, they will be expecting the market to continue up into second half of 2013, but that will not happen. In this case PM’s would experience some difficulty. There is a probability that PM’s could make lower high’s by January, and in that case we could see them fall along with the markets in a total “risk off” environment.
Please be aware of the these cycles. As everyone knows here, sentiment can change on a dime and that is when cycles take over no matter what the economic conditions may be. I wish everyone luck!
Recently I bought a Strusctured Note that pays an interest rate of 7% betting aganst Stoxx 50 (currently at around 2,500 level) not dropping below 1,800 (the level not seen since the low in 2009). Quess what? I was the only one among my friends who dared to place this trade…….so either I am a fool or perhaps people are still so bearish that they think the “generational low” would be broken again.
My plan. The day (if ever) I stop getting paid (the monthly interest ) is when I start buying the Stoxx 50.
Fear is to be attacked.
Sounds good to me.
no to be overly pessimistic here but there are some really bad scenarios out there.
Basically John got it partially correct IMO. Yes we will see inflation .. but only in essentials i.e. Food and energy. This will be due to currency crisis, bad weather, food shortage and conflicts. The rest i.e. non essentials will deflate badly. Will this hyperinflation in essentials coincide with solar peak – i do not know and it does not really matter. the point is the days of cheap food and gas are over, especially in the US of A. The store of wealth – gold bullion is to be used for preservation of wealth only.
Stock market? Its been a playground for just big boys, regular folks will not go back in. especially considering the scenario above. Big boys who are not on the inside info loop will get burned. When hedge funds start going belly up – you know that game is over.
How much time we got left? Not sure. I hear dates like Aug 2013 with cut off date – june 2013 by which you better have your funds out of paper and out of all bank/brokerage accounts.
Good luck to all of us, folks. We’ll need it.
On the 25th anniv, of the 1987 Crash, it is timely to quote Jim O’Shaughnessy “…….The decade ending February 2009, for example, saw an annual, inflation-adjusted loss of 5.9%, the second-worst 10 years since 1871, which led to the conclusion that the probability of excellent returns going forward was high. So far, the market has delivered a 22.8% three-year annualized return from that point, and I expect attractive five- and 10-year returns through 2019.”
Please read this if you want to be an investor::
http://www.marketwatch.com/story/stock-crashes-are-money-making-opportunities-2012-10-18
John’s prediction is illustrated by his “pentagon:.
A few scenario’s here (some already discussed):
A rising stock market due to inflation means real economic growth/ improvement with real demand. Show many any scenario where artificial or manufactured demand has held its weight for an extended period of time. Reminds me of penny stocks… pump and dump…
A flat market may occur if we can just keep this sluggish Japanese-like pace for the meantime with relatively low inflation in ALL categories (that goes for you too food and energy).
Let’s look at when inflation is a negative (since some seem to think its only a positive for markets):
1. Continued rising commodity prices in a stagnant wage/ high unemployment economy. This won’t affect earnings at all because NO MATTER WHAT companies can always pass off rising cost to the consumer right? /end sarcasm
2. Dollar devaluation at a accelerated pace. Yes, because US corporations have tons of cash on their balance sheets and will affect company values. This isn’t Weimar folks. If US corporations cannot properly deploy this asset in a timely manner, especially if they are US centric, how do you figure this will drive up equity prices?
3. The multitude of potential systemic shocks. They have been mentioned by others already and don’t bear repeating.
For the long-long term, demographics. And that’s the end of that story. Good luck and have fun!
There are major bull trap warns on a lot of critical stocks as well as stock indices. For example, Nasdaq broke above the March 2012 highs last month but failed to hold and has now sharply reversed. Darling of the investment world, Apple also broke down in a bull trap, just as everyone starting coming on CNBC predicting $1000 plus targets. Furthermore, consider the following.
US equity internal breadth recorded its first 90% down day (90% down on AD breadth and Up/Down Volume) since June of this year. When 90% down days occur near intermediate bottoms, like in June, it could signal a possibility of a short term wash out and a rally. That is what we got. However, when 90% down days occur near the top, as S&P was within a point or two of its bull market high, that could signal a trend reversal and intermediate top.
Also, rising volume near the bottom could signal panic selling and accumulation by smart money / contrarians, but large volume near the top could signal distribution by smart money / contrarians. I know for a fact that I’ve been selling against so much complacency, not that my volume would make a difference. These tend to be classic and traditional occurrences seen near the bottom and top, if one knows what they are looking for. But as all of us say, one day does not make a trend.
Finally I will say this. John quotes II Survey as to measure sentiment, I agree with him that it is one great tool. But for me, I find it strange that John doesn’t seem to explain how the survey works in depth. I am not sure if people understand, but there are three categories in the survey: bulls, bears, and correction camp. According to II survey methodology, bulls are advisors who expect rising prices now and into the future, bears are advisors who expect falling prices now and into the future, and finally correction camp are advisors who expect a correction right now but rising prices in the future. That means two camps are long term bulls and one camp is long term bear.
So if we notice how bears in II survey have not risen for months and months and months, we can conclude that advisors have been moving from bullish to correction camp and back again. In other words, these guys do not see a bull market end after a 4 year run up of 111%, but merely just a pullback. And that means both of these groups still see RISING prices into the future regardless of short term. Not to many see FALLING prices into the future. If you add participants on their long term view, we have almost 75% bulls and only 25% for a long long long time. Weeks and weeks and months.
That is called complacency. So I don’t think anyone should be surprised to see Dow Transports stall for the whole of 2012. I don’t think anyone should be surprised to see Nasdaq breaking down from a bull trap. I don’t think anyone should be surprised to see Russell small capa breaking down from a bull trap. I also don’t think anyone should be surprised to see Semiconductors, leading indicator of stocks due to sensitivity of economic condotions, breaking down below 200 MA and entering downtrend already.
It is only when bears rise do we see a true capitulation and reestablishment of Wall of Worry concept, which creates rising prices and bullish conditions from a contrarian point of view.
All best to traders,
Tiho
http://www.oecd.org/std/leadingindicatorsandtendencysurveys/
http://advisorperspectives.com/dshort/updates/ECRI-Weekly-Leading-Index.php
Tiho and John.Excellent prognosis.I tend to agree with both John and Tiho.If i am reading it right then DOW still has some juice left perhaps a final upsurge towards atleast 13800+ levels before it breaks down into abyss towards 4-5k DOW.So in a nutshell i agree with john that there is some juice still left in the market and the market will trend higher atleast for a few more days or weeks and then the markets will fall like nine pins as Tiho surmises.
Some reading:The 10 key trends changing investment managament
Click to access RDV
http://www.facebook.com/pages/Teknisk-Analyse-TA-Business-cycles/168152833231786
The HSBC research is awesome! Many thanks.
John, it asks “could 2014 be another 1994?” ..exciting prospect similar to your view?r .
Thanks for you input and comments everyone.
Hi John,
I got some late comment
I was thinking about this 20 years cycle you see in spectrogram of yours. Regarding sun there would be ~20 years cycle in polarity of magnetic field. If sun-activity-lunar cycle is ~30 years there would be then sun-polarity-activity-lunar cycle of ~60 years
Take care and have fun traveling!
Excellent, thanks Pawel. Will look into that.