
A perfect lunar phase turn in the markets last week – up into a peak at Thursday’s new moon and then since downward. The downward pressure of forecast geomagnetism and into the full moon should persist until the end of next week. I expect to be sat on my hands until then, awaiting the FOMC output and monitoring developments in leading indicators, economic surprises, Euro debt and earnings. My thinking is that stocks will go onto to make a kind of second low in these next 2 weeks, higher than the June low and with a positive Nymo divergence. Meanwhile, I expect leading indicators will start to show signs of basing and ticking up, brought about by a natural upswing in growth, the drop in commodity prices in H1 2012 and the fresh round of global easing and stimulus. That combination would set us up to go make new pro-risk highs as H2 2012 progresses. So, whilst awaiting developments, back to the moon.
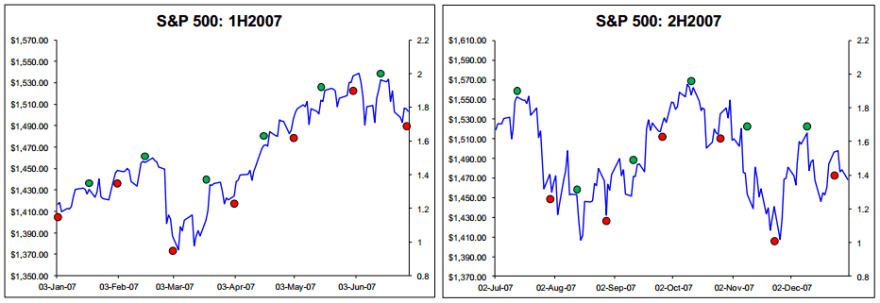
I trade the medium term, generally speaking, but use the lunar phase extremes to time my buys and sells. Thursday’s new moon reversal meant my sells captured the short term peak. Lunar phasing doesn’t always work out that well, but in my in-depth guide, Trading The Sun, I refer to 3 papers and my own chart demonstrating the compelling relationship that means overall lunar phases provides an enduring edge in the markets. I since liaised with Stifel Nicholaus and they did their own lunar research and shared with me. So here are their visuals showing the relationship between the SP500 and lunar phasing from 2007 to 2011, with new moons in green and full moons in red.


Source: Stifel Nicholaus

Interesting. Based on your paper, Trading the Sun, I have initiated a Lunar Cycle test of my own I plan on running for three years. Thanks!
Good stuff, John. Don’t forget Bradley says down for the rest of the year after this week. I reviewed silver back in the 70’s as to moon phases. In a strong bull the highs were after the new moon, and full moons were pauses. Opposite for bear mkt, and sideways (trading ranges) were right on. The next eclipse pair is in Nov
Kent, i also noticed that eclipse pairs are very interesting markers. What do you know about them? It looks like we get periods of weakness around eclipse pair dates in various markets. Metals last summer and last december were prime examples.
Hmnn, i thought bradley turn dates don’t necessarily mean direction, just a turn date…
I agree that the Bradley model is a more accurate predictor of turn dates, not so much in terms of direction.
With respect to the lunar phase model, it appears that occasionally the expected high or low inverts. This seems this happens most when the dominant trend overrides the lunar phase. Is there is some explanation for this other than observational?
Hi Stosh, I can refer you to a previous post: https://solarcycles.net/2012/05/22/cycle-inversion/ and the associated comments. Speculation though. Inversions occur as you say, but can’t find definitive explanation for it so far.
I have been watching Eclipse cycles and the Puetz crash window in particular. There does seem to be a market reaction around these times but it is not as specific as Puetz documents. The last once was May 2012 and the next one is November 2012
Thanks John for this post. A few comments…
1. According to some traders the lunar phasing is best synced with the tides, which occur a few days after the full and new moon. There’s a demo portfolio trading the Nasdaq with good results here:
http://lunatictrader.wordpress.com/performance
So according to this theory the ‘turns’ in the market will be a few days after the moons.
2. Another speculative point – I wonder if more volatile (’emotional’) markets such as the Nasdaq may respond better to the lunar effect? I remember that in the Dichev & James academic papers on the lunar effect was stronger in the Nasdaq than the S&P and Dow.
3. Breakouts – do you think breakouts from chart patterns are more frequent on the full moon & new moon. I have observed this myself, but would be interested in your thoughts.
Hi Rob, my experience is the upward pressure is into and around new moons, and vice versa, so not disimilar to 1. Point 2 is an interesting one – you may be on to something there – why would lunar-related feelings of optimism/positivity or pessimism/negativity inspire greater action on the Nasdaq? Perhaps because it’s been historically more of a leveraged equities play? Just a guess. I haven’t spotted your point 3, but the moon does seem to work better when we don’t have a strong bull or bear medium term move in play, rather when there is sideways action (which often then sets up a pattern and breakout).
man it’s confusing enough, why can’t you (they) at least make the new moons red in color (meaning stop, don’t buy, sell) and the full moons green (meaning go, buy).
This is a tried and true color scheme, used at a local intersection near you. Give it a try!
X-Class
I agree