
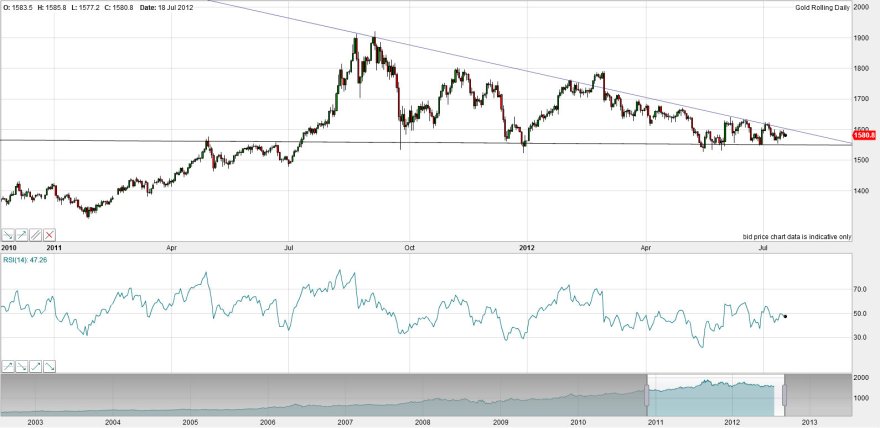
Measured in US dollars, gold is into the nose of a large triangle that should break one way or the other within the next 4 weeks:

Priced in Euros, the triangle is more bullish and gold is threatening the upper boundary:
 Source: Goldprice
The chance of an upward resolution is supported by extreme bearishness in gold, with the Hulbert gold sentiment index averaging -3.3 over the last 4 months which has not occurred since 1991.
 Source: Ned Davis / Hulbert
Gold miners bullish percent is also back to the extreme low:

Source: Stockcharts
Senior gold miners are also priced at levels versus their cashflow that are the same as 2008 and 2000:

Source: Gold Versus Paper / Tocqueville
Global central banks continue to be net purchasers of gold, with significant additions in H1 2012. Plus, the current round of further global rate cuts is ensuring negative real interest rates are maintained, which keeps the allure of gold for diversification.

Source: Tocqueville / World Gold Council
I reproduce below Casey’s chart showing the close relationship between food prices and gold. Since this chart was published, gold has made its 9 month triangle with a base at $1550, whilst food prices pulled back to 200 – again a similar move for the two. But based on the acceleration in soft commodity prices in the last few weeks, the food price index is predicted to make new highs in H2 2012, which should imply gold also makes new highs.

Source: Casey Research (my food price line extension and forecast)
I am long gold, and I am presenting reasons for an upward breakout. So let me balance that by highlighting reasons why gold could break down.
One is continued dollar strength and continued Euro weakness. However, the Dollar-Euro bullish trade is currently overcrowded. Extreme bearishness in the Euro, like the bearishness in gold, makes it more likely a mean reversion will occur.
Two is a big deflationary episode. If leading indicators continue to fall or sovereign debt issues escalate to new accuteness or China’s slowdown morphs into a hard landing then we would likely see no asset escape from the sell-off, as in 2008 when gold was sold off to raise cash against other greater loss making trades. However, the technicals above reveal that gold and gold miners have already experienced a washout similar to 2008 over the past 9 months.
Thirdly, if gold already made its secular peak in 2011 then bearishness in gold and miners is likely to be the new norm, with just relief rallies inbetween. In that instance, gold would make a decisive breakdown from the large triangle, followed by a series of lower highs and lower lows. For gold to lose its luster in that way, other assets would have to become relatively more desirable. Real estate is showing signs of rebirth in the West, so that’s one possibility. European stocks are largely in single p/e valuations, which is a second possibility. If money were to pour into real estate and equities then that would imply the Kondratieff Winter was over the the Spring had arrived. New secular bulls in equities and real estate would be underway.
Ultimately I can’t buy the idea that gold topped in 2011 for these reasons. One, secular asset bulls typically end in a parabolic blow off and then steep fall. Gold has instead coiled near its highs. Two, we haven’t yet reached the previous secular extremes in gold:stocks and gold:realestate ratios. Gold is relatively expensive to both, but not extreme. Three, gold demand versus supply is not projected to invert until 2014. Four, by solar cycles, gold should peak shortly after the solar maximum, which is forecast for Spring 2013. Five, by secular cycles, we should see a second and higher inflation peak 5 years after the last (2008), i.e. 2013.
Bernanke’s testimony yesterday decreased the likelihood of QE3. Whilst that may be a short term disappointment for gold, it doesn’t need it, due to global maintenance of negative real interest rates. Nevertheless, gold remains devoid of momentum and languishing bearish. What will trigger the triangle break? If nothing else, time is close to running out.

Thank you John for this take on gold. Do you have similar general opinion about silver as well?
Compared to gold it did have a blow off top in 2011 and crashed almost 50% since then. Gold silver ratio is in major bullish alignment with all big moving averages (50/200DMA) pointing towards higher values (~84?) (lower silver prices), this seems to suggest cloudy weather for silver at least and deflationary scenario in general. Do you think silver will disconnect from gold?
Gold made a big move up in 2011 whilst silver did its parabolic move. I expect the same ahead – silver to be a leveraged gold. In the shorter term though we might see gold start the outperformance, to give way to silver outperformance at the finale. Silver has extreme pessimism readings currently, so I don’t think it’s likely it will go lower.
Empirical me. So what did gold do in 1991 the last time the sentiment was this bearish, it went down. In 1991 Gold had rallied from 370 in Dec,1990 to 405 in Jan, 1991. It fell to $355 by Jun. It then had a 10 day short covering rally to its 200 day moving average, $375. Gold went sideways to down after that to a low aroung 355 in Sept. Rallied to $375 by year end. A rally to $1660 shortly would be similar. So far gold seems to have shifted to bear market rules. That is, oversold, extreme bearish sentiment, COT positions, chart formations like trianges, etc which predicted rallies for the last 12 years are no longer working. The most problematic thing I see to the bear case is if 2011 was the parabolic top, it really hasn’t had an appropriate crash like silver did.
Hi all …….I’ve written on gold today
Hi, John,
Prestonpartners seems to be kind of advertising site for Gravatars or whatsoever.
Personally I’m still very cautious until end of this month.
Hi Inge Christ
Sorry to correct you but my blog is not an advertising site in any way!
Will
Always good to read competing thoughts on where gold is headed, cheers guys.
Trades update:
Between 9 May and 18 May I was buying up oil, PMs, miners, agri, stock indices and shorting treasuries (see posts ‘Opportunities’, ‘ More Opportunities’, ‘Equities Update’, ‘On The Attack’ and ‘Capitulation’, and in the comments on those posts).
Since then, short treasuries are down 10%, oil, miners, PMs and Asian stock indices at breakeven, US and European stock indices up 5% and agri up 25% on average. Agri has really lifted the account.
The grains and cereals are back around their 2008/2011 highs: oats, corn and soybeans. Also around their secular highs are cattle and hogs. The likes of cotton, coffee, cocoa and orange juice have not accelerated like the others and remain some way from their previous highs. Also around secular highs are corporate bonds and treasury bonds.
Pro-risk in general has risen into today’s new moon, in line with normal lunar oscillation. As per my models, some downward pressure may now emerge the next 2 weeks, and I have accordingly pruned my overall pro-risk long position lightly around the edge today, leaving the bulk in tact.
The latest AAII sentiment reading shows 22% bulls. Here is link to a recent chart showing the last 3 years. You can see where 22% would fall to update the chart – lower than last year’s correction:
http://www.bespokeinvest.com/storage/AAII%20Bullish%20Sentiment060712.png?__SQUARESPACE_CACHEVERSION=1339092834808
I find it fascinating that it is so low after the three year run off 09.
US earnings so far:
66% earnings beat rate (62% historic average)
Only 42% revenue beat rate
i.e. earnings exceeding but more through costs savings than growth.
Excellent analysis!
Thanks Jahbulon.
I’ve been asked to clarify how much profit-taking I did yesterday – it was about 5% of my overall pro-risk position.
The fact that Corn and Oats recently made new all time new highs in this bull market – supports that the commodity bull market is not over – including Gold and Silver. I’m long silver, cocoa and sugar, since they have not made new all-time highs in this bull market yet, and are well below there most recent bull market highs.
Hi Justin! I also have been thinking it was a telling move in terms of the overall secular.
Thanks John.
I believe the seasonal Gold chart also supports the thesis of an upward breakout.
An alternative view is well presented here by commodities trader Peter Brandt, who argues that 80% of descending triangles break to the downside:
http://peterlbrandt.com/gold-is-going-to-1260oz-but-what-good-is-knowing-this-if-the-nfacftcfiafedsec-cartel-lets-your-broker-steal-your-money/