
Some glorious opportunities for those with patience.
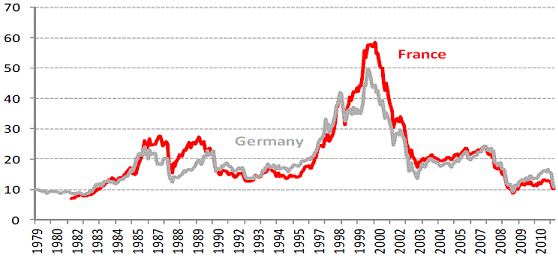
First, European equities. There are potential opportunities here for the brave in the Polish stock index (only European nation to avoid recession in the last 5 years, p/e 7.7, dividend 4.9) or Russia (oil price dependent, but if oil holds up, p/e 5.3 cheapest on the continent), but if we play it safe, then Germany remains an economic powerhouse, but has been held back by PIIGS worries. Germany’s p/e is at 11 currently, back at the levels where the last secular bull market began.

Source: Pragmatic Capitalism
German equity yields are currently 3.6, having reached even higher toward the end of 2011, giving us readings that have also marked great long term buying opportunities.

Source: Profitimes / GlobalFinancialData
The UK FTSE has a p/e of 9.8, into the single digit p/es that have historically marked secular bottoms, and is paying dividend yield of 3.7 – another attractive combination. If we look back at the history of equity dividends versus gilts yields, then UK shares are relative to UK government bonds as attractive as they were at the start of the 1950s, which was when the 1950s secular stocks bull market really got going.

The US stock market dividend yield also makes US equities very attractive to treasury yields, historically.

Source: Scott Barber / Thomson Reuters
Plus, treasury yields are at all time record lows, paying negative real returns. Treasury yields have historically made long term waves lasting around 30 years alternating up and down. The current down wave in yields is due to come to an end, giving rise to a long bear market in treasury bonds. This should occur as money flows back into equities and real estate in new secular bull markets, and as China gradually withdraws from its excessive treasury purchase programme.

Source: Scott Grannis / Fed Reserve
The global real estate bust since around 2007 has largely completed its course, with house prices historically tending to rise around 12 years and fall around 4 years. The table below reveals that US and Ireland, which both had major housing bulls, are now undervalued.

Source: The Economist
Affordibility for US housing has never been better. Coupled with the significant undervaluation shown above, US real estate looks a great longer term buy here.

Source: Scott Grannis / National Assoc Realtors
UK real estate is still somewhat overvalued, but topped out about a year after the US, so perhaps needs a little more time to bottom out. Japan stands out in the above table as the most undervalued, and in fact, Japanese real estate gradually lost around 70% of its value since deflation took hold 2 decades ago. An opportunity for the brave, but one that should again pay off handsomely in the longer term.

Source: Brain Cramps
To sum up, there are some great buy and hold opportunities for the longer term – high reward, low labour trades. The Dax and FTSE valuations and dividends versus bonds echo what I suggested in my secular position analysis that we should be looking upwards not downwards for stocks. The record extremes in treasuries, bond yields versus stocks yields and real negative returns equally reflect that we should be looking short government bonds not long. And finally, real estate in some countries, particularly in the US, now looks historically a buy again. Drawing all together I believe the future it clear – that we will see money flowing out of government bonds and into equities and real estate. For now though, echoing Scott Grannis’s thoughts, the markets are pricing in a Lehman style event in Europe, and hence the extremes. Anything not as bad as that is likely to encourage money flows the other way. That’s in a similar vein to my secular positioning historical analysis, namely that around this point in previous secular stocks bears, things also looked a mess and fear reigned, and yet equities barely made new nominal lows after that. As Russell Napier says, there comes a point whereby equities are so historically cheap that just slightly less bad news will propel them higher. With the German Dax back at its last secular lows in valuation, that makes it, to me, a compelling buy.

That is some great analysis John.
I remember when the AUD was one of the worlds most undervalued currency’s on the Economist Magazine global price of a Big Mac. (A very basic metric indeed!)That was 2002. 10 years later it is one of the higher valued currency’s now! But it has been a strong bull run and for those that had a buy and hold philosophy back then would have been a great success.
All the main indicators are indicating low valuations again for certain housing markets and most major equities indicies. Again back to the AUD being undervalued (it was like that for 18 months – 2 years) before the bull market really started to launch. So as long as the medium term fits the investment decision, some fantastic gains can be made!
Thanks Andrew.
You have to be really brave to put your money in polish stock I’m Polish and the situation is not good, from inside view everything might collapse after the Euro Cup, houses are double overpriced like in UK to earnings (70% drop should be healthy), deficit is growing like crazy, I wouldn’t put my own money 🙂 it’s like an accident waiting to happen, but the currency looks a bit better polish zloty to GBP you could short pound long zloty. For the short term you might be right but we will see.
Thank you for great article!
Great insider info, thanks Andrej. I wasn’t going to invest, because of a lack of such knowledge. I choose the safer Dax, FTSE.
I have been expecting the total collapse for last few years. It never happened? but it’s getting closer and closer, current government has been buying votes with spending money like there’s no tomorrow. I’m really impressed that it’s still in one peace, unemployment is getting out of control, banks lend money only on ID card without confirmations that you are employed, the law is that they can get on family members’ assets to grab for example your debt from your brother, sister, parents unlike UK. That’s total madness. Better wait after the Euro Cup to see what is going to happened I avoid Poland for some time even with visiting 🙂 I’m lucky that I live in UK I feel sorry for the rest.
Excellent post!
I only don’t agree with the real state in Japan, the prices go down only because of demography, too many houses for a declining population with no immigration, and the risk of a earthquake breaking them.
Thanks Dalamar
Great analysis as usual.
Cheers Phil
John I said it before and I’ll,say it again, you have lost your way… Look at your own models: SP500 still has a good 100 points to go down just to be on par with the model and DAX is only slightly below… Only the commodities index shows some opportunities and even thereI don’t see any reason to get excited until we have finished crashing. I appreciate your work and all but I’m getting the feeling that you’re getting way to impatient lately… Just my 2 cents…
I have sold my SP500 long position that I bought at 1300 into the rally today and gone short. It looks like it is going to close the month below my critical 1320 level and there is down pressure on my Equity model.
Major tops occur on peak boom earnings with peak PE’s making the mkt doubly overvalued (2000). Normal tops occur on discounted peak earnings (thus low PE’s) like now. Major lows occur on recessionary/bust earnings and low PE’s (6) not like now for the US but getting there in parts of Europe. So, a major low is due which leaves a lot lower prices possible if you cut and/or eliminate earnings and cut PE’s to 5-6. I’m expecting stocks to get as undervalued as they were in 1932 or 1974 or as undervalued as bonds are overvalued.
My buy-signal in SPX is still valid, and I was prepared for a double bottom some 7-8 days apart.

However I have got some bearish signals in Norway, saying we are at a crossroads and in risk of a collapsing wave. And we are headed for collaps unless we bounce strongly next days.
Here some analogies in weekly data
Jan,
Those analogies are very revealing, I think. At first glance, your average line seems to suggest a mildly bullish period is ahead for SPX. But looking through the analogies in more detail shows that SPX is actually more likely to break much more decisively one way or the other.
Those analogies showing a break upwards all date from the 1982-2000 secular bull market. Those showing sharp falls mostly date from the current secular bear.
Given that we are now approaching the final stages of the secular bear, I think your chart indicates a likelyhood of a significant fall…
Thanks guys for the quality comments as always, will address some of them in my next post – coming up.