The US dollar appears to be on the verge of breaking down, but it isn’t a done deal yet.
Source: Andrew Nyquist
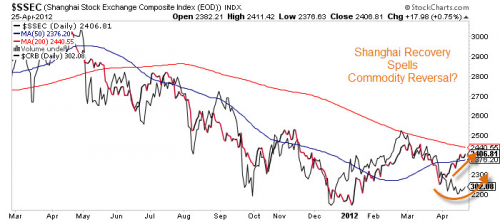
The Chinese stock index is on the cusp of a breakout. A Shangai breakout and a dollar breakdown would really give commodities some acceleration. However, no China break out either as yet, and a reversal into the triangle is possible.
Source: Bloomberg
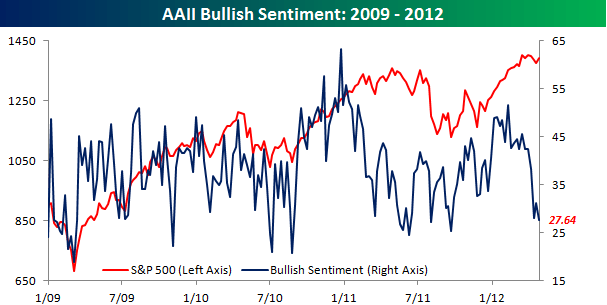
AAII bullish sentiment has really washed out, which is supportive for US stocks.
Source: Bespoke
European stocks are underperforming, and Euro debt continues to weigh. Spanish CDSs have eased a little, but only to just below record highs. I expect them to come again.
Source: Bloomberg
Economic Surprises continue to collapse.
Source: Bloomberg
Geomagnetism appears to have ebbed today, but 4 days of disturbance has tipped the model projection over to a slightly downwards bias, with particular downward pressure into next weekend’s full moon.
We have US earnings exceeding, a washout in bullish sentiment, and a double bottom on the S&P500 at the backtest of the 2011 old highs, together with a lack of major topping indicators at the 2012 highs, all supportive of further upside for stocks. Then we have collapsing economic surprises, Euro debt, and geomagnetism all exerting downward pressure. And we have the US dollar index and Chinese stock index both at crunch points.
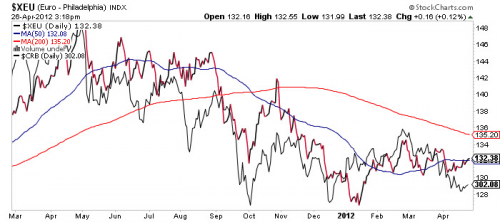
The combination of excessive pessimism in multiple commodities, higher sunspots which should encourage commodity speculation, and lagging in both Euro and Shanghai correlations as shown below, makes it likely commodities are about to perform.
Source: PFS Group / Stockcharts
If commodities are about to perform, then a breakdown in the US dollar and a breakup in China stocks would make sense, and those developments should in turn pull up equities too. But as yet we remain in the balance, and if we get movement the other way in the dollar/China, due to Economic Surprises, Euro debt, and/or geomagnetism/full moon then it may mean a little more time is needed. But to reiterate my expectations drawing together previous solar maximum / secular commodity conclusions, commodities should start to outfperform whilst stocks track overall sideways with volatility. I remain lightly long stocks and heavily long commodities.
On a personal note, Spring is here in the UK, and the outdoor pursuits are calling. I have a list of research threads to look into related to trading and the markets, some provided by readers, some of my own sourcing, but I expect to address them in the next off-season, towards the end of 2012. I fully intend to maintain posting and analysis several times a week, but additional deeper, original pieces of research are on hold for now, so if you put a suggestion my way, it’s on my off-season to-do list. The UK good weather season isn’t as long as some others, so time to make the most of it.


A very compelling analysis, as usual John. It does look ominous for USD, but I expect it will retest its breakout level over the next week…
Looking at the chart by Ching Cheh Hung you posted on 23 February, it seems that we may have just passed that dip in Venus/Earth/Jupiter alignment (and therefore sunspot number) – allowing a clearer run up to the C24 maximum…
https://solarcycles.net/2012/02/23/solar-cycles-and-astro-trading/
Thanks Mark. Norwegian Jan states there is a Earth-Jupiter opposition in May, and also a Venus-Earth conjunction, which in total should get the sun busy.
Hi John
I had a look at my planet-flux analysis.
It shows that Venus-Jupiter opposition has a bias for low solar flux (while conjunction gives high flux).
And the Earth-Jupiter relationship is more complex and shows three peaks of flux: one around conjunction, and the other two before and after the opposition.
I have not studied the Venus-Earth correlation.
So the conclusion here is to expect elevated solar flux now before the Earth-Jupiter opposition, and we just had a spike in April… the next elevation should be around August.
We do however have a special event in May, with Mercury, Venus, Earth and Jupiter all in line with the Sun (Jupiter and Mercury on one side, and Venus and Earth on the other). So that could be significant.
Jan 🙂
It is only one data point but for anyone long of Gold a few more sets of figures like that would be good. Dull to poor GDP(particularly since all the stimuli), and probably not high enough to get the unemployment rate down coupled with inflationary pressures. A long way to go,no doubt with more buying opportunities, but a start.
Agree Will. Plus, BoJ increased its asset purchase programme again and looks like the ECB will need to increase its balance sheet to deflate the Euro debt issue again. All a good environment for gold.
I know what you mean about the weather. I lived in western Washington state for nearly 20 years. The climate there is similar to yours, mild wet dark gray (and long) winters, beautiful but short summers. When the sun shone, you had to get outside!
Take it you’re in Arizona now Greg? Loved exploring that state.
Yes, how’d you guess? (you must have hiked Pima Canyon, a beautiful canyon on the southwestern slope of the Catalinas 🙂 I live in Tucson now, since 2008. Love all the sunshine and hiking that’s close by. I miss the North Cascades of Washington State, but I try to get up there every other summer for a few weeks during the very short hiking season in the high country (mid-July thru mid-September).
The daily chart of the $ does look bad, but my thesis is that the $ bottomed in 2008, made a massive 1-2 double bottom in Apr 2011. Then it broke out in Aug 2011. One more test of the 200 day moving avg ( just below 78) would be normal, getting everyone super bearish just before 3 of 3 of 3 really takes off. The SSEC looks like it is in C down from the 2007 top A down to the 2008 bottom and B rally to the 2009 high. The stock mkt looks and feels bullish but the transports are on a major Dow Theory nonconfirmation and a 3p&dh. So the markets look like they are at a critical juncture that could break big either way. My generally contrarian position makes me feel like I’m holding on by a thread right now.
Yes, even though it is breaking down from the triangle, the USD could yet rally from lower, per this chart from Springheel Jack. I therefore want to see it beneath the lower blue channel line.
http://www.screencast.com/users/springheel_jack/folders/1204/media/f08a21d2-a68b-4eb3-b4a8-090cc4d0758a
Majority of the global currencies have breached that 2008 low that you are talking about. Euro and the Pound haven’t while Aussie, Kiwi, Yen and Swiss Franc have.
The Dollar is not as strong as you think, because the DXY Index is distorted and heavily weighted towards the Euro – Chris Puplava constantly discusses this concept as well.
An equal weighted Dollar Index or a Trade Weighted Dollar Index have all breached the 2008 lows. Majority of the traders are tricked thinking that the Dollar has not breached into lower lows, but majority of global currencies either have or are just about very close to doing it.
Tom McClellan and gold……
http://www.mcoscillator.com/learning_center/weekly_chart/gold_repeats_a_prior_pattern/
Thanks John
US Dollar is not bottoming, but rather topping. I have been bearish on the Dollar since January of 2012, but Dollar bulls won’t have any of it. Majority still hold a view that the DXY Index is in an uptrend – but let me put forward some very interesting points I have noticed in the last couple of weeks in the currency markets:
– Aussie Dollar seems to be breaking out, despite recent low CPI readings and a high certainty that RBA will now cut interest rates
– Japanese Yen is in a strong rally mode, despite recent further easing by the BOJ and continuously growing BOJ balance sheet
– Awful European PMI data on Monday and a Spanish bond downgrade by weeks end, and what does the Euro do? Closes up strongly for the second week in the row.
– A super rally by the British Pound, despite UK entering its first double dip recession since 1970s.
It is very strange that the US Dollar is failing to rally with abundance of good news coming its way and the US economy outperforming its European counterparts.
In my investment experience, I have learned that financial assets price in or discount news / data ahead of time. When an asset fails to perform positively on constant favourable news, than most likely that asset has discounted just about all of the goods news and is ready to reverse the trend to start pricing in a changes in market conditions.
The Dollar has been making higher lows for 12 months now, as it bottomed in early May 2011. After a 12 month cyclical bull uptrend, the Dollar could be ready to resume its secular downtrend.
Tiho, you are absolutely right, Why has the $ been so weak considering the news about the Euro. This is of great concern to me being a $ bull. The explanation is the $ carry trade. Our idiot bankers, brokers, and hedge fund boys are borrowing $ at almost 0% and they buy Italian bonds, etc on margin to get great yields a la Corzine (no risk with a BB put, right?). Some even buy Euros to post margins on shorting the bonds. The reason does not really matter because if they keep doing it long enough, I will be wrong. I’m expecting Greece, Ireland, and or Portugal/Spain to pull out of the Euro and cause a big Black Swan on their little games.
Kent,
You make a valid and timely point about countries like Ireland – I’ve lived there for the past 8 years and can confirm that media coverage (typically showing a diligent nation dutifully paying back what it owes to the “troika”) is far from the true story. There are mass rallies every week, recently turning violent. 31 March was the deadline for paying the latest new austerity tax (a property charge), but more than half of those liable have refused to pay it. This attitude has now spread to major countries like France and Holland, which was until recently the poster boy of austerity.
Countries as diverse as Ireland and Greece on one hand and Germany on the other cannot possibly continue to share a common currency, as there is no mechanism to balance out differences in current account deficits, inflation etc. There are more than 5 TIMES as many Teachtai Dala (MPs) per capita in Ireland as Germany, or France, or the UK, and the Taoiseach (Prime Minister) was until recently paid more than Merkel and Obama combined. There is insufficient political will in Ireland, Greece and Portugal to unilaterally leave the Eurozone so will have to wait until the next crisis in government. Now France and Spain – they are a different kettle of fish…
I’ve no personal view on how this will affect the Euro (it could fail completely, or could strenghten once the basket-case countries have been ejected) or the USD, but a lot of people seem to be hoping for a USD fall – a dangerous way to trade/invest. Have a look at the Citigroup Economic Surprise Indices chart on Tiho’s latest blog – its perhaps the most USD-bullish graph I’ve ever seen…
Regards,
Mark
Tiho…just read your full post. Very comprehensive as usual.
I have a possible low for the Dollar going by repeating cycles. This chart of the UUP shows a rough 3 month cycle low which is due this week – http://dl.dropbox.com/u/31723500/US%24%2027%20April%202012.jpg
May only be good for a bounce similar to end of January 2011.
Great comments all, thanks.
Monday 30th brief update:
I recommend Tiho’s and Chris Puplava’s latest posts at their respective sites, Shortsideoflong and Financialsense.
To add to those, ECRI US leading indicators dropped for the second week and now are at 0.6. Also Conference Board’s latest Euro-region leading indicators came in negative. Economic Surprises for the major developed economies continue to tumble. Euro debt remains critical.
Equities appear to be shrugging all this off, as well as last week’s geomagnetic disturbances. But I see this as a series of important divergences that will ultimately pull back equities, unless the picture radically changes.
On the flip side, Asian and emerging equities look to be just getting going again, coupled with a weakening dollar and a renewed uptrend in commodities, with sunspots up. These trends are therefore likely to support equities in the US and Europe as the norm is for them to move as one, but I expect a period of outperformance for Asian equities and commodities.
It is the full moon this coming weekend and I expect a retreat into it. My expectation is that US equities are heading for a retest of the 2012 highs and could pull back from a double top. If they achieve those highs retests in the first couple of days of this week I will sell my US index longs, anticipating we will then see a retreat into the weekend, and potentially beyond.
A final word on real estate. Calculated Risk talk about a long bottom in US real estate here. And that echoes my own analysis, namely that US and UK housing are bottoming out in nominal terms here, but that the process in housing is historically a rounded bottom lasting a couple of years or more. No v-bounce, something that builds much more slowly. I believe therefore that there is no rush to invest here, that the traction will come once the secular stocks bear and its last recession is over. But for those looking to climb the housing ladder in the US or UK, I suggest the rungs are at the most compressed here.
Great summary John. I definitely agree with Asian outperformance of equities. Here in Australia, the ASX 200 is looking like it could be on the verge of breaking out from a strong 4400 resistance. I guess we are waiting for a proper Dollar top to send CRB Index and Shanghai Composite higher, which will lead the AU miners like BHP, Rio Tinto and many others higher too.
RE GOLD.
I believe 1613 is an important level.
The last 3 price falls since last summer were 20%/15% and then 10%. Assuming these falls are diminishing, a fall beneath that level would indicate, at the very least, that the secular conclusion in commodities is more likely to fall in the 2015 camp.
If one is in the 2015 camp one is going for that date primarily, though maybe not necessarily, due to the political cycle.
Looking at that again, it is obvious that through periods of average dollar weakness the Gold normally goes sideways , with the date at the beginning the point of control.
This can be seen by the horizontal purple lines.
Again this happened in jan 1976 – july 1977
By this analysis, Gold should track sideways, with a point of control 1613 until next July and then dramatically rise until 2015.
But!
Last year the dollar price did not follow it’s cyclical pattern. In fact it inverted.
And in fact the point which normally would have been the point of control became the support.
Again, maybe just coincidentally, the end of this period is July next year which would fit very neatly with JH’s solar theory.
I added at 1620 when it got down to 1612 and again the other day on the FOMC meeting.
If we are in an earlier finale then I don’t think it should see 1613 again. If it does then I would suggest the 2015 scenario is much more likely.
The next 2 or 3 weeks are critical.
Looking at that again, it is obvious that through periods of average dollar weakness the Gold normally goes sideways , with the date at the beginning the point of control.
should read
Looking at that again, it is obvious that through periods of average dollar STRENGTH the Gold normally goes sideways , with the date at the beginning the point of control.
Thanks guys.
Tuesday morning: have updated all the models.
The medium term models show the Sp500 well above the model, but I don’t see that as a compelling SP500 short because the Dax and CRB are very much on model. It would suggest the SP500 is due a period of underperformance versus the other two.
The Peak V Peak page shows how sunspots have recently picked up, and the trend should continue up into the solar peak, but with volatility. If solar correlations are to hold true, then commodity speculation should ramp up in line with sunspots, and we are perhaps seeing signs of that beginning currently. Chinese PMI data today showed further growth which is supportive for commodities.
The short term models show how forecasted geomagnetism is flat to down in May but then we should see seasonally lower disturbances into July which is supportive for the markets.
Shanghai Composite was up over 2% in todays trade. I think we could be breaking upwards, which should be positive for the Euro and CRB Index.
Yep, looks good.