

The most likely scenario is August closes around the current highs on another day of ultra low volume. I expect margin debt for August will challenge the February highs. By history, increased volume should return next week after US Labour Day. Negative divergences on marginal highs, double tops, lunar negative period, 3rd day of geomagnetic disturbance and all those indicator readings would ordinarily mean volume should return on the sell side. The day after Labour Day marked the 1929 peak, whilst the 1987 peak and the 1937 secondary peak both occurred in the second half of August, so this is an opportune window for the peak to finally occur.
The ultra low volume in context:
 Source: John Kicklighter
Wednesday’s ultra low volatility in context:
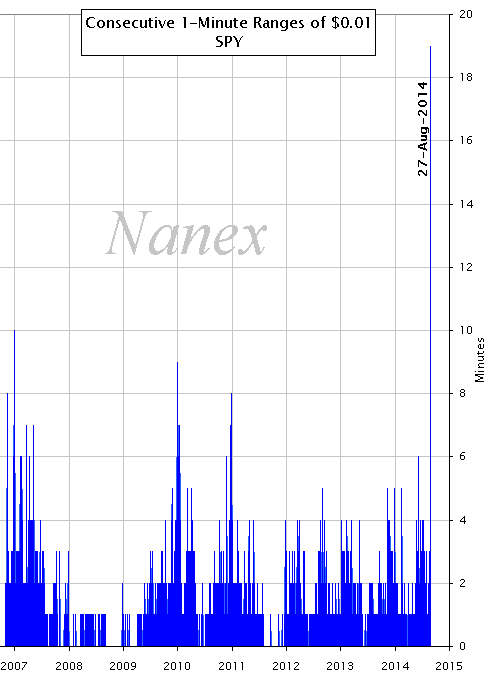 Source: Eric Scott Hunsader
Rydex bull-bear assets are back over 10, ten months in an extreme high band.

Source: Stockcharts
Investors Intelligence sentiment is also 10 months at historical extreme and showing a divergence from the turn of year high:
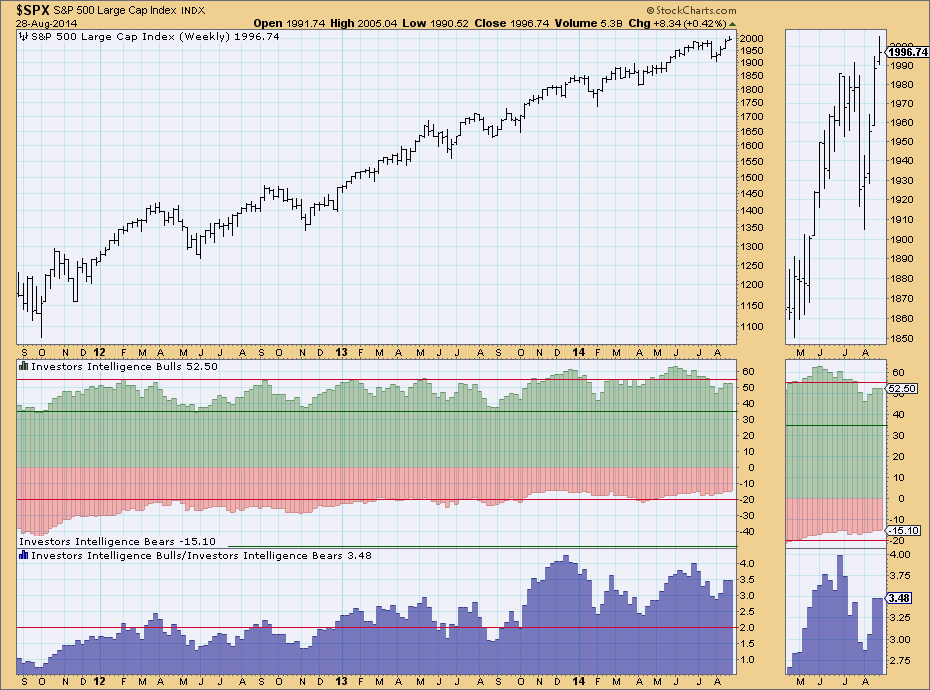
Source: Decision Point
NAAIM exposure similar, in extremes duration and divergence:

Source: Ryan Detrick
AAII sentiment has leaped back up to the bullish extreme following this latest V-bounce:
 Source: Pension Partners
Skew is 10 months in an extreme high band and rising back up to maximum acute:
 Source: Barcharts
CPC put call registered an extreme yesterday normally associated with the bottom of a washout, though clearly this has not been the bottom of a washout:
 Source: Stockcharts
So what does odd reading mean? What do all the atypical and outlier readings in the 8 charts above mean?
Historic evidence says this is the prelude to an imminent collapse. Not a mild correction, but something truly devastating. The depth and maturity of the extremes and divergences does not mean safety is on the bulls’ side. Instead, history shows that the bulls needed these indicators to be resolved at lower readings and earlier in the timeline to prevent something irreparably nasty erupting. Panic-selling and crashes may not occur often, but all the ingredients for when they do occur are present.
Some final charts.
Money-losing IPO prevalence:

Source: Sentimentrader
Eurostoxx shows the parallel with 1937:
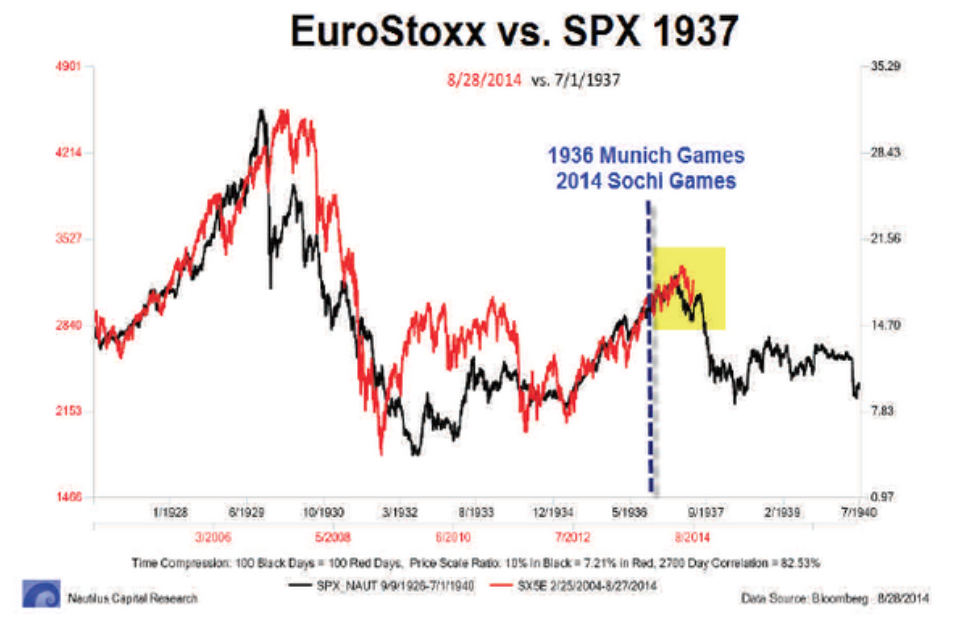
Source: Nautilus Research
German bond yields echo the deflationary trends of Japan:

Source: Holger Zschaepitz
Italy has moved into outright deflation; Spain too:

Source: Sober Look
Japanese household spending is down 5.9% yoy – QE isn’t working:
 Source: Market Timing
With a global softening in economic growth predicted by leading indicators in Q4, I believe the recent beats in US economic data will give way to disappointments as the stock market rolls over, and the worsening economic problems in Europe, China and Japan will help produce global negative feedback looping.
If the stock market rises next week then it will really produce the greatest anomaly yet with the scene-set:
1. The next few sessions are lunar negative for sentiment
2. We have current geomagnetic disturbance which is negative for sentiment
3. We are entering the inverted geomagnetic seasonal low for the year which is negative for sentiment
4. The solar maximum continues to wane from its Feb peak, which should cap speculation
5. We have mature indicator extremes in place since the turn of the year which show divergences too
6. We have a variety of short term divergences between the SP500 July peak and the August peak
7. We have have rallied since Aug 8th on extreme low volume which makes the new high sticking unlikely
8. We appear to have already put in peaks in Japan and Europe stock indices, US small caps and various risk measures.
So if it ignores all this and rises anyway? Then it becomes difficult. Get out and miss a flash crash which could occur any day, from which the market does not recover. Stay in (short) and risk the market melting up further.
I don’t share the view that the market will give us time to get short with an observable topping out process from here. By various indicators we are equivalent to the collapse point in 1987 or 2011, as examples, rather than earlier in the process. I believe one day soon we will wake up to a large gap down that runs and runs, and that we can already see the topping process going through the previously noted Jan-Mar-July phases leading into that.

“I don’t share the view that the market will give us time to get short with an observable topping out process from here By various indicators we are equivalent to the collapse point in 1987 or 2011”
I agree whole heartedly with that view John.
I also believe that gold will respond in like, just as it did in 87 and that it will spike extremely violently toward $1900
Thanks Allan, I hadn’t looked at that. Here that chart is:

Yes John, dare I say it? i was around back then too. Ihad reduced my exposure to stocks in the lead up to the 87 crash but I still took a pretty big hit.
I remember quite clearly the spike in gold and the whipsaw back down in the days following as the share market consolidated, however I do happen to think that this time we won’t get the whipsaw back down anywhere near as violently.
A spike though, toward $1900 is IMO a very high probability. There very very few options open to investors at this point.
I’ve considered the possibility of gold making a sharp run to 1900. Imo the gold chart starting from the 2011 top has a similar look to a reverse image of the djia from late 87 to mid 90. However to accomplish such a run would require an “event”. No other way to make a run of that magnitude.
The only thing I would add here is that when one looks back historically, I doubt that the crashes happened for the main reason that “indicators were at extremes”. I say “doubt” because we are all capable of applying many different causes and storylines that fit with what we think we know.
The next down cycle will come, but it is extremely unlikely to come just because various indicators are at extremes, there needs to be a trigger. Sharp falls happen because there are many sellers at the same time. There has to be a reason for that happening or even a coincidence?
When we look at indicators we compare them to previous events. We say that we are now at the levels where we crashed last time, so we must be entering danger zone again. This is of course not necessarily the case.
I am starting to consider the fact that solar activity and lunar phases are not useful for investing/trading. I have of course been here because I have an open mind and would like to consider the possibility that human activity is affected by such things, and although I am convinced that we are in fact behaviorally affected I see very scant signs that these are useful in any way for investing/trading.
I will keep reading though with interest, no offence intended.
I have stated several times now that the lunar cycles (=gravity) are still up with a peak in November. What is so hard to accept about this? We have 2 conflicting forces; solar forces push down and lunar forces still push up. That’s the only explanation I can find to explain this market. But we are getting close to a major turn. And if this is going to be the multi century top some are predicting, a massive ending diagonal – taking years to complete – is a real possibility..
Just another btfd event into early December.
Uranus takes 2621 days for a 30 degree move. Counting from the 10/11/2007 high this gives December 14th 2014 as a significant date. The lunar cycles point to end of November. No coincidence.
No offence taken.
If you look back at previous major peaks there was typically no trigger. One day the market stopped going up. Certain lunar/solar timings were typical – and appear highly relevant this time.
If you look back at previous crashes or panic selling there was normally some kind of technical break.
All the indicators show different angles on the market: some give an idea of ‘all in’, some show underlying selling pressure, some show dumb money buying rather than smart, etc. These indicators may not ’cause’ the market to go down but collectively they represent buyer exhaustion, detiriorating market health etc.
The leverage and allocations are very much a factor in panic selling / crashes.
Well it will be a great call if this transpires,
see what next week brings.
Very brave to short this.
john, you have been saying since January every week that a crash is imminent, are the indicators more extreme today than the rest of the year. thanks
The same crash conditions that I first identified 26 January remain in place. Therefore I believe a crash is coming. Only if those indicators reset without a crash is it invalidated. Those indicators have in no way been reset.
I started creating a reverse list on why NOT crash, with the hope of seeing the list dwindle over time. For example, we could use another Hindenburg Omen. We could also use a spike in volume with euphoric buying. We could also use more inflationary signs to prevent the Fed from easing further.
based on this chart posted at the beginning of year I said I expected new highs in bonds… at the very least expected the coming together of lines to act as magnate for price… as a trader took half of long term off and await to see if forecast will prove correct on rest
http://stockcharts.com/h-sc/ui?s=TLT&p=M&yr=12&mn=3&dy=0&id=p58237167873&a=333536382&r=1409310533538&cmd=print
close up off tools at work
http://stockcharts.com/h-sc/ui?s=TLT&p=M&yr=0&mn=3&dy=0&id=t11049518506&a=333536382&r=1409311026217&cmd=print
NICE TO SEE U BACK HOPE UR HEALTH IS BETTER………
ooops! not sure y it did that
OK, so as many of you know I am bullish short term. and that hasnt changed. Obviously there is a desperate need for a correction and I have been thinking this is in order of the 10-15% level.
Now since the start of the year when John showed evidence of a bear market (at the very least) most would have agreed (Myself included). As the months have past im guessing most people’s expectations are like me, 10-15%, right? Now choosing to ignore the indicators that John has repeatedly warned about and getting a whole lot worse because we havent crashed yet.
Well, now that the number of people in the crash boat have evaporated this could very well be the contrarian medium term bet. I dont agree with all the indicators but most I do. October is know as cradh month – I hope John is proved correct.
Thanks Duncan.
Those who have only started reading this year may think I am a permabear. Those who have read along for several years will know that’s not true and if anything my natural bias is bullish. It’s the research and analysis which turned me bearish and kept me bearish this year. And, though I am going through pain with the shorts, each time I work back through the data and try to see the bullish side, I can’t. As I’ve said many times it’s all the many different angles coming together bearish that make it so compelling, the cross-referencing of multiple disciplines. So, I just believe, it has to be correct.
Thanks again, John, for your excellent aggregation of data and for sharing your thoughts and conclusions. My friend and I read your posts religiously. Your work is much appreciated.
Thanks Ted
like in every market the waiting is for the last fool to buy while insiders are selling there stocks and retail buyers are returning to the stockmarkets. ad this to all indicators and measurements, knowing this bullmarket is driven by cheap money only which never came into the real economy and we all know we are heading for disaster. the extremes in indicators are -in my humble opinion- joined by stockmarkets at dizzy hights with no real economic justification. you can throw anything high in the air but in the end it comes down again. that is why i think that at least john’s optimistic scenario of a 18-20% correction will happen very soon. some time ago i read that stockmarket peaks are joined by vulcanic activity and/or earthquakes. i do not know if this is 100% correct butt lately we have/had these kind of events. i also read that warcycles show we are entering or already have entered a new period of war and social and political unrest. just check the news and you what is happening in the middel east, russia etc. in my country -the netherlands- almost 200 people got killed in the mh17 flight above ukraine and russians marineships and airplanes are entering european waters and air terittory more often than before in the last 15 years.
why i say this all? there are to many things going on which show times are changing at a fast pace; political power is changing, economic power is changing and war power is changing. we have consumed the future by borrowing and living like there is no tomorrow and i think the good times of wealth and peace are detoriating and stockmarkets cannot keep going up. and that is why i think john pessimistic scenario of a deep 50-60% bear market is even more likely.
time will tell, i only hope a stockmarket crash is only the biggest worry for the future.
John, thank you for sharing your work, i appreciate your multi angle scientific approach and view. i believe staying short in this market right now, even with very little money is going to pay out huge in the end…
Thanks
Well here we people, another one of those BUY NOW before it’s too late articles.
And this time they are dissing Mr Shiller basically sayinghe doesn’t have a clue. Well let’s see, Mr Shiller’s CAPE whilst not perfect can be and has been back tested nearly a century and a half, but now it just doesn’t work.
It tell you this is classic bull market top indicator right here.
http://finance.yahoo.com/news/shiller-signaling-significant-upside-p-080612728.html
I see short interest at extreme highs, how can it possibly crash?
Short interest is at extremes in 2000 as well. Shorts are smart money and make money over decades. In bubbles, they are considered dumb until after the crash. But academic evidence over the long run show that they DO make money.
http://www.wallstreetcourier.com/v/ci-gf-dumb-money-indicator.htm
John, you know I largely agree with your thesis.
However, I disagree with two points here.
1) Low volumes are not bearish. They are typically bullish as it means euphoric buying has not set in, nor distribution from smart money to dumb money. Your chart itself shows that low volume did not signal the 2008 peak, and I am sure it is the same for 2000 as well.
Does that mean we can’t crash? No. This time is probably different — QE has removed a lot of float somehow, and so the turnover is less. Institutions forced to take risk have “bought and held” and so there is no volume. However, they might sell eventually and volumes will return.
2) Market giving us time to short?
Even if there is no second chance rally, there is always time to short. For example, the NKY went straight down in Q1 1990, but still offered 2-3 weeks of stagnation in 2/1990 to get short. In the best case scenario for the bears right now, we begin a waterfall like in 1937 or 1987. Even then, we have an up day shortly after hitting/crossing the 50 day or 200 day moving average. Of course in this best case scenario, a bear would be better off shorting at the peak — but we just don’t know where the peak would be. The alternative could be to lose capital and be forced to cover, and then miss out on the crash finally coming with little in the game.
In other words, the large gap down days often come after a series of down days. Presumably, I can scale in as each down day arrives and implied volatility shows greater fear. The moves from the peak then to be more erratic as bulls fight (in vain). For someone posting and watching the market daily and intraday, it does not seem worthwhile to be betting the thesis on any particular week or even month in advance. Futures trade almost 24 hours, and so even if we do get a gap in cash, there is time to get in with futures.
As I stated before, I have been waiting for 9/1/2014 (or closest business day) as a likely turn date. As we arrive at this date, I find myself not wanting to commit to a full short position still. I rather place a series of stop orders under the market. I would lose potential profits of course, but if the crash is -40%, what is wrong with shorting at -1%, -2%, etc. from the peak? On the other hand, in the back of my mind, there might be a chance, perhaps a slim chance, that we are in 1928 or 1871. That is, right at the solar maximum, and yet have 30% or more upside from here. Do you use leverage? a 3x triple levered short would be almost wiped out,
I am not trying to preach, and I am tired of bulls preaching with pseudo arguments. I lost a good chunk this year on this call, and I need to live to see the day. Just throwing this out there as a counterpoint in hope for answers too.
John, perhaps a fair question is, if you were in CASH right now, what is the best strategy? Would you go max short with available margin, or have another strategy?
If I was in cash right now I’d want to be max short like I am, because of the breadth and depth of the case. That’s not bluster, it’s just the conclusion I reach each time I re-analyse. I still see the opportunity of this decade: the case is just so multi-angled and cross-referenced.
One last point, my view is synthetically similar to George Soros. Long stocks and long puts. He was a big plunger against the pound in 1993 and asia in 1997. If one follows Soros, there is no gap risk as the futures are already committed at a lower delta and become more short as markets tank.
I read that soros bet is only to lock in his profits and not actually betting outright on a collapse
Adding to my long at SPX 2002. Reason – bulls defending SPX2000.
Fuel almost spent – but not quite yet. Will be flipping short soon.
id like to know what volumes would look like if the share buy backs were removed from the data,
I think 2011-20
I really think any talk of 40% type declines
is currently ridiculous.
Earnings remain far too strong for anywhere
even near that in my view.
Even 10-15% I view as unlikely at this time.
With the next recession and contracting earnings,
which will herald a new bear market,
then you can expect 20% plus declines.
Your thinking is wrong because the market moves way before any drop in earnings. By the time it’s obvious there will be a recession and contracting earnings, the market will already be down 20%-25%. Why did the Nasdaq begin to drop in march 2000 when the economy was booming ? Because the market was looking ahead 12 months…
I am well aware the market is a discounting mechanism,
there is currently no general threat on earnings 6 months out imv.
US data is continuing to improve, that is the key for me.
Some short term weakness, perhaps from next week,
may well happen, 7-8% on the downside is my current
view – if we even get a September/October correction.
Hi Phil ! of course you might be right although I’m sure people in march 2000 didn’t see any threat on earnings 6 months out.
Also, you don’t need a drop in earnings to have a meaningful correction. In 1987, the market went down 40% and earnings were just fine.
flash crash territory
Observation of the day …
Have a look at the daily SPX. What do you see? Bulls and bears are fighting for control of the 2000 level all week. So who is winning? IMO, the bulls are. The longer this lasts the higher chance we are ‘high basing’ ready for lift off. I’ve added long again. Imperative that bulls close above SPX2000 though.
I think that John Hussman has proven that Heisenberg’s uncertainty principle applies to the stock market as well as physics. The principle is that the more closely we study a particle the more we change its motion. Hussman has shown that for the last three years the “overvalued, overbought, overbullish syndrome” by comparison to 100 years of economic data should result in a 40-50% decline, however, the market continues to go up. Why? Hussman and other hedge funds and investors expecting a repeat of 2008-09 either go short or reluctantly enter the market, causing a classic “climbing a wall of worry syndrome”.
EWers are expecting a run up to SPX 2050 early Sept before a 10-15% correction.
just read this “$SPX March,6th,2009 Low ,666 was 2003 Calendar Days Ago, Todays High is 2003.”
a positive close before a 3-day holiday is practically pre-ordained…
Yes, why ever short before a holiday?
Tuesday will be a big tell.
If the rise continues in to the 2nd,
then the possibility of a parabolic
phase begins to become reality in my view.
ShadowTrader’s view.
Not saying he’s right!…but, alternative views should be considered IMVHO.
FWIW, I’m thinking we need the next full moon as a potential turning point.
WTFDIK!
Thanks for the video TDL. Interesting about the monthly shooting star being taken out on the US indices.
September is known for being the worst performing month. Another monthly shooting star? … maybe imo.
yes makes sense
Apo/peri still down into sept 8. But 3 longer cycles still up. Next week we will enter the last 3rd part of the apo peri cycle. Mars in 3rd part of scorpio. Tuesday the high and then down into september 10. 2-3% decline expected. After that : more tomorrow.
Enjoy the weekend.
Andre, you forecast falls this week, it did not happen.
Is it just me that notices the inaccuracy in
your predictions/forecasts.
Phil
Thanks for reminding me; I hadn’t noticed yet.
Anybody go onto bloomberg this morning? Nothing but doom and gloom …
UK wants EU to block Russia from SWIFT network
Fighting in Ukraine Surges as Russian backed forces gain
UK terror threat raise to ‘Severe’ on Syria and Iraq
EU mulls Russia sanctions
JP morgan hackers came in the front door
Oh and … SPX tops 2000 to finish best month since Feb.
Im long but getting a bit nervous that this is some wall of worry the bulls are climbing.
Duncan, the current amount of bearishness is bullish.
There are a multitude of correction calls currently,
it is an accurate contra signal in my view.
Of course you could have some give back following such
a rapid rebound, but those looking for short term waterfall declines
are highly likely to be disappointed is my take.
Andre, if you insist on making continual short
term calls which are consistently incorrect,
it is worth remarking on.
I judge by results.
Phil,
Fair enough. But I’m not the only one with wrong calls, I don’t insist on being incorrect, and this is a work in progress. I learn from mistakes and use that to make better forecasts. The text above should explain something.
Andre’, John,
What you are trying to do is very difficult (obviously). It took Gann, Bayer,…, at least 10 years of innovative thinking before they were consistently good. Your work is appreciated, I believe that you have many of the pieces of the puzzle, please keep on trying to gain knowledge and sharing. Thanks
Hi Steve/ fellow readers
Q. Are you able to point me to a reliable resource that gives a detailed explanation of Gann’s master time factor.
I’ve tried googling this many times, but have yet to fin anything of any practical value.
Thanks in advance
TDL
Phil,
It is worth remarking on if you have any thing worth while to say. So far you haven’t. Please provide your pivot days for the next 2 months, or any other time period, so that we (and you) may learn something from you. Include your thought process so that everyone can gain from your knowledge.
Don’t be disheartened Andre. Please keep those ideas steaming. I do believe that if a system works consistently it must be at least hidden in part from the masses.
“Every man is my superior in that I may learn from him.”
― Thomas Carlyle
You made my day 😉
I ask fellow posters to ponder the following as everyone seems to think the opposite of what I expect to occur.
What happens to the USD if US markets collapse?…….To wit as far as I am concerned the massive in flows of foreign of capital into the US stock markets has held the dollar up.
A major sell off in US stocks will IMO, see the dollar drop as foreign investors dump US securities enmass and as I have said previously, propel gold much much higher.
I fail to understand how investors automatically think the USD must go higher under the above circumstances. That may have been the case in the past, but in the past the Fed had not completely destroyed the bond market and created multiple bubbles as they have now.
Hi John,
What are your thoughts on this Harry Dent article that ties solar, presidential, & ten year cycles into one coherent picture: http://www.marketoracle.co.uk/Article47109.html
The article speculates that the worst stock market crashes happen 2.5 years after a solar peak just as the ten year cycle suggests. So the next crash should occur between late 2014 and late 2016 and bottom around late 2019 or 2020.
This ties in with what I have been speculating in my previous posts in that the market will correct down to around Nov 2014, go up in 2015, and top around the next presidential election year in 2016.
Jack
Jack,
This fits with the long term OEW forecast as well. http://caldaro.wordpress.com/
The solar cycle averages 10/11 years, but this solar maximum falls 14 years after the last, the longest gap on record. The average matters less than the actual. So I continue to expect a major peak close to the smoothed max, and believe we are in the last phase of that.
steve, I have been clear on my views.
No bear market without US earnings compression.
A correction beyond 7-8% unlikely, and more than
15% highly unlikely.
This bull market will not end in 2014.
The last correction to be short and shallow –
already happened.
I have no issue with people attempting to make
highly specific and frequent calls, my own view
is this is an impossibility and best avoided.
If someone thinks they can do this, great,
however if there is consistent inaccuracy then
own the incorrect call and perhaps take some
time to reflect rather than immediately make
another one, just my view.
You have been clear and I agree with your general market path; but I also believe that Andre’ is taking an approach that you can not relate to. Where you don’t see reflection or success, I do; and I appreciate that Andre’ continues to make his process available to us as it unfolds. You see no value in it, and that is good.
USD is on it’s way down along with risk in general.
Repatriation will be to Yen…..as US Equities are sold then converted to USD, then converted “back to Yen” and repatriated to the Japanese bank accounts of origin.
Once rates move higher in the U.S and the differencial is created between Japan and USD sure….USD will move higher.
It’s my feelings that a very large number of Dollar Bulls are going to see the rug pulled here very shortly.
FK, you and I seem to be similar thinking in some regards. Your Forex knowledge is appreciated.
Higher US rates will be rquired to provide stability, it is inevitable.
Perhaps.
Although ( unfortunately ) I don’t see higher rates providing stability in this case…
I see higher rates as the “ticking time bomb” that just as well mark a terrible turn.
We all understand that The U.S Gov cannot handle higher rates. It’s the “rubber meets the road” on the U.S ponzi, and this incredible monetary experiment The Fed has been running.
Storm clouds ahead. Big storm clouds ahead.
From Hoye…$SPX in exhaustion mode. Has triggered an upside exhaustion registration on the monthly chart…which is RARE. The same model he uses registered downside capitulations in Nov 08 and March 09 as well as Sept and Oct 2002.
Nice to hear. Add to this $OEX put-/call ratio on friday at 3:1 (exceptional strong hedging interest of big players), 2nd term incumbant seasonals and modest Dow correlation to 1945-1946 on the cusp of being broken or confirmed (http://www.mrci.com/special/ddji46.php) and you get an imminent make-it-or-break-it situation for the bearish scenario.
thedarklordblog,
For Gann’s MTF I would suggest going to the ‘Wheel In The Sky’ site. There is a very nominal site administrative fee. Lots of information on MTF and related info. It is a research site with a lot of very smart people who can shine the light on the path to take, and lots of source documents, but be prepared to work for the answers.
Thanks SJC. Will check it out.
Cycle power.
From cycle theory we know that the power of a cycle equals the square root of it’s amplitude. And that amplitude increases with the period. In other words; longer cycles have more power.
So what does that mean for timing? What happens when a short cycle turns against a longer cycle? The answer to this question holds the key to gravitational forecasting.
When a short cycle turns against a longer cycle we see :
1) the market won’t reverse as the longer cycle is dominant and the shorter cycle starts building up momentum/energy.
2) Momentum will reach a critical level and all the build up energy will be released.
3) This critical level will always be reached in the 3rd phase of the cycle.
So the market can delay a reversal, but can’t avoid it, Eventually every cycle will deliver.
Example
The multi month cycle turned down in March for a low early August. But 2 longer cycles (more power) were still up. So the multi month cycle had to wait until June (3rd phase) for some action. And we did go down eventually. Early August the multi month cycle decided to go with the flow once more, turned up and gave a sharp timing for the august 7 low.
This week we had an apo/peri cycle down against the longer cycles. The tides gave a high for Tuesday, but the market didn’t respond as the apo peri was still building up momentum. So next Tuesday I have a tidal high once more. But now we are in the 3rd phase of the apo/peri cycle. So now I am certain Tuesday will show a high and we’ll go down into September 10-12.
From astrology I see a grand trine between the moon, Jupiter and Uranus on Tuesday. And mercury enters Libra on Tuesday. And Saturn will square the USA’s moon on Tuesday. The lunar declination will reach – 18.35 on Wednesday. The last time this happened was august 7th.
And mars will enter the 3rd phase of scorpio next week (Merriman).
So the astro timing confirms the gravitational timing.
To me this new insight confirms the value of gravitational analysis. With every step I feel I come closer to the final solution. I enjoy this journey and I hope some of you do as well.
So, next week will be down and volatility will start going up. Is this the big one? I doubt it. After the 10-12 of September I see a recovery coming. But it will come this year; of that I am sure as the longer lunar cycles are all in their critical 3 phase.
To end on a light note : next week is weeknr 36. 3+6=9, the sign of mars. Mars rules next week! Can’t be good 😉
Cheers,
André
Thank you , Talk a bit more about that “recovery”…
Nicola2910;
What I just posted is a new way of thinking for me and I need to have it in my head for a few days. So next week I’ll use these techniques to make a forecast into October.
Cheers,
André
If it doesnt equal 7 it just isnt the same 😉 Nice work Andre.
Duncan,
Thanks. Numerology is a new subject on my radar that came with astrology. Not sure I need it, but I like to keep an open mind.
thank you Andre. On 9/2, Mars is 45* to the birth of Jesus Christ. 8/9 Mars was 60* to same.
Peggy,
Fascinating!
2/5/14 Saturn 45 to birth of Jesus Christ yes, fascinating!
Dark Lord:
Time-price-research has a wealth of info. Sunspot and tides info is there. He covers everything! You will find Bradley and Gann there.
http://time-price-research-astrofin.blogspot.com/2012/03/wd-ganns-financial-time-table-extended.html
Thanks Earthabides.
At first glance, it appear that Armstrong’s ECM closely mirrors Gann’s work.
Very interesting indeed.
Would I be correct in thinking that each asset class has its own Master Time Factor?
FK, higher rates are inevitable to stabilise the economy.
We need to recognise that ZIRP has done nothng to stabilise the global economy, it has done more damage than good.
ZIRP has encouraged complacency, corporate ineficiency,lack of accountability amongst corporate exectives, the inability for risk to be correctly calculated and I could go on.
Zero rates have done nothing to help Japan, they have done nothing to help the US recovery post 2008, other than pump stocks and real estate and create a bond market disaster waiting to happen of monumental proportions.
The only thing that will ultimately restore stability will be a return to normal functioning bond markets and normal risk and returns and that means higher rates. There will be no choice next time around.
That is however not likely to be recognised until after 2018.
Cheers
For a call be to an accurate one, accuracy
in timing has to be a large factor
I can predict with certainty that this bull market
will ultimately end with a new bear market.
However that is akin to saying every human life
will eventually end in death, there is no value in
that call.
The next bear market will in my view be short
in duration, perhaps around 9-12 months
and relatively shallow.
Any declines much beyond 25-30% are unlikely.
Duncan’s point on Putin is valid, this has
the potential to cause a short term sentiment shift,
it may provide the correction catalyst that many see as
currently lacking.
I still stand by that. This market has one kryptonight and that is Russia / Ukraine. Reason this is far more concerning for markets is the damage it will inflict on the euro area which is already bordering on deflation. Also the events are random. The market will never make it easy to short and get rich before a planned release like GDP, Jobs number or Central Bank meeting.
John is looking for a crash. This is a panic event and if Putin can cause enough fear markets can become disorderly very quickly.
Empathy for John:
Let me start by saying that I have been trading the markets for about 40 years.
Seen it all. In my favor, I shorted in Spring of 87, Dec. 2000, Aug. 2001, July 2008 and along the way went long gold and silver when I should have.
My problem is that I am always early. My “fundamentals model” is broken in that sense but always gets the trend right. Every good call is proceeded by lots of pain as markets keep going against me. Think face punches, questioning sanity, ulcers, ect. Right about now, John is feeling some of that.
Then the three X returns come and I stop hating myself till next time.
We may have to except the idea that the market does not go down until later this year, or early next. However, I do believe it will be worse than the March 2009 lows.
The demographics, the leverage, the level of debt, future sales pulled forward with the help of easy money. Economic reality is at 1985 levels. I do believe that after we get through a very messy depression, it will be 1950 again and a re-industrialization of the US will occur. The “dirty” kind of manufacturing centered around gas/oil, not assembly line. Robots one that battle. Any engineer will tell you that CPU power and software is already there, they are just waiting for someone to provide the task that needs to be solved. The sophistication of assembly robots will only be accelerated by the advances being created to support the 3D printer markets. On the other hand, German chemical companies are flocking to the US to take advantage of 1/3 natural gas and 1/2 labor cost. This has just begun.
I’m occupying an advantage point that allows me to see what is going on inside the top Fortune 50 companies. I have never seen such rot before. Of the 50, at least 30 have debt at 120% of cash. Most have cut capex, R&D and maintenance by 80%. Most have been borrowing money to do stock buy backs, while simultaneously selling off business units and doing layoffs. Of the 50, at least 20 have 100% insider selling. For some, you would have to go back decades to find a point where all of the acting board of directors are selling. In essence, they are paying the mortgage with their credit cards. Without bookkeeping games, there are no solid earnings. There will be no earnings growth.
“Executive compensation is based on stock performance” is killing corporate America.
A black swan is not needed to make it fall, a gentle breeze will do just fine.
On a different note. Next winter will be cold. The next one will be colder. Every year for the rest of your life will be colder. Global warming has been delayed 400 years.
http://quadrant.org.au/opinion/doomed-planet/2014/06/edge-cold-deep-abyss/
John, lots of solar cycle info. Page five has the graph cited above.
Click to access 2013_steinhilber.pdf
Forex Kong and others. Lots of thought provoking ideas. I agree the “money” and the things with “money like qualities” will need to find a home. However, if 3 trillion in carry trade heads for the exit, and with so many leveraged or naked, can we really have a smooth unwind/relocation without causing the very scenario that causes a lot of digital money to vaporize?
Thanks to all for the views, and to John for a great site.
I’ll go back to lurking……
Thank you. Back in 2009 I went through something similar Jan-Mar from the other angle: I started building long in Q4 2008 with a broad case for it yet the market dropped from Jan 1 until Mar 9 putting me under stress and drawdown. Then it turned and delivered. This time has been 8 months and a much higher exposure and much more stress. I still believe it will turn and deliver also, but it’s tough until it does.
Good luck John. I certainly remmember you being bullish when others were bearish and you did well. This has been a long slog for you and hopefully you will be rewarded.
I enjoy your blog and you have built up a good community here. Of course we are not completely aligned in our thinking but I do enjoy reading your posts and the comments section.
Thanks
Earth, very interesting post, good fortune.
I read blogs like John’s to challenge my own views.
It’s an admiral quality to have the guts to go against
current consensus, and not just discuss it,
but take positions as John does.
Thanks
Earth, your ‘out-of-the-box’ perspective is bold and refreshing. I’m sure I speak for others who want to say ‘thank you’ for reporting your thoughts and comments and for sharing your experiences.
john you keep saying secular bull markets don’t start from these high levels in price sentiment leverage etc, but this bull started in 2009 from the exact opposite of now
See this chart. Look where valuations were 5 years into previous secular bulls versus now. Look also where 2009 valuation was versus previous secular stock bear bottoms.

http://capitalistexploits.at/
wow a must read… close your shorts!!!
Pentagonal time cycle theory
After introducing the concept of cycle power to the lunar forecasting technique – and solving the tidal forecasting issues – I was stuck with one remaining question : what is happening above the 4-something year lunar cycle? Is this one going with the flow or against it? There is no way of answering that if you don’t have a longer term perspective.
Amazingly I suddenly came across this book by Bradley Cowan : the pentagonal theory – like destiny handing it to me because I nedeed it-. And he claims there is a 17 year time cycle in the stock market, based on a Uranus cycle. The Uranus cycle takes 84 years and 84/5=17. Voila. Next he points to the Saturn-Uranus harmony.
When I read this I thought of what Steve (SJC) had said a few blogs back : the longer term lunar cycles : 8.6 and 18.4 years. Isn’t that amazing? The pentagonal 17 year comes very close to the 18/19 year lunar cycle. And the midpoint of the 17 year is the 8.6 year cycle. And the midpoint of this cycle is my 4-something year lunar cycle! It all fits.
The main point is : we can now combine 2 totally independent forces. Uranus is not about gravity; it’s too far away.
I know the numbers are not exactly the same. We need to realize that these cycles aren’t fixed. Not all planets have a perfectly circular course. And when it is eliptical, time and degrees deviate. Allowing for some flexibility, 17 and 18.6 are basically the same and a brilliant confirmation.
What does this tell us? Cowan sets the start of the current 17 year cycle in 2000. And it should run into 2017. Within this 17 year cycle we should see 2 8.6 year cycles. In my Sunday post I talked about the critical 3rd phase of a cycle. Now what is the 3rd phase of a 8.6 year cycle? Roughly 2.9 year. So the critical phase started at the end of 2006. And 2007 produced the high and a major reversal – in the third phase of the 1st 8.6 year cycle. The recovery in 2009 was swift, indicating the 17 year cycle is up. The most liquid market on the planet – the s&p – reflects that.
So, we are now in the 2nd 8.6 year cycle. Starting from q2 2009 the same analysis indicates we are close to a very critical period. The 3rd phase of the 2nd 8.6 year cycle should start soon- if it hasn’t already started. So John is right! No question about it.
Now the peak in the 4-something year lunar cycle in November doesn’t look so weird. Could be that once this lunar cycle turns, it will be the timer within the 3rd phase and trigger the collapse.
Given the variability in cycles, there is no way of pinpointing the exact date. But the confluence of astro and gravity is very compelling.
Lastly, solar activity is the 3rd relevant force. Sun spots affect the amount of positively charges ions in the atmosphere. And it has been proven that humans feel bad when this happens. Even increases your chance of catching a cold.
So John’s solar analysis is the 3rd !!!! confirmation of what is waiting. Planets, gravity and solar cycles in perfect harmony!
Hi Andre,
I have been reading about your tidal studies with interest, partly because they are aligned with my own thinking. I am waiting for confirmation that I am on the right track but this comment seemed so close to my own thoughts I thought I’d share some info with you.
There is a lunar cycle for the line of apsides which is 8.8 years long, quarter/half of which is my short term stock market cycle (2.2/4.4 years) and double is my longer term cycle (17.6 years). The chart in the link shows the full cycle since 2000. I still maintain we are in a secular bear market that won’t finish until 2018.
I am looking for a wobble around 8th Sept or 8th Oct but ultimately up into March/April 2015 for a top.
http://www.ritholtz.com/blog/2013/11/balenthiran-cycle/
Regards,
Kerry
Kerry,
Thanks for the reply. Mr Ritholtz says cycles can be interrupted by external events (full stop qe? War with Russia?). But so nice he quotes Conan 😉
I have said that pinpointing the exact date is tricky. And I wanted to concentrate on the larger picture.
If the end of a 17 year cycle is close we should expect one more last exhaustion rally. I think that is what Financial Buzz Guru is seeing.
Only wanted to tell everybody that imho we are approaching a danger zone like the one in spring 2007. And that when that last leg turns down it could get nasty very fast.
But I see we can agree on a lot of things! Nice.
Biggest challenge is that natural cycles are never fixed; that’s not how the universe operates. That’s why Conan also looks into Saturn. And that’s why I am so enthusiastic about combining astro and gravity (and sun spots); should filter out some of the uncertainty.
Andre’
Great post. I have a couple of observations, followed by a question on your gravitational observations.
The Saturn-Uranus Cycle is fascinating, especially considering they are so distant, it can’t be gravitational (unless gravity works different in the absolute 0* of space). Anyway, there seems to be an interesting market impact when the angular relationship of that planetary pair turns retrograde and then again when direct. In 2014 notice the first week of February, and the time between July 17 to 24. Humm. The next time period is around the middle of February 2015. Slightly longer than 365 days in time. The other interesting observation is that the speed change of that angular relationship seems to be associated with some trend changes. Many of them are minor, and the trend change may only be from up to consolidation before resuming up, but it is worth keeping an eye on. For example, the last one was from about 4/22 to 5/19. The next major speed change is from October 17 to November 18 (centered on 10/30 to 11/10). In between these major time periods (as opposed to time points) that reflect a change in the Saturn-Uranus angular relationship, or the rate of change of that relationship (1st derivative), there are numerous ‘speed hesitations’ (2nd order derivative) that are worth examining. The Saturn-Uranus Cycle may have an impact on several other markets, as if these angular/speed changes cause the markets to doubt themselves.
Whereas, I believe that the above gas giant relationship has an electrical effect on emotions, you and John have been eloquent in researching the Solar energy and Lunar gravity effects on emotions. Therefore the angular relationship of the Lunar Wobble (Sun-Node) relationship may be a reflection of the combination of the two. In the last year the hard aspects were approximately from November 28 to December 3, 2013, and Jan 19 to 26, and April 15 to 20, and July 13 to 18. Interesting dynamic fit to above. The next Lunar Wobble is October 9 to 14 (there should also be a Solar Eclipse around that date). Slightly shorter than 365 days in time.
In your market projection, if I understood correctly (I probably don’t), you mentioned that that Lunar perigee would be on September 10, with impact on market Sept.10-12. However, if my info is correct, Perigee is on Sept. 8 at 358,387 km. If the 8th is correct for perigee (higher than August perigee), then I guess there are other influences that you are considering with the 10-12 being the net impact on gravity of those influences. For whatever it is worth the Lunar declination goes from negative to positive on September 9, and Lunar speed changes dramatically on the 10th. Any correction of my flawed understanding is appreciated, Thanks.
Steve,
You are correct about September 8 for the perigee.But I found that combining tidal information with the apo/peri swing gives a much sharper timing. And now I am also using astrology in the mix. Tomorrow we’ll see a grand trine (confirmed by the tides and other timers) triggering the decline. The next grand trine will be september 12th and I suspect it may function as a magnet. Besides, the moon will be in Taurus, Venus in Virgo and Pluto in Capricorn. So a grand trine with only and all earth signs.
So now I see Reedy point give a low on the 10th, the grand trine on the 12th, Mars entering Sagittarius on the 13th and a supermoon on the 9th. So the 10th is most likely. But astrology is relatively new to me so I am in a steep learning curve. But once I found it I realized instantly the power of combining these two techniques. And I see confluence on all levels.
How astrology works I’m not sure but it can’t be gravity. It could be through affecting the sun. Anyway; I know it works.
I need some more time to look into the dates you gave, but I welcome your contribution in this analysis because there is so much to investigate and you clearly know a lot about it. Have you read Cowans book? Was a real eye opener.
Cheers,
André
P.s. Uranus is now in Aries and in the past some major reversals were seen with Uranus in this sign. October 12 Uranus will reach the midpoint of Aries.
re Cowan’s pov – the next pentagonal cycle of geo Uran gives cits 5/28/16, 10/3/16, 3/19/17 and helio Uran 11/30/16. Last time Uran crossed this pentagonal point, was in 1932 and 1933. It is useful to watch Saturn and Jupiter cross pentagonal points – next ones are Jupiter 11/2/15, 2/20/16, 3/18/16, 6/30/16 and Saturn 12/14/14, 2/26/15, 7/2/15, 9/1/15. Also useful is Uran 9* from 12/14/1914 giving 8/30/2014 and 12/9/2016. fwiw.
Peggy,
Thanks; I’ll have a look at it.
André
My “forecasting financial models” that I created 30 years ago, flipped to BULLISH on the NDX100, SPX and the Dow Jones. We are NOT at a top at this point. Its what I call “buy the bounce” right here. We have much higer to go over the next 3- 4 months.
Well I have just listened to Martin Armstrong ramble for 40 odd minutes and decided he is nothing but a egotistical attention seeker that doesn’t give two hoots about the disadvantaged in the community.
Don’t get me wrong I don’t decry that capitalism has many benefits but unbridled capitalism is DANGEROUS. The US is among the most capitalist economy on the planet,but how has unbridled capitalism worked out for the working class in the US the last two decades? Particularly since 2008.
Banks pushed for less controls amd got it, then they practically blew up the global economy.
Major corporations lobbied politicians for greater free trade and convinced us all of the benefits of globalism and then destroyed manufacturing jobs in the west solely in the own interests and now it’s all the socialists and unions that caused the problems.
Oh and not to mention that he constantly contradicts himself. And I mean constantly.
Gimme a break Mr Armstrong.
Three decades ago it was the Reds that were coming to get you, now it’s the Socialists and Unions.
I have been in these crazy markets for 30 years now…..we have begun the last up move that will be parobolic ending close to the end of the year with a 20. Percent correction……let’s enjoy this ride up….I see the ndx 100. Having the most to gain from here, perhaps a 500 point move up and the spx into the low 2200…I monitor daily, please feel free to watch my update on my free website any t me…..www.financialbuzzguru. Com. We need to stick together during this deflation. Deprressionary economy…….thank you……I am here to help the little guy, not the big wall street frims…..
I do not go short markets, however sold my remaining
stock holdings this morning leaving me entirely in cash.
My best guess/estimate, and that is all it is,
would be risks favour at least some short
term downside, which may just be a few %.
An imminent parabolic phase can not be ruled out
and if this happens the decision will be
a costly one.
There is also the potential for a continuing slow
grind higher.
The decision is based on the rapidity of the recent
rebound, resistance on the UKX at around current levels,
a usually weaker month and a potentially worsening geo
political outlook.
The major plus points currently imv are earnings,
more aggressive action from the ECB and of course
ZIRP – the elephant in the room.
Some sort of resolution with Russia/Ukraine would be
highly favourable.
A WORD OF CAUTION!
First of all , anything I say here is not critical of JH. I’ve been with him on this site from the start and he knows how highly I rate him in all respects.
With regard to shorting the market – two or three months ago I wrote a note similar to this. Over many years I have made plenty of money trading but if I was to to a tally of trades i know the vast majority of the profit came from long trades or trading volatility and a lot of the losses came from shorting. Shorting can be difficult.
Why? Well in a longer time frame there is one critical but simple thing that should always be kept in mind. what are we trading?
We all know what a p/e is……but it’s worth reminding ourselves.
“The P/E ratio is, in one sense, a reality check on just how high the current market price is in relation to the underlying profit that the business is earning. Extraordinarily high P/E ratios are justified when investors think that the company’s EPS has a lot of upside potential in the future.”
It is the value market protagonist’s are prepared to pay for what they PERCEIVE are future earnings.
Yes, the critical word is PERCEIVE.
We are not really trading in underlying companies most of the time. What we are trading is perception. Yes people’s emotions. People are difficult to predict at the best of times so there is nothing to say whether the p/e should be 5 or,in fact, 55.
That is a good reason to take John’s analysis very seriously. It is based on how natural forces influence people’s emotional state and how they behave; however, some of the longer term analysis is very difficult to trade with as timing can be difficult.
Look at this graph. The solar peak effectively took 4 years to top out and the market doubled in that period. NOT 2%, NOT 10%, NOT 50%……..DOUBLED!
I believe it is vital to treat shorting a market with extreme respect. You need tight stops and price confirmation. We have no price confirmation yet to the downside. To augue that the move will happen so rapidly that you won’t even get on is possibly true but very unlikely. Single events rarely move markets for any length of time. If we are talking about “force majeur” then to trade for it is irrational. It would be like building a nuclear bunker in your garden then living in it on the basis that you wouldn’t have enough warning of a nuclear war………madness.
IMHO one should treat “shorting” like the ocean! Treat it with respect; understand that it is wild and has temendous unpredictable power and therefore, tight risk control should be employed.
By the way, I will be looking for an opportunity to short the SPX at some stage.
Will
Hi Will,
I agree 1929 = 2000 but in that case 1937 = 2008 i.e. that big drop is behind us IMHO.
Kerry
Allen I have to agree that MA’s writings are very opaque.
I don’t think the problems we have are about Adam Smith’s concept of free market capitalism. The non-level playing field you reference is NOT because a failure of capitalism (competition as defined by the invisible hand) but due to lack of competition because of centralization; rules, regulations and unfair laws. The current economic structure resembles fascism where crony capitalization is in bed with government. (Example of revolving door of Goldman and government.) The FED was created because they DID NOT WANT competition. Banks were privately owned and one had choices. If the choice was bad; the banks went out of business. As a corollary, then, big banks, wall street, lobbyists, a corrupt congress, etc. try to quell competition. When you have a dishonest money system at the top–
playing ‘king of the hill’–the accompanying corruption and parasitic practices filter down the chain until it kills the host.
bullish perspectives here are useful as consensus indicator. Sounds a liitle bit like the shorts at 666 or the consensus majority in 09 talking their book and either not closing their shorts or only reluctantly closing them telling everybody there is more downside. People here are getting overly focused on the stock markets. There are other ways to make money in an upcoming stock market correction which have played out: long tlt, short euro and short oil. All 3 assets going down are pointing to deflationary pressures building in the system which the equity markets can only hold up against for so long.
Hats off, the discussion here on this forum is probably some of the most intelligent I’ve read anywhere on this planet. And John is exceptional as always. Thought I’d chip in a bit on numerology after what Andre and Kerry have said. According to the Metonic cycle, the start of this 18-19 year cycle should be 2007. This is based on the Hebrew calendar, btw. We’re in the eighth year and the peak should be around the 11th year which is 2017 thereabout. Talk about coincidence. And the I-ching 60 year cycle also points to 2017 as being the turning point but this is based on China’s natal date. I smell confluence.
Luigi,
Welcome aboard; your contribution can only make this site even more special. I do believe 2017 will present a great buying opportunity and possibly the start of a new bull market. Gann thought that 7 was an important number. 7 times 17 is 120, twice an I-Ching cycle. Coincidence?
Cheers,
André