

A double top here on the SP500 or another breakout to new highs? Below shows Aug 8th was another channel hold, so is it bull-business as usual or has something changed?

Source: Stockcharts
The vertical dotted lines show the last two times Nymo surged from oversold to overbought like now: one chopped sideways and one retreated. The CPCE and Vix indicators show that there were some changes under the hood in the last couple of months: possible capitulation in the Vix and big volatility in put/call. These developments may have meaning because the Sornette bubble end flagged at that time:
 Source: Financial Crisis Observatory
There are also several negative divergences now in place in breadth, bullish percent and volume, with the July peak:

Source: Stockcharts
Volume has been particularly weak on this rally whilst continuing to be dominant on down days recently. The relevance of that is shown here, i.e. often associated with significant peaks:
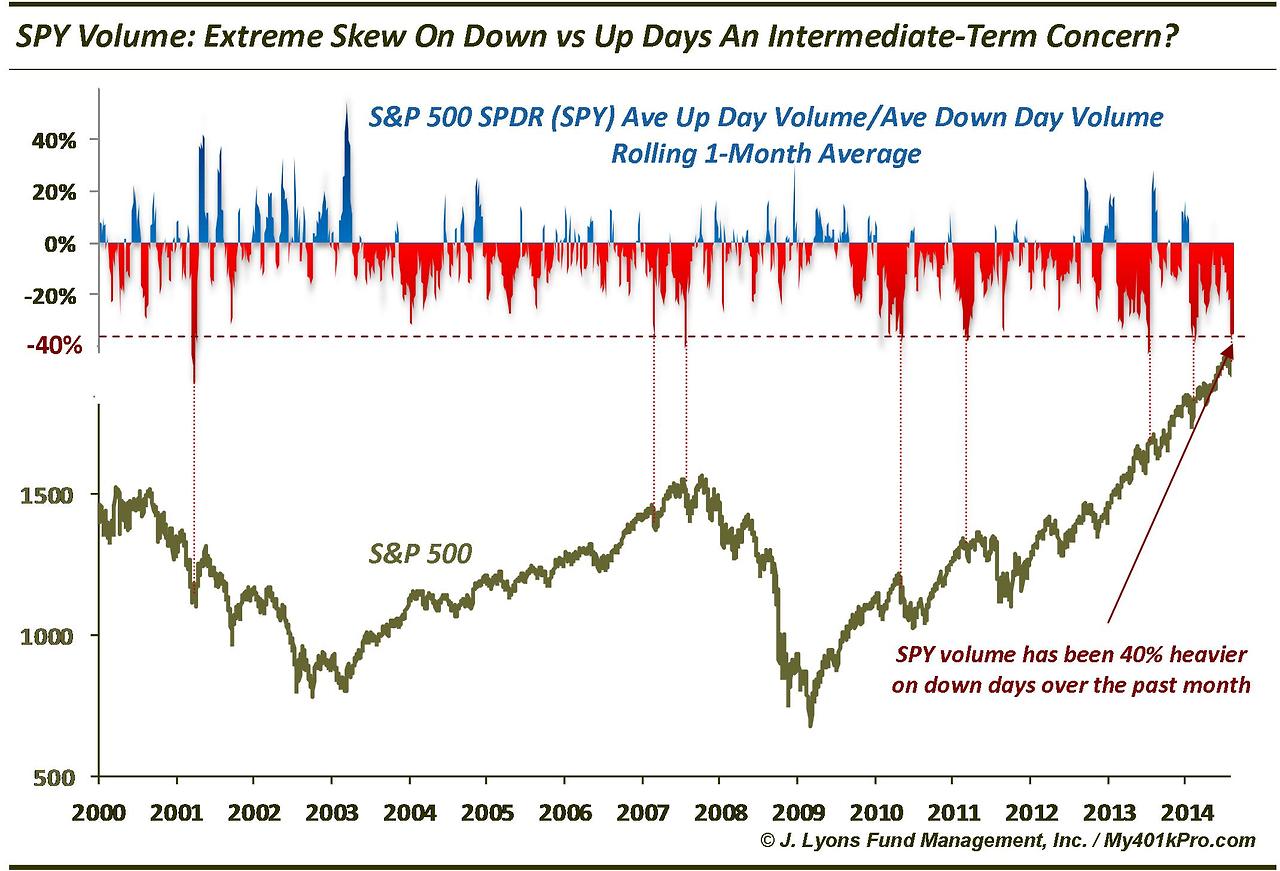
Source: Dana Lyons
Trin closed low yesterday at 0.5 and suggests sideways chop then pullback may be next, previous occurrences in yellow below:

Source: U Karlewitz
The new moon is on Monday and therefore we might expect the markets to roll over after that.
The European markets were weak yesterday. Below is the German Dax performance relative to the SP500 over time. Such notable divergence has previously been associated with major peaks:
 Source: @Market_Time
US small caps underperformed yesterday and the Nasdaq gave back all its day’s gains in the last 15 minutes.
In summary, the stronger case is for the rally to end here. A marginal higher high on SP500 would not negate that. Around this weekend’s new moon is the most likely scene for that to occur if it is to. But effectively a double top, with indicators and divergences calling for chop-then-retreat or just retreat. The two longer term charts above add to the comprehensive case for this being a major peak, and along with Rydex, II sentiment, Skew, sector rotation and risk-measure peaks call for the top being ripe or through.
The evidence still supports the sequence of events: risk peaked 31 Dec 2013 (HYG:TLT, INDU:GLD, XLY:XLU and more); speculation peaked Feb/Mar 2014 (smoothed solar max, margin debt, IBB, SOCL, RUT) and the topping sequence completed in July (European indices, Dow, Sornette bubble, various indicator completions). So the last week in August – next week – is important. If it is an up-week then it will cast doubt on some of those peaks, if it is a down-week it will further cement them.
The united picture of solar maxima and valuations and the relevance of 1937 to now:


Thanks once again John.
Interesting to see the divergence on XIV and TVIX.
http://stockcharts.com/h-sc/ui?s=XIV&p=D&b=5&g=0&id=p80391032342
From an odds based perspective, even though I closed my bear the other day, I still believe that it is likely that this quarter will be down. So given that, as I have stated a number of times, the major rally for mid this year should exceed the move of year 2010, which would be above 2020. I would like it to get above that level very quickly which would give another short position which could run potentially down to 1850 into the end of Sept.
So if we get a continuation rally then Sept is the probable dodgy month.
1st Oct is the start of the sweet spot in the Pres Cycle. By my reckoning anyone who shorts the market aggressively in that period is batting against strong historical evidence. I certainly wouldn’t.
If one is looking for a break down soon. Then looking at a 4hr chart, as I do, then you need a close below 1985.4 as a start. That is the top of the value area of the previous top.
The price action in the precious metals is suggestive of a large move soon. The bollinger bands are at the same tightness as previous large moves.
I expected bears to defend the 1980s a bit more. Likely bulls make attempt at SPX2000 this week. This will be the second attempt. Bears should resurface before it powers through. Bulls should be third time lucky though.
No material change in currency markets short of the low volume “ramp” in USD and coresponding “spike” higher in USD/JPY ( as cheaply borrowed Yen is converted to USD and in turn used to purchase U.S denominated assets )
Looking at John’s lunar schedule I see currency markets setting up for the same.
It’s very difficult to “trust” any usual indicators during these periods of low volume as price is so easily pushed around by the Wall St fat cats.
Call it a “new high” in SP or a double top perhaps……both essentially the same thing here – with respect to volume being so low. $Indu (Dow) setting up for a “lower high” and non-confirming.
It would only make sense this has ramped into month end area as well Jackson Hole as the “U.S illusion” continues on.
The NIkkei has now retraced a full 78% from the near term term lows of 08/08 and is now “perfectly set up” for reversal and the next “larger wave” lower.
also series of lower highs in place for usd/yen which adds to bearish case. Rectangle pattern now in place for usd/yen that targets 97 on a break of lower support. Good thing also we see volatility in fx increase the last couple of days which as you say should lead the equity markets.
Bang on Pegasus.
The summer has been brutal as forex markets have more or less been at a standstill while this “retail distribution” plays out.
The break of 101.20 area ( lowest of the range ) in USD/JPY will represent the tumble in global appetite for risk.
A long slow haul here but…..as per the macro analysis here – we shouldn’t have to long to wait.
Stephen Suttmeier of BAML points put that this is the 5th-longest S&P 500 streak above the 200-day MA going back to 1928.
The S&P 500 Index moved above its 200-day moving average on November 19, 2012 and has not closed below it on a daily basis for 21 months. The record is 30 months between 11/25/1953 and 5/23/1956.
The last time we had a streak of 21 months was between 7/27/1950 and 4/30/1952, which coincided with the S&P 500 secular bull market breakout in 1950. The current streak is part of the secular bull market breakout in April 2013. This 21-month streak for the S&P 500 above its 200-day moving average is another similarity between the current secular breakout and the secular breakout from 1950.
Parenthetically, these are Stephen’s sentiments, not mine.
I do think the “secular bull market breakout” language is interesting in the sense that this was John’s original case before he studied the negative effect of current demographics on markets.
Short term – most likely break upwards with this stronger bounce and we have seen several times their intraday move (last friday & yesterday – a quick drop first and then all the drop has been recovered – all bear trap)
Very short term (today & tomorrow) – sideways or mildly down (again bear trap) as double top and break up before the labor day long weekend.
Long term – (Sep & early Oct) bullish due to Alibaba biggest IPO in mid / end of Sept. China will launch its thro China scheme in late Oct
I have take 2000 high analogy as a reference, (Mar 24 first top and Sep 1 second top, 160 CD apart) Presuming July 24 is the first high or wave 3 top, then the final top should be around Oct / Nov, with no more tapering market need to step on its own foots, those banksters will dump hardly and force the Fed to qe again or delaying the interest rate hike cycle.
I am a bit afraid of action in gold. It has to find support on rising trendline connecting December and June lows, around 1270 price level. Reversal from that trendline may be coincident with top in S&P. Breaking 1270 level may signal bear is not over in gold but I still believe it is less probable scenario.
Next week (again next week!) may finally turn the tide. USDJPY action is very frustrating for both sides. Probably it will finally crash but all short sell stops might be triggered before.
I agree with Will’s comment on past comparatives.
Anyone who remembers 2000 will realise the extremes
in valuations in the tech sector, as an example,
were far more ridiculous than anything currently.
So talk of markets being broken, crazy, rigged, it’s
pretty par for the course in a late stage bull market
cycle, just in my view.
Having said that I raised cash this morning selling some
holdings, remain about 50% invested.
The bulls remain in control, for now.
Solar maximum speculation peaks:
1989 solar max Nikkei p/e>100 $NIKK
2000 solar max Nasdaq p/e>100 $COMPQ
2014 solar max R2K p/e>100 $RUT
So the R2K, and Biotech Index at p/e 160 at peak, have satisfied the extremes in valuations.
Bloomberg has R2K P/E at 52. I wonder what is the normal P/E for R2K though. It was 30ish in 2009, so perhaps it is always higher due to R&D companies that will make a ton in the future but not now.
What were the P/Es in 1969? I know Nifty stocks had triple digit, but not sure broad averages showed it.
This is the R2K valuation if you take out companies that don’t make any money: https://solarcycles.files.wordpress.com/2014/05/1ma7.png
It could well turn here John,
what I find more difficult to see is
this marking the definite top, there
may be one more leg up following
a corrective phase.
Enjoy reading your thoughts and
the various contributions.
DJT and RUT not joining in today.
Nasdaq hit Demark exhaustion yesterday and SP500 should hit tomorrow. Demark sell signals haven’t been too successful in 2014, so let’s see.
It’s blown through 17000 as I mentioned on a previous post so would be looking for a top today or tomorrow to form the double top. Would need to see a 10% drop from that to really have any chance of this bear market really happening this year.
No, John, they haven’t been, and not just this year. I can tell you that, lol. Saying the effect of Federal Reserve activities is the reason may very well be true, but doesn’t really help the cause. We’ll see if the wind down of QE reverses the poor record Tom has put up over the past couple of years.
David Saks of the Federal Reserve of New York gave a speech late last year where he said “Nevertheless, balance sheet policy can still lower longer-term borrowing costs for many households and businesses, and it adds to household wealth by keeping asset prices higher than they otherwise would be.” So the Fed is under no pretense markets are normalized. What is surprising is the degree of apparent investor comfort with what might happen to prices once we do return to normality (or, at the very least, terminate the latest QE program).
Biotech finally turning over. Should be leading the market.
I, for one, have been very surprised by the strength in the rebound in the junk bond market, and it makes me very cautious about going all in on a bet that markets will fall. I’m not saying we won’t get that decline, more that I’d like to see some anxiety creeping into bond markets. So far, I haven’t seen evidence of it.
I still feel that rhe break higher from the symmetrical triangle is likely a “fakeout”.
I disagree with those that say this market is not as exteme as the dot.com bubble.
This market by many more parameters is much more extreme.
http://finance.yahoo.com/blogs/talking-numbers/dr–doom–tech-stocks-even-more-overvalued-now-than-in-2000-134456190.html
And………
http://finance.yahoo.com/news/-everything-seems-expensive—valuations-today-are-worse-than-in-1999-142136809.html
Short term technicals are favouring the bear …. now time to growl!
Talking about precious metals…
“That something was the orchestrated and historic price take down on Sunday evening May 1, 2011. By May 11, silver prices were manipulated lower on the COMEX by $15, or a full 30%. Later that year, silver prices were manipulated lower by 35% in a few days once again. This was a last ditch effort by JPMorgan, the CME and the CFTC to break the back of the silver rally and end the developing silver shortage. That it worked is beyond question, but so too did it confirm a silver conspiracy like never before.
The two separate 30%+ silver price declines within days in 2011 were also the two largest price declines for any commodity in history. Please think about that for a moment. Had any stock or bond or currency market crashed that much in a matter of days, would there not be some public assurance as to what took place from any regulator or exchange involved? If any other commodity had fallen as dramatically as silver fell (twice) in 2011, would you not expect the CFTC or the CME to comment on it? Yet, to my knowledge, neither has uttered a word to this day. There’s really only one plausible explanation for why the CFTC and the CME have been silent on a most unusual commodity price movement(s) in history – they were both in on it.”
http://www.marketoracle.co.uk/Article46442.html
Let me also say that with respect that I totally disagree with those that say that the Fed is not responsible for this market.
Artificially low interest rates has been the fuel for the greatest speculation in history in every sectot of finance and investment, from art, antiquities, real estate, shares, junk bonds, you name it.
The Fed failed to learn from the collapse of LTCM that lead to the dot.com bubble, then the real estate bubble and now rhey have created the father of all bubbles.
This will end like every bubble in history only this will be miltiples worse than any before it amd the blame lays squarely on the Fed.
Irresponsible beyond belief!
DEFLATION! Is it possible? This is in ref to Ericks post. Dick Stoken wrote a book, Strategic Investment Timing, on how to time the market. It was based on a rise or drop in interest rates. In an inflationary environment it took a large rise, and a deflationary one only took a small rise. The key is that there was only one time the interest rate and inflation did not work, during what he called a deflationary spiral. That was 5% deflation and it ocurred from 1930 to 1932 – the infamous 90% drop.
Are we having anything like that? Yes, commodities are getting killed. Oil is in an incredibly precarious technical position and gasoline has a monthly gap down. Interest rates are at depressionary levels. Europe actually has deflation and recession. Has the debt service on the record level debt finally reached beyond the ability to service it? This would mean a drop would be based on absolute underlying fundamentals, a virtually invisible black swan. Wall St. Largely believes the FED and other central banks are in control. Something like this that showed the invisible hand is actually in charge would cause a dramatic panic. I believe this is the bearish case. If not, we are in a repeat of a new secular bull mkt like the 1950’s which seems impossible but the bull refuses to relent?
Seems that almost everyone is a US stocks bear now. The time to buy something is when everyone is queueing up to sell it. If gold cannot regain 1283, and SP500 holds 1987 over the next few days we’re going to witness a real bubble is US stocks. SP500 will be heading above 3000 in a little over a year from now (with corrections and much volatility in the meantime).
Surging Philly Fed; surging PMI; surging BDI; excellent continuing jobless figures. All of these are being largely ignored.
The FED’s hawkish rhetoric was hardly unexpected. Investment capital is flowing from the EU negative interest rate environment to higher US rates; and from the threat of EU bail-in to the perceived safety of large US stocks and the dollar.
And the sun – there is no evidence, yet, that it is falling away from its maximum. Compared to previous weak solar cycles, SC24-induced speculation is unlikely to wane until late 2015.
Thanks Mark for the last line, I was waiting to hear from you :-). I have done lot of study on historical patterns and sector rotations over last several years and I strongly feel the real bubble is yet to be seen and I also think it could be up to End 2015. In between I do expect swift/sharp correction around Oct 2014.
Someone who has seen dotcom/IT stock prices in year 2000 (I have seen) would know what bubble means. Those who say history never repeats are in for another shock :-).
What was the general opinion on stock markets back in late 1999/early 2000 Jigs?
The reason I ask is that I was renovating houses in the UK in the years leading up to the house price buble – and when I was getting out, saying that house prices would fall, everyone laughed at me – literally! That’s my impression of how a bubble feels!
On SC24, you might find it interesting to look at the bottom chart on this page of Jan’s website, where he shows the SSN for the average of the weak cycles: http://www.sibet.org/solar/index.html
That final little peak, which typically marked the end of speculation in previous weak cycles, corresponds to August 2015. Is that in line with what you are thinking?
Thanks Mark for Sibet’s SC chart. If this average of weak cycle logic is right for future SC trend we may see topping of US Equity around Aug 2014. I personally think Nov 2014 to be equity market peak based on historical pattern I follow.
To compare with 1999 let me give you some stats.
At the peak of March 2000 prices 1999 (historic) PEs of bubble leaders – Cisco 100+, AOL/TimeWarner 200+, Oracle 150+, Nortel 100+, Sun 100+, JDS Uni 600+, Yahoo 600+ and so on. Even some smart people used to say yes indeed we are in bubble but I will get out before stock doubles I am not here to hold stock for ever but I want to be in this game :-). We may see similar PEs for social network/e-commerce companies this time?
http://stockcharts.com/h-sc/ui?s=$$EMPLOY&p=W&st=1994-12-14&en=today&id=p93522253675&a=358956170&r=1408651956288&cmd=print
nearly over
3000 is what the DOW is going to and how in the unholy dark region do you get that everyone is a bear now?
http://stockcharts.com/h-sc/ui?s=!ASETBEARI&p=W&yr=15&mn=0&dy=0&id=t84666692957&r=1408652345082&cmd=print
Allan, I am going on what I remember and that
was complete madness, there is no other time
for me in my 20 years plus in markets that
compares to that.
The stats may say differently, I will defer to John on that.
However, even now you can still find some decent UKX
companies like BT.A selling on multiples which are not stretched.
Earnings remain strong and earnings are overlooked,
yes QE has helped earnings.
Without earnings compression it’s very difficult to see
large declines, just my take.
Look at the increase in dividends paid out by listed
companies in the Euro area over the last 6 months.
Phil, record dividends and profits have come at the expense of wage earners. Figures that I saw a few weeks ago showed that wage growth after 2009 has been the lowest ever following an economic downturn.
How much longer this disparity can continue is anyones guess, however the point I was making in previous posts is that this wholerecovery has been Fed driven via cheap money.
It is not, to use a phrase that I do not use often, as a result of organic growth. It has been driven by speculation from cheap money and artificially low rates.
It will end in disaster.
keep it simple, just look at the daily/weekly charts, very bullish
Kent, on deflation, I think history shows the FED
has always created inflation, when in their assessment
they need to, and this time will be no different.
They have taken extraordinary measure to do so,
and this will happen time and again.
They’ve used all the tricks in the book to make technical traders “think” a top is imminent or that a crash is about to happen for the last year +…however all that happens is a “ramp” to new all time highs each and every time…no reason to think they won’t continue that same old play book. They know every indicator a bear is looking at and to think they don’t know how to manipulate it to their will is folly. Sure, “some day” we may finally drop 5% but the bears will be penniless by then and they’ll again JAM it right back up. Same ‘ole story right now.
Allan, I appreciate that and have looked at the stats
on corporate profits as a % of GDP, so completely agree.
My point is that until there is some change in the dynamic
which is so supportive to earnings, this helps to underpin markets.
To me we still appear to be in a sweet spot, all be it towards
the end of this period.
I have cash available so lower prices would suit me,
not holding my breath on this one.
We can measure whether stocks are in a bubble: price patterns, valuations, leverage, sentiment, allocations. The current market checks all, and broadly-speaking only has the dot com boom to look up to from here. If you think stocks can go much higher from here into next year, then it would become the biggest mania of all time. 2000 and 1929 were demographic peaks and economic boom peaks. This is neither. Why is there little main-street buzz about this bull market? Because of demographics: it is a low participation thin volume bull. As per 1937, stocks can run up to dizzy valuations on low participation, but we can gauge its likely termination, which is what I’ve been trying to demonstrate on my site.
Do you think we might reach 2009 lows? In the 1937 example, we did not reach 1932 lows. With the 2009 lows so close to 2002 lows, if we did go there, this could arguably be worse than 1929 in terms of time to regain highs.
Deflationary demographics and secular valuations lead us ultimately lower than the 2009 lows.
While I do not think it is likely based on normal markets, I do think this time is different due to globalization. Regarding demographics, are you looking perhaps at global demographics perhaps country weighted by trade or GDP?
Japan demographics peaked in 1990 but did not spread to SP500. China demographics peaked in 2013 — but is this time different due to trade?
The demographic trends are individually down in all the majors, collectively unprecedented down
Just thinking out loud, 1929 — US was an Emerging Market turn Developed. 1990 — Japan was an Emerging Market turn Developed. 2012 — China was an Emerging Market turn Developed.
Inputs to an economy are labor, capital and technology. An emerging market uses the most labor. Why would demographics affect developed markets that uses more technology? Nikkei crash in 1990 was isolated.
This is where I have trouble taking the crash onto the US markets. One solution I have to remove this mental block is globalization.
Also, to be fair, not many here are saying much higher. I am looking at 9/1/2014 peak in phase with the 9/1929 peak or 9/2000 peak. If so, perhaps about 5% more.
I read a long time ago that the Dow had a 6% yield in 1937 which was used as a justification of virtually no risk. I don’t know how to verify.
I do not think anyone disputes that what we are
currently seeing is the later stages of a bull market.
You can argue if this is cyclical or secular and the
likely duration and % decline that will follow.
Something needs to happen to change the mood music.
This may be yet current unknown or a sudden heightened
focus on some of the current issues.
Until then, and this could be imminent,
markets appear to remain strong.
Do bubbles double peak? I do not have any examples in history where they do. Yes, we see double peaks in the SPX in 1990, but the bubble was in the Nikkei. We have a double peak in SPX in 2000, but the bubble is in the Nasdaq.
If you believe this is a double peak, the caution could be that the bubble is elsewhere.
John, do you mind reading out the other years for the CAPE/BAA peak? Or perhaps post the chart data?
It seems to peak around but not really at the 1946, 1959 and 1969 solar maxes. I find that interesting if the fit is good, because I do not know what was the solar max crash of 1946 or 1959. The crash of 1969 was the Nifty Fifty bubble. If the peaks line up, it would add credibility that every solar max had some sort of a peak.
Not my chart, but I read off 1946 1956 and 1965
Thanks. 1946 and 1956 do match the solar max. I wonder what the trade would be if I were alive back then. Short bonds and buy stocks?
Bears are like a frog in a pot with slow and steady increasing water temperature.
The status quo of having not much reasons to sell or buy (aggressive) continues for long term investor.
Gold and treasury price action are saying central banks’ policy are holding up well.
Until fear returns, all divergences are just noise.
My tiny scout short positions (bought for bragging right) are losers. Telling me to hold on to all my longer term big gain. This is the reality.
Close at SPX1991?
S&P advance from February intraday low (1738) to April high (1897) was 159 points. If this was wave 1 of impulsive move then we may deal now with wave 5 from Aug 7th low of 1904. Typical relationship is wave 5 = 0.618 of wave 1 which would give 2002 as the top, possibly tomorrow. Another typical relationship is wave 5 = wave 1 but I do believe it can travel so far. So it is quite possible that tomorrow may mark top of some kind. This last advance from Aug 7th has all characteristics of final wave 5 as it seems to be based purely on hope and internals are very weak. Gold may retest 1270 tomorrow. We will see what happens next week.
Another wave pattern observation strengthening my imminent bearishness is that I see last S&P impulse from February 1738 low as wave V of larger impulse developing from November 2011 low of 1158. I count Nov 2011 – Apr 2012 advance as wave I measuring 264 points. Adding 264 points to S&P February low of 1738 (wave IV low) we get exactly 2002 as top of wave V. That would give us equality of wave I = wave V in the larger time frame.
This and above cited smaller relationship of wave 5 = 0.618 of wave 1 in wave V giving also 2002 are keeping me on bearish side.
If above observations have any meaning then S&P 2002 level may prove significant.
I could not resist but to cite Bloomberg headlines tonight : “S&P 500 Tops Record, Nears 2,000 Amid Confidence in Fed”. This shows how fake and illusory that bull is. However when stock market finally crashes this or rather next year we should see hunt for the scapegoats and this could be global phenomenon
Is the presidential cycle then broke? Even GMO bears think market goes up next year = Y3 of Obama.
Bunell: You made several great and valid points. My EW count is in agreement with yours. The SPX move up today in theory has completed the wave IV impulse move. Top is either already in today, or might reach tomorrow, before retracing hard. I think SPX will ultimately reaches 2000 but will immediately retrace. It would be hard for SPX to reach that milestone then keeps chugging up after just the first try.
Gold is a tricky one. I think it has confirmed a failed daily cycle today. It’s very possible that it could form a short intermediate cycle low today, or it could enter a volatile phase of counter trend rallies and generally lower price that drags out for a couple of months. Each rally drawing in bulls too early only to roll over and make a lower low.
Some very interesting posts folks.
Newt, bull/bear positioning does not need to be adversarial
or permanent, I can switch positions on a stock
in the blink of an eye – well almost )
Agreed. There is no such thing as perm bear or perm bull. We are bear or bull to gain profits from market movements. Another observation is that the markets may change trend after Yellen’s speech tomorrow. Either the Dow may retrace imminently to/below the April low 15,400 or starts a minor correction to 16,200.
timing wise we are rolling into the Gold bubble price peak of 3 years ago. It would be ironic if the S&P 500 would change course in this window as well.
Gold was not in a bubble as the mainstream media want us to believe (e.g. Priceline shot up over 10 folds in few years, no mainstream media called it a bubble). Why did gold imports into countries like China and Russia accelerate in the past few years?
Here is Breaking News: CDC caught in scientific fraud. It has gone viral on the internet. http://www.naturalnews.com/046537_vaccine_violence_black_Americans_scientific_fraud.html
Mike Adams of Natural News says that he has the documents to prove the fraud and will release them in a few days. “What we are looking at here may be a criminal conspiracy of the highest order which, once fully exposed, will absolutely destroy the credibility of the Centers for Disease Control.”
My guess is that this is when they will allow the Markets to finally fall as a distraction to this disaster and so many other disasters that the PTB Psychopaths have manipulated for their own benefit at the expense of the people. Merk would be a good stock to short.
Hi John – Thanks for your posts. Wondering if I’m looking at a subsequently revised version of the Sornette chart. http://www.veooz.com/photos/KHFN3N0.html
No the July readings just went much higher