
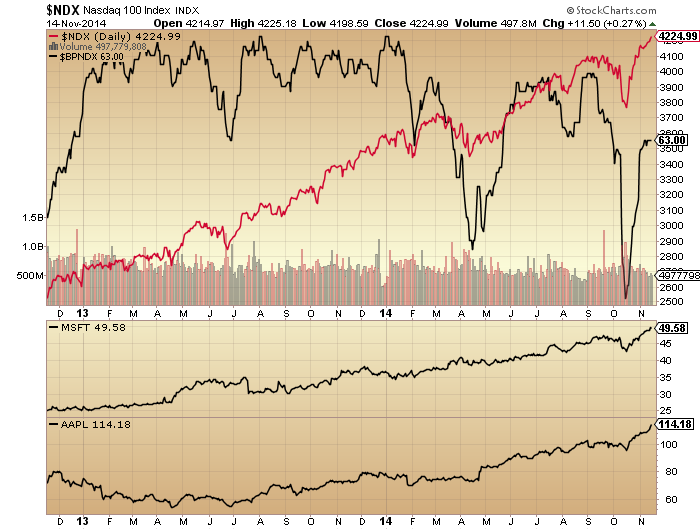
A doji on the SP500 on Friday, making for a week of sideways range. But there is one index still not slowing down, the Nasdaq 100. Apple and Microsoft are still in steepening uptrends, dragging this index higher. Note that these two stocks outperformed right into the end of 2007, later than most, so their rollover may be the last domino to fall. Unlike the other indices, the Nasdaq 100 is showing no major breadth issues, but does have divergences in bullish percent and volatility.

Source: Stockcharts
The longer term Nasdaq 100 chart does however show typical major topping divergences:
 So, I’d like to see large intraday reversals / voluminous down candles on Apple and Microsoft and in turn the NDX as a sign of a peak.
The last dominos to fall idea is supported by the bigger picture. Various risk measures peaked out in January, European stock indices and US small caps topped out around June, other global indices peaked out in September, and breadth has been diverging on the SP500, Dow and Nasdaq composite. Look at the Nasdaq composite breadth compared to the NDX, it now has 4 lower highs and lower lows over an 8 month period:

The Dow Jones World index is shown below. A clear double top and lower high/low, with divergences on this rally since the turn of November. John Li raised the possibility that US large caps may still need a ‘second chance’ peak given they have made new highs again, and I can’t rule that out, but on DJW this is a fairly typical second chance peak should stocks now roll over.

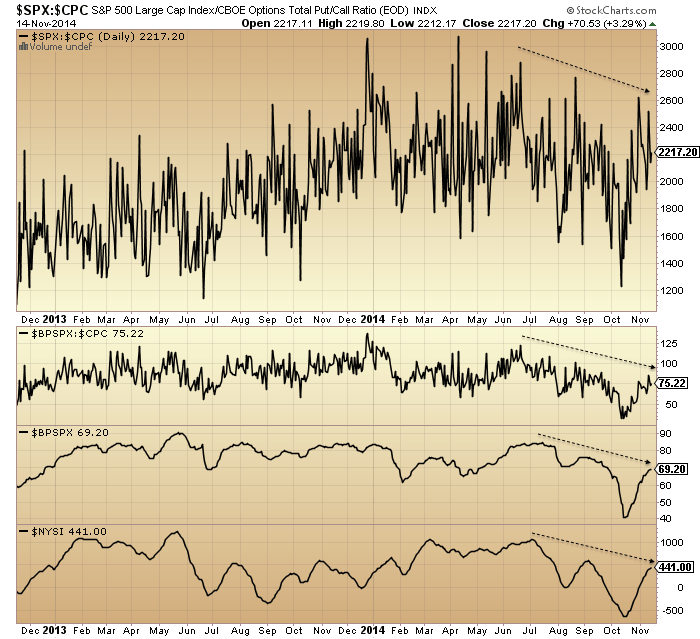
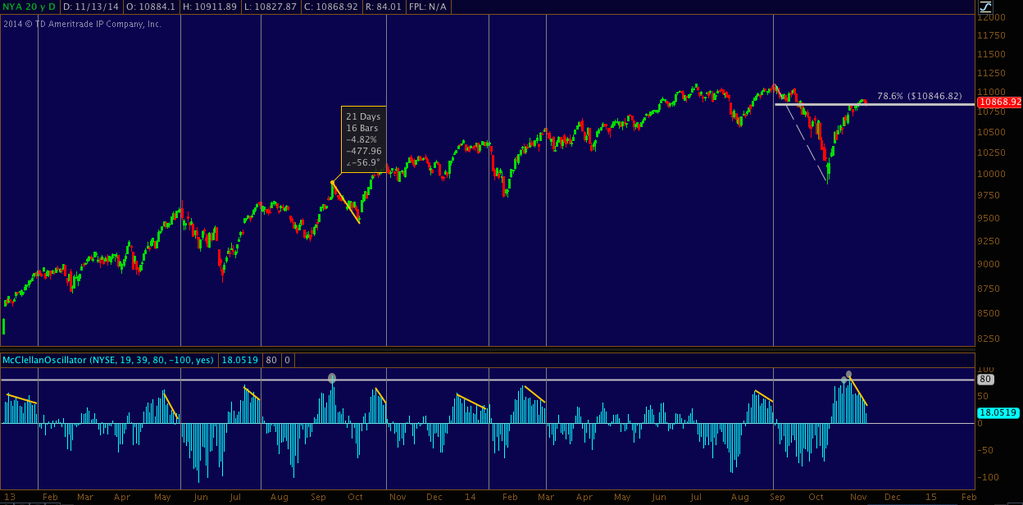
Here’s why stocks should be ready to now finally roll over. The McClellan Oscillator has diverged as it did at previous recent peaks:
Source: Andrew Kassen
ISEE put/call ended over 200 again on Friday, making for 4 prints over 200 in the last 2 weeks. These extremes are signs of topping.

Source: Andrew Kassen
Rydex allocations made a new all-time record at the end of Friday. Take a look at the Rydex history in conjunction with AAII bears and II bears history versus current readings:
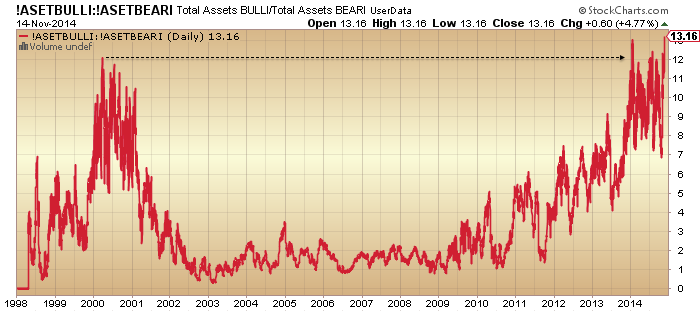


All at absolute extremes. If a bull market top occurs when there are no bears left to convert then these three proxies are screaming exactly that.
However, here is short interest, which appears to reflect the opposite:
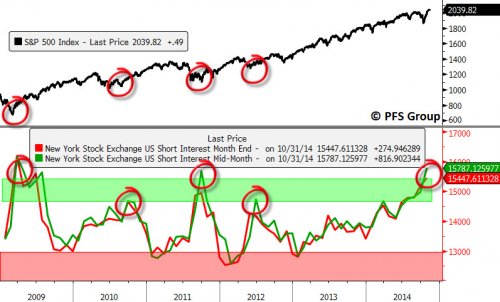
Source: PFS
Either this is supremely bullish, like previous major lows, or something else is going on. It should be clear that we are not at a significant low like 2009 or 2011, and the October correction didn’t get close to a washout in sentiment or allocations like the other two lows shown, so how can we explain it? Look at the rising trend since the turn of 2013 which is when the mania began. I suggest this is hedging. Similar to the persistently high range in Skew that has been in place.
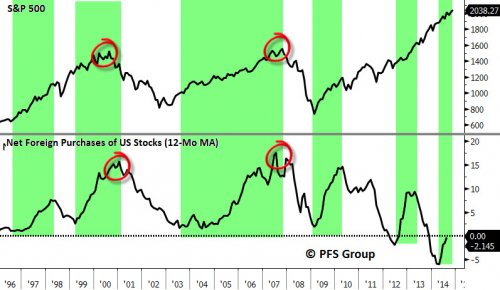
On a related note, look at foreign buying of US stocks, below. This also diverged from the turn of 2013 when the mania began. PFS see the current reading as bullish, but it should be clear again that something else is going on. Foreign purchases trended closely with the SP500 until the turn of 2013, after which they stopped tracking. Again the idea that this level is synonymous with a major low in stocks is clearly wrong. We know that buybacks and US retail clients have been the two main drivers of the mania phase and that leverage and allocations have been take to record extremes. We know that institutions have been net sellers in the mania phase and the below chart reveals there has been dwindling fuel from overseas too. Therefore, the combination of companies borrowing to buy their own shares back and retailers buying high and going all in on leverage is the worst possible foundation for current prices.
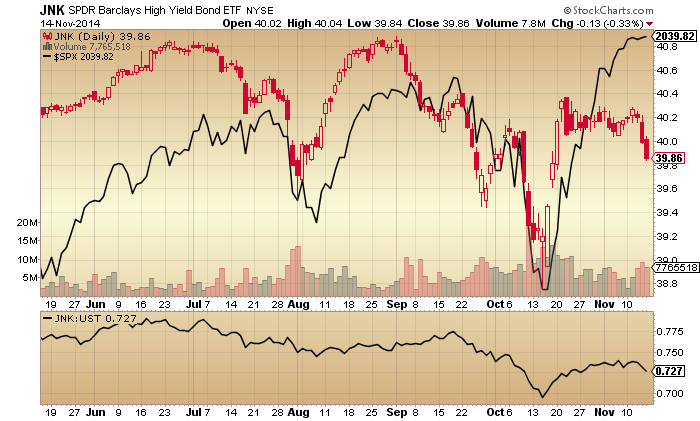
Treasuries rallied on Friday, precious metals burst upwards, and junk bonds had another down day. All these developments suggest stocks should be about to fall.
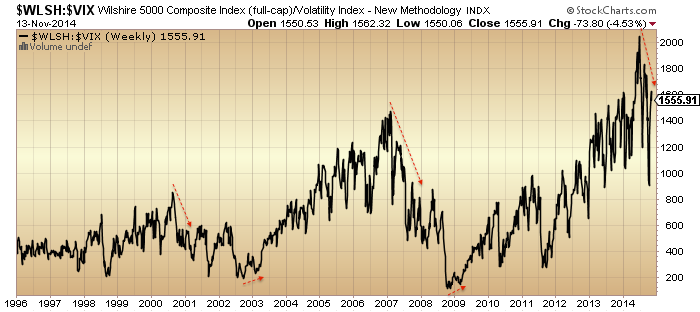
Vix rose last week and continues its overall divergence which again warns of a change in trend in stocks. Look at the similarities in stocks:volatility to the previous major peaks:
In short, I still think stocks will see a voluminous down day in the next few days and kick off the new and final leg down. There is no fuel for higher by various indicators above, so I believe the flattening out of the SP500 last week is the prelude to the next big move: down. I am not a fear-monger but given the incredible extreme state of multiple indicators, the ferocity and exhaustiveness of the rally since mid-Oct, and the large megaphone formation on US large caps, I believe an almighty crash is going to occur. In the last solar maximum mania of 2000, the Nasdaq’s mania from the start of 1999 to March 2000 was all retraced by the end of 2000. I equate us to November 2000 but here in 2014 we have postponed any true correction as the year has progressed, making for what may become a mega-correction right at the end of the year. How the mania reversed hard in 2000:

ECRI leading indicates for the US have dropped further. Their shaping level now mirrors 2011, 2010, 2007 or 2000: all significant market peaks.

Source: DShort / ECRI
Lastly, the Sornette bubble end flag remains at July for the SP500 and September for US Tech. There has been no rebubbling since.
 Source: Financial Crisis Observatory
Looking for an analog where the Sornette bubble ended before stocks made marginally higher highs and then fell, there are only a couple of examples from history. In 2007, the bubble-end flagged in June/July and then stocks made their marginal higher high on multiple divergences in October 2007. In Russia 1998, something similar:
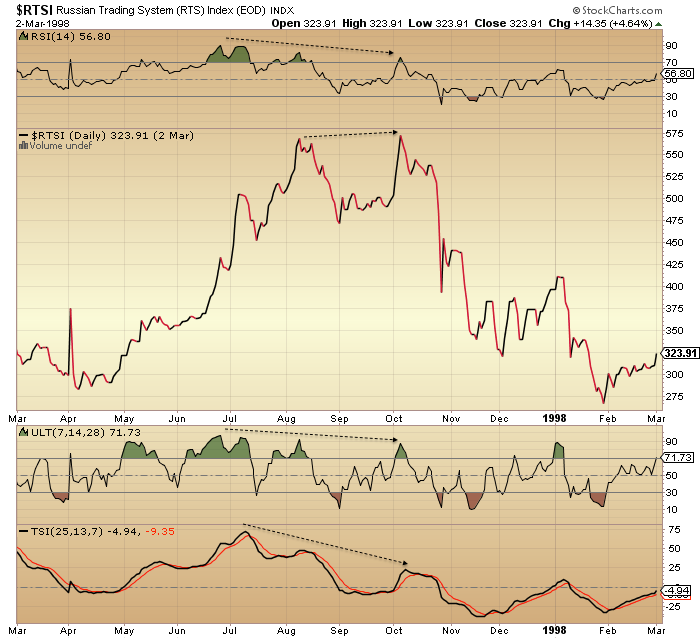

It was the same phenomenon: marginally higher highs but on multiple negative divergences. Same as now: a lot of divergences have developed since the start of July whilst we have gone on to make marginally higher highs.

So, it’s more support for the case that stocks should turn down here at their marginal higher highs in a final manner, rather than breaking upwards.
We have a week left until the new moon. Can equities hold up or even rally into then? Hold up with a few more dojis whilst we see further deterioration? Maybe. Rally? I just can’t see it when allocations and sentiment are so super-stretched. Rather, I still expect we will end November down and follow through on the large monthly October hanging man candle. That would imply stocks should fall before we get to the new moon. I am looking for a large red daily candle early next week, with the behaviour in gold, junk bonds, European indices and small caps last week as the lead in.

The dollar index on Friday gave a major clue to a reversal. Apart from John’s thorough analysis I’d like to add that in the futures market, S&P have show clear signs of weakness over the past three trading days. We just might have a black Monday or Black Tuesday next week as both days are “not good for the people” (literally)
And that hypothesis was left in a pile of ashes since you posted it. Go with the tape, not with what you want.
My forecast of last week is still valid. We are indeed in an important turn window between nov 15 and 18. Gravity is flat into Tuesday so 2 more days of consolidation. Expect a low on Monday and a last high (higher or lower) on Tuesday. After that it is basically down into mid December, with a v-turn around nov 27/28 for the first real low.
I maintain that after the December low there is room for one last leg up into February 2015 before the real party kicks off.
Happy to be able to confirm John’s analysis.
Andre,
Yes agree – next week will be down, following week UP, then the first two weeks of Dec down again – then the end of year BS rally. However there will be nO crash!
No crash this year you mean? Someday it will come!
Andre,
Correct, NO crash this year.
Agree totally. The mid year of second term statically very bullish at the end of Nov
Joec…
That is exactly my scenario; a decline into December to cool off overbought conditions. But after February 2015 everything will change imho.
Cheers,
André
Thanks Andre,
Some more background on why this weekend is pivotal:
1) I have 2 previous significant turns in S&P that both point to nov 16; that is a strong signal in Gann timing.
2) I have an astro timing that gives multi-week cycles, that points to nov 17
3) I have my own spiral calender – tweaked to the 109 day cycle stucture – that gives nov 15, based on the april 11 low with the 10th spiral : 55 – the most important fibo
4) the 109/110 day cycle turns nov 15; should give an inversion
5) Rare synchronicity between tides and the apogee cycle (both 15), confirming the start of a new 109/110.
6) lunar node turns direct nov 14; node cycles start with going direct. The retrograde is kind of a midpoint giving inversions. The north node completes 2 cycles by dec 14th while the apogee cycle ends dec 12. The october 15th low coincided exactly with the north node going direct.
What will the analysts say? Russia invading Ukraine?
Very big Bradley turn on the 20th also..
nicola2910,
I had seen that. But I use another astrotool, that points to nov 17 and seems more accurate. And 1 astro indication is enough for me.
Cheers,
Andr;e
Txs, Andre’.
thanks, Andre. Appreciate seeing that this expected turn has multiple components that arrive at the same conclusion.
Andre Gratian?
thanks!
Yeah we turned alright…we turned UP. Thanks for posting that “turn” window…..
This guess was dead on as it relates to today. He made the guesstimate on 11/15, which is either incredibly lucky, or you did have something to point you to a higher Tuesday. Either way, it’s the only post in 2 weeks that was accurate. I hope you traded long to match your view and made a lot of money for Christmas.
NICE CALL 🙂
To Andre:
This guess aboe by you was dead on as it relates to today. You made the guesstimate on 11/15, which is either incredibly lucky, or you did have something to point you to a higher Tuesday. Either way, it’s the only post in 2 weeks that was accurate. I hope you traded long to match your view and made a lot of money for Christmas.
NICE CALL 🙂
Thanks both.
Question for all. Who else is there who is calling the top on the myriad of indicators that I draw together? I know of Greedometer, but that’s black box, and there are 3 others who I follow who quote a lot of the bearish indicators but stop short of declaring short / major top. I’d like to know if there are any that I am missing who are aligned to my analysis. Thanks.
John Hussman basically called the top last Friday when be bought/rolled into ATM equity index puts for his fund. (See his fund notes.) Most other bears, eg GMO, are capitulated for various reasons, such as underperformance or positive seasons/presidential cycle.
Thanks for the shout out on the second chance. I don’t think the second chance has to be a buyable rally. It can be 1 week up in 1929, or 3-4 weeks flat in 2/1990. A flat scenario before and after Xmas (while off lows) could do the trick of making Hussman right regarding peak, while eroding his put time premium. Ultimately, he will still make a ton from the puts.
Regarding your 11/2000 analog, I place us at 9/2000, but I wonder if we will see an even faster decline. 9/2000-4/2001 was 7M. Isn’t that unusually long for a waterfall decline? The best solar analog is 1929 — 3M, and best zero rate analog is 1937 — 3M. 1990 was also about 3-4M. Any idea why 2000-2001 took so long? My point being, if this waterfall is faster than 2000, inline with historic norms, you could be right regarding the end-point being say 4/2015, but have to wait till say a latter 1/2015 starting point.
Just laying out the possibilities.
Reason for us being at 9/2000 is that that is the third local peak after the first wave down. You had mentioned we are also at the third peak of divergence or of world indices. This cycle is just stretched in time. 1998-2000 was just 2 years. 2011-2014 is 3 years. So even if 3/2000 and 3/2014 were aligned, time stretching of 1.5 times will bring waterfall to 9/2000 and 12/2014. That is, we should be around 9/2000 analog right now.
Is your view of 11/2000 from matching calendar months?
I haven’t found any correlation between the duration of the bubble to the duration of the waterfall. I fear that this waterfall will end a lot faster than 2000, despite a 1.5x longer wait.
Bradley 20th ..
Is this Bradley tank day as reliable as another poster here about Nov 15-18 turn date, because we did turn….we went UP.
Turn dates do not always imply down. Up is possible.
2014-11-20 (Thu) = Major Low (geo)
2014-11-21 (Fri) = Major Low (helio)
Yes, I am watching it with interest.
Nov 20th, Dec 10th and Dec 26th…it would still fit my expectation for a second chance pause in December, IF the peak is Nov 20th. The problem is that I don’t know for sure if the peak is Nov 20th. With some many buying puts and calls, could we be range bound until say Dec 10th or Dec 26th to frustrate all?
Bradley did not work in 1929 — the Bradley date was 7/1929 and we just blew past for 2 months. Bradley did not work in 2000 — the Bradley was also 7/2000….why is it always July? The Bradley peak was also 7/2014 — but that didn’t work for S&P 500, and now we are looking at the Bradley trough 11/2014. The record of picking tops is just not very good…I would suggest that Bradley does well at other turning points (tops and bottoms), except for THE top.
Bradley also didn’t work for 12/1989 — it blew past for one month, Nikkei peaked 1/1990. The list of failures goes on.
Second chance peak was 8/1937 — Bradley peaked 7/1937. Actually, I have yet to see Bradley predict a major peak. I spent over 40 hours going through the data. It does well at many places, such as the Nikkei bottom in 1992. I wish it worked…please let me know where you see it working.
The window of it working is 2 months, so it is not helpful if the Nov 20th Bradley date means a peak from then through 1/2015.
The Bradley method is a measure of the prevailing psychology of all humans on Earth, not just the S & P buyers. Since it measures mass psychology, its influence is best seen in the broadest measures – where it worked perfectly. The RUT topped in July, the NYAD topped in July, doubletopped in September and is headed down, and I’ll bet that even broader averages (Wilshire 3000, perhaps) also topped in July. Money managers have to invest despite prevailing psychology. As such, we can expect money manager favorites to keep going up (Dow Industrials, “nifty fifties” such as Apple, S & P 100) while the average stock slowly, inexorably wilts in preparation for a final vertical dive in late 2015 or early 2016.
nlv4, I tested Bradley on SP500 and found it statistically significant. However, it just never gets the major tops. I believe it is more to do with euphoria going on at the final swing up, but I am unable to test your hypothesis on the Russell because the data is not available in 1900s.
Well…at you’re honest about the Bradley tank thing.
Einhorn has been proclaiming big short positions, but is not convinced of total global markets failure.
Quite possible that big shorts will reveal themselves mid crash to prevent squeezing and fuel downward momentum.
AAII Sentiment shows you couldn’t be more wrong. There are almost no bears, hence there are almost no shorts. Indexes can rise endlessly with central bank liquidity.
Can they pull back at some point? Sure. But barely a blip, then rampage on up again.
Hi John. A top is in the progress of forming and will likely conclude in December. I have been calling for a short term high since November 6th in the window of 12-17 November, although i admit that i do not use traditional technical indicators.
As i have said to my readers just being right wont make you the money. It needs to be backed up with $$$.
Cheers
Daniel
http://tradingtweets.wordpress.com/
Your window has come and gone, and we move higher every single day….
Go long friend.
Denis Ouellet is not exactly calling the top but calling for increasing caution
http://www.bearnobull.com/
He has interesting valuation metric (rule of 20) and quite good track record.
Interesting week in prospect.
Better day for the gold bulls yesterday,
and admit that I thought gold was going down
hard towards $1,000.
John, I see your work as most closely aligned with John Hussman in terms of research thoroughness, historical analysis, and making the case for overvalued, overbought conditions. http://hussmanfunds.com/ I’ve found it difficult to find anyone else who comes close.
Hi John – I see the push into Apple as similar to the push into utilities and defensives. While helping carry the rally, it’s a sign that investors are looking to hide out in a name that can weather a crash better than most others. Apple would be that stock. I maintain my view that we are following the same pattern as we did after QE1/2, which is to move higher/sideways for about three weeks before a big drop. The wrinkle this time is the Thanksgiving holiday, which means we could see the drop start one week early or one week late. Either way, by opex in the third week in Dec, if the analog holds we should be 11-20% lower.
we also have japan Q3 gdp coming out next week, which could serve as a catalyst.
Thank you John. There is nt any doubt in my mnd that we are at the very least topping, but more likely have topped.
This recent rally from what I can see has no precedentin terms of % gain over time. The angle and gains of the ascent is remarkable, whilst the divergences have grown even greater.
Gold is signalling here very clearly.
I’m totally in on the “top call” and see the USD reversal Friday as the start of something “Much larger than most people expect”.
Currencies have been tough to nail down these past few weeks short of the obvious “smack down” in Yen…but as USD/JPY “is” this entire market – there is one place “we must see a big red candle”.
To answer your question, John: I don’t claim to have a handle on the entire spectrum of TA-centric sites/blogs, but to my (limited) knowledge you are the only analyst who has 1) been bullish prior to your current bearish analysis and 2) have clearly called a major top right here and now.
My hat is off to you for publicly displaying the courage of your convictions based on charts that are readily accessible to all. For my (small) part, this is why I distribute your posts to my twitter network (3.450 followers)–people need to become aware of your work, which is offered freely –something else that sets you apart from the field.
Appreciated Charles
I think in the term of a typical market move A-B-C so I can see a pull back starting very soon. The euphoric XRT says all consumers are happy so I don’t see a crash very soon.
Too many people believe the Christmas rally and the 3rd yr Presidential Elect. cycle(up year 2015) so they need to be punished before the market can go higher.
“I’d like to know if there are any that I am missing who are aligned to my analysis”: http://www.insiidetrack.com/
Errr…is the site really predicting in 2007 of a surge in sunspot activity in 2008?
Peter, I find Hadik’s writings to be rather opaque. Rather, I like someone who purports to teach me how to fish. Are his books any different?
Ecletic, agree with you on opaqueness of Hadik’s writing. However, I heard him in an interview with Ike Iossif of Aegean capital in 2007. The bearish camp had been routed as the mkt had just been motoring ahead just as now. In the interview, he made it clear he was still expecting a top. It convince me to get out which save me from a 50% drop. So I listen to him.
John Hampson, just one more and I will shut up.
The best analog I have is SPY/EWZ in 5/2008. EWZ is making new highs, while SPY was 2-3 peaks from THE peak. Today, the roles are reversed, with EM/World/Europe past THE peak, while it is SPY/QQQ that is making that higher high.
In the EWZ 2008 case, there was little 2nd chance rally but there is still 1-2 weeks of pause at the 50SMA that I can count on to get short. Since you are trading cash, I suppose it doesn’t matter, but if you trade puts, the time decay can be very painful. But this fits your view perfectly — there is no traditionally sharp second chance in 6/2008 EWZ peak, because it already occurred when other indices peaked in 2007.
My best guess is that 5/2008=11/2014, and so the peak would be near the start of 12/2014 — and it could be a double peak with lots of frustration. The multiple Bradleys, holidays, EOY tax strategies, fund flows, performance chasing, hedge fund liquidation re Calpers, FOMC, will all be cross currents.
We are both agreeing on a rapid decline very soon — just the nuance. I am for a more rapid decline (3-4M) than 2000 (7M) or 2008 (4.5M), which means the market has time to hang around for a bit longer for now, and still be on track to hit your scheduled bottom. Perhaps I am missing why waterfalls since 2000 take longer than before 2000 — perhaps regulations/decimalization have changed things?
You can agree about a decline all you want and somehow that makes you feel validated. But price trumps your predictions for 2 weeks straight. Moons. Bradley, etc. these are desperate attempts worse then throwing darts. What is the track record of these fringe indicators? Better to wear an aluminum foil hat. Keep calling for a decline like Marc Faber does every day of his life, one day you will be right out of 150 guesses….
The track record of the Lunar Edge is quite clearly illustrated by John’s Lunar Edge article on the home page. I have tested it myself and found that the market does usually move down around full moons and is more buoyant around new moons. The market does tend to rise into a speculative peak around solar maximum and the deepest declines are into solar minimums. Marc Faber has a Ph.D. from a prestigious university in Switzerland. What do you have?
Since 2007, an average of 25% of annual buybacks has occurred during the last two months of the year.
http://investmentwatchblog.com/why-stocks-are-soaring-even-though-the-fed-stopped-quantitative-easing-major-corporations-have-been-spending-almost-all-their-profits-on-buybacks-and-dividends/#1fyICBDMmb6p0l2X.99
Let’s all short on Monday. This is once in a lifetime opportunity to short. John, your argument is super convincing, I am in.
And when the BOJ blows you out of the water as they have for 22 sessions straight, when will you cover?….
My boys will cover for me. Dow can go up 1000 straight session. I’ll be like damn, that was fun.
A man who writes his own short only view of the market, has a fool for an analyst.
He says as the sheep go to the slaughter house….
Statically for 15 years, the 12th and 13th trading days of Nov vey negative. This year those are Tuesday and Wenzday next week
Good work LHL. Very negative is music to my hears as I am in RWM.
Did the markets ever go from an all-time high to a 6-month low and then back to a two month high in less than two months ? If Schaeffers Monday Morning outlook can be trusted, this has never happened before (data since 1928). And did it at least ever occur, that an index pulled back from a 52-week high to a two month low and made a new high less than a month after that? Yes it happened less than 10 times before 2014, but never more than once a year, while there have already been four occurencies in 2014.
It is no nonsense, that several indicators argue for a long term top and have been doing so for many months. But it is no nonsense assumption either that a long term top won’t occur in the near future as according to Goldman Sachs data stock buybacks in November and December have on average been accounting for 24 p.c. of the yearly volume since 2008.
As the 2014 market is indeed unique indicators that were reliable in the past will probably just continue to have no predictive significance, but only help keeping a resilient bearish sentiment alive.
There were 14 times that SP was at or near 52 week high and SP did manage to close above 5SMA for 20 or more consecutive days. 2 weeks after that usually negative but the intermediate term of 3 months or longer, returns were good. So if want to short, short now. If want to long, waif for the week after Thanksgiving for bottoming
For 10 years, if you long EUR on Nov 12 then square on Jan 12, always positive. Last Friday it was a bullish outside day. EUR above 1.250 and clearly marked a higher low since Nov 6. This coincidently with USD pulling back and SP correction ? The price action on Friday might change the landscape from now on when EUR, AUD, GBP and NZD moving accordingly with SP and USD did oppositely.
All Lunatics,
Those interested in Apogee/Perigee Standstill, the following is the Lunar Distance from Earth in km and its corresponding Speed from the previous day in km per day. Note how the distance differential from max to min varies by less than 1,000 km over 4 days at Perigee and Apogee. Also, the Lunar speed will accelerated from 0 km/day to over 4,400 km per day by November 20 (and was over 4,600 km/day for 3 days around November 9). SC
noon est
Date ACTUAL CHANGE
11/1/2014 368,550
11/2/2014 367,917 -633
11/3/2014 368,111 194
11/4/2014 369,270 1,159
11/5/2014 371,468 2,198
11/6/2014 374,673 3,205
11/7/2014 378,731 4,058
11/8/2014 383,381 4,650
11/9/2014 388,281 4,900
11/10/2014 393,052 4,771
11/11/2014 397,325 4,273
11/12/2014 400,772 3,447
11/13/2014 403,137 2,365
11/14/2014 404,261 1,124
11/15/2014 404,086 -175
11/16/2014 402,594 -1,492
11/17/2014 399,990 -2,604
11/18/2014 396,474 -3,516
11/19/2014 392,336 -4,138
11/20/2014 387,903 -4,433
11/21/2014 383,515 -4,388
11/22/2014 379,475 -4,040
11/23/2014 376,028 -3,447
11/24/2014 373,323 -2,705
11/25/2014 371,419 -1,904
11/26/2014 370,285 -1,134
11/27/2014 369,840 -445
11/28/2014 369,979 139
11/29/2014 370,612 633
11/30/2014 371,686 1,074
Apologies for all the #’s above running together, that’s not how I sent it.
SC
Thank you SJC. Have noticed pronounced weakness apogee minus one and plus two trade days and some weakness perigee plus three trade days. This is obvious from charts going back multiple years yet is punctuated by occasional strength sometimes unusual strength during these times. I guess this is tradable for apogee cause it seems to have rich predictive value cause many big down drafts occur around apogee which overwhelm the occasional strength. Would be interesting study to correlate SM performance with the above data.
The market has rocketed higher while you continue to short “Uranus”….
On the 18th Mercury is heliocentrically conjoining Uranus which may result in increased solar activity effecting earth.
Steve,
Interesting. Never seen these data per day!
Anyway; they seem to confirm my forecast; down from 15-18 into 27/28; coincides exactly with the roc extremes in lunar distance.
I assume these data don’t come from a public source.
Cheers,
André
SP historical and implied volatility so low , signaling a big move a head. The problem I don’t know which way, up or down ?
I re-iterate what I have said lots of times here!
Based on history we are likely to see a stronger up-swing in the SP500 in the Presidential second term than we saw in the first term.
Taking percentage moves as the obvious tranferable measure for the SP500
The equivalent fall in 2014 to Jan 2010 was 1730. You would expect smaller pullbacks as the Obama administration ratchets up the bull stimuli. In fact it got to 1737 – as expected.
The minimum next up swing would be 2020. Last time in April. This time the upswing in April 2014 was muted…..eventually it got to 2022 and then we got the 10% down drop which I expected.
Based on 2010 into 2011 we would expect a minimum upswing to 2340 now into 2015.
John points out there are various indicators which point to a top forming; The trouble is certain other commentators who i have great respect for have put forward equally compelling bull scenarios. The obvious person I refer to Chris Puplavs. He has been correct all this year although even he is becoming more cautious – as he should be.
As is always the case trading is always nuanced. Just as certain indicators are screaming sells others e.g. the the US short positions are a screaming buy!
So what do I think?
I am long at 1909 with a stop at 1990. The CBI of 19 told me to go proper long.
i believe John’s solar/demographic analysis will be proven correct but getting the timing correct is too difficult to use for trading.
I say, if this occasion goes against history and a crash occurs during this stage of the Presidential cycle then so be it – I will be stopped. I will not go short until next spring. In my opinion it is just too risky to bet against the Fed. History suggest it is a bad bet and one that could leave some people significantly poorer.
Thanks Will. Appreciate the well reasoned argument that says we’re likely to go higher.
John, great analysis as always. I have learned a lot of technical indicators here, and have been reusing in my work, such as NYMO. What I just observed is that SPX daily is showing a exhaustion pattern that mimics the one seen between Mid-Aug and Mid-Sept:
– SPX stuck at top of megaphone, forming a round-top formation
– Declining CCI and NYMO
– Flattening NYSI
– Result: Gradual pullback to retest 20DMA
But to manage expectations, this isn’t suggesting a rapid decline but a grind lower to retest previous breakout in 2015 and a rising 20DMA which is at 1997 currently. Unless volume picks up, I don’t see it piercing through the above just yet. Similarly back in Sept we did see the top retested before the waterfall began.
The last two declines in July and Sep-Oct did not start until 2-3 weeks after the NYAD cumulative had topped out. Last Wed appears to be the current top in NYAD cumulative.
http://stockcharts.com/h-sc/ui?s=$NYAD&p=D&yr=0&mn=6&dy=0&id=p12451817794
John, in answer to your question, two paid subscription services, EWI (Prechter) and R. McHugh, both stated the top was in September days after that peak, catching most of the 9-10% decline. They both believe this rally from Oct. 15 is the last gasp and is about to roll over. They both have a significant gold bottom @ 1131, but with differing counts. These services both use Elliott wave but also use other TA tools, especially sentiment indicators in the case of EWI.
I really appreciate your generosity in sharing your work. You make a strong case for an imminent peak. I have a small short and am looking to add when short term overbought condition appears. G/L to all.
Go ahead and follow Prechter to the poor house….
I don’t like much of what you say except the entertainment value. Unfortunately, you are right about Prechter.
No one likes to hear the truth especially when their trade is going in the crapper. Who cares if you don’t like reality.
Actually, Prechter sent out an alert the Friday before the Monday Sept. top entitled “This is It” meaning the top, which he then gave levels for trading.
John, groundbreaking work. You are an inspiration for all who don’t believe the market rally. Amazing analysis combined with superb writing. I will let the boys know to short the market on Monday. Let’s meet up to celebrate after this week!
Believe what you see… A 1600 point Dow rally off the Oct low.
Bring it on. I got enough ammos to boost a rocket to the moon.
Hubris is worrying…..imho….
J
Betafish,
Above you wrote, “Would be interesting study to correlate SM performance with the above data.” I’m sorry, but what is SM short for (well as it relates to discussion regarding Apogee/Perigee I mean). 😉 Thanks
SC
Stock Market
Statistics continues.
If you long at opening on each day from day 7 to day 1 left to Nov you got a good return at the end of day.For this Nov, this is from Thursday Nov 20 to Friday Nov 28.
On other hand, if you long at opening on each day from day 11 to 1 prior to Thanksgiving, here the returns for last 16 years:
day 1 to day 4 win
day 5 to day 6 loss
day 7 to day 10 win
day 10 to day 11 loss
This Monday will be day 8. If you want to long, long at day 4 which is Friday Nov 21
Seasonal and Cycle patterns also support a short term rally in SP.
Combines with Luna edge, perigee and south to north declination you will get a high probability trading
All in all I will long SP500 at each day and close EOD with SL -2500$ from Monday 23 to 29 Nov.This is recommended for day trading only.Thank for reading
whoops, Monday 24th to Friday 28th Nov.To be corrective
Martin Armstrong also says the cycle of war turns up next week. Another potential catalyst.
OK, THIS I agree with as it relates to Ukraine tensions.
vj, do you have anything to contribute other than knocking posters or telling us in one line that you agree with something?
Sure I do. A simple rational mind among sheep going over a cliff of belief every day calling for a pullback. You need only look at the tape, all your analysis is futile, but you all drink from the same kool-aid container of disbelief that the market can go up every single day for 22 sessions straight.
How shall I contribute Allan? How about posting all the bullish signs and closing prices since Nov 1st.
Durable goods had its best month ever, consumer confidence is strong and corporate profits are bullish.
Dow Jones Industrials and the Dow Transports both hit record highs last week, signaling another Dow Theory bull-market confirmation. Shall I go on? These factors play out each day as reflected in almost daily all time highs. Your drivel about pullbacks has been since Nov 1st, where did it get you?
Yes, by all means, Vinnie, please go on….
I’m more interested in your trading strategy, rather than things like durable goods, etc, but you don’t have to be specific if you don’t want to….
Something like 80% long, or 100% long the S&P, or something like that would be appreciated….
FWIW, my trading system reversed from 100% long to 50% short on 11/06, and added to that to bring it up to 100% short on 11/14….
And I’ll certainly post when the system gives a “cover and reverse” signal as well…
Next, I don’t think of myself as a “sheep”, just because I’m reading and posting on this blog, but to be fair, there’s probably a lot of people that think that the market only goes up, because the Fed and Central Banks will always have their back…
Some might call those people sheep as well….
Just a thought, but guess it really just depends on our own POV….
Thanks for your thoughts….
Last statistical calls.SP performance based on Day of Year as following:
Day This Nov averReturn % Positive Max Min
224 17 -0.1% 51% 1.9% -3.7%
225 18 -0.2% 42% 2.1% -2.2%
226 19 0.1% 62% 2.1% -2.0%
227 20 0.1% 69% 1.6% -3.1%
228 21 0.1% 70% 1.6% -2.8%
229 24 0.2% 68% 4.0% -2.9%
230 25 0.1% 60% 2.8% -2.6%
231 26 0.1% 53% 2.9% -3.4%
232 28 0.2% 58% 3.2% -4.2%
If I not counting this year wrong, you can see that Tuesday Nov 18 statically will be the worst. Day 227, 228 and 229 are the top 10 of the most positive days of the year. Whereas the best day is the second trading day of the year with probability of 74% from 1950 to 2013. For this Nov if history repeats itself, Thursday 20th, Friday 21th Monday 24th will provide good returns.
To sum up all statistical probability above:
– I will short SP 500 on Tuesday 18th and Wednesday 19th.
– I will long on Thursday 20th, Friday 21th, Monday 24thh and Tuesday 25th. I could trade intraday and close on the next day opening or do swing. For swing, I long from Friday 21th and exit on the day after Thanksgiving , Friday 28th..However I will combine those with my day trading technique to make the best decision. That for the last 2 weeks of Nov.
Have you heard of Stock Trader’s Almanac (Wiley and Sons, Author: Hirsch), they have this data for each day of the year as well as all the common tradable patterns throughout the year including Sell May Go Away, market timing by sectors, decade cycle, election cycle, etc..
Yes, you can count as much as you want. Day of the week, day of month, day of year, mid term , holiday…but this blog of John so I just said a bit. It also in line with Lunar stuff
He not mentioned gold or bond. I will long go 4 days before Thanksgiving as well
Last but not least, forgive me, I will not torture you with statistical numbers anymore. For every November the trading days from 15 to 19 very positive. This Nov, meaning from Friday 21 to Friday 28. I will go all in , statistical temptation too strong
This also suitable for the pattern of Thursday weekly. Every Thursday usually a turn for a short- term swing. It stronger than Tuesday Turn
I thought it was the Tuesday of Txsgiving week, 11/25 to 12/2? Other jewels are 4/15 to 5/2 (post Tax Rally), and 12/18 to 12/31 (Xmas Rally). By the way, 12/22 to 12/24 are the only triple strong days left for 2014 (triple strong meaning Lunar Edge, Moon to North Declination, seasonals, no apogee).
Yes common knowledge is Tuesday Turn but my own discovery is Thursday.
Whoops I talked about Thursday Nov 20
Ref high short interest. Looks bullish. Joe Granville pointed out bears are right in bear markets just as bulls are right during bull markets. Similar to overbought is bullish til the end and oversold is bearish til the end. The majority are right during trends and wrong on both ends. The McClelland Oscillator will go below zero and the Summation index will turn down with a good down day next week. If this is indeed a top, at least a 6 to 10% drop should occur in short order. Also, the PPI is due out on the 16th. If it is down at a 5% annualized rate, it will signal a deflationary spiral sell. If not, we are still fighting a positive credit cycle environment. In Japan, the momentum of qe from 2001 to 2006 kept the market going up for a 11 to 16 month double top. I guess, the most reasonable interpretation of all this is a volatile distribution top til late 2015.
vinniesj.
I am intrigue by your one-liners. So, what would you recommend adding long to? I want to know what’s on your portfolio.
Why would you add any long positons? You simply ride them till they show signs of a pullback, not guess a pullback. Ride the bullish trend till it ends, or keep guessing and proclaiming it “has to” pullback, bcz I have news for you, it does what it wants,not what you want or widh it does.
See my comment above, but ~I’ve~ certainly see enough signs that we’re going to get a pull-back… Maybe it’s a pull-back, maybe it a larger correction, maybe it’s a new bear market, or maybe it’s going to be a crash….
Which, I have no idea…. But I’ve seen enough to let me know that I DON’T want to be long, and in fact want to be short….. So I am…
Regardless, what kinds of signs are you looking for that’ll help tell you to when to liquidate your longs…. And I’m not trying to be cute here, I seriously would love to know…
Thanks!
Me and the boys move markets on daily basis. 7 out 10 times are in our favour. In fact, it’s like a puppy dog that I like to take out for a walk.
2 links, first on shows a amusing vid but also shows how easy it is to manipulate a delusional nation who believe all is well.
http://www.zerohedge.com/news/2014-11-16/9-biggest-myths-people-believe-about-system
2nd not funny at all, half a nation to be cut off of all infrastructural support. This gathering storm will not bode well.
http://www.zerohedge.com/news/2014-11-16/ukraine-bank-runs-begin-poroshenko-plans-sever-socio-economic-ties-separatist-held-r
Andre’,
The data I posted above was difficult to find, and I had do some further work with the data I found. There are sites, such as http://astropixals.com that have Apogee & Perigee by their date, time, and distance, but I have looked far and wide for a site that has historical (& projected) daily lunar distance. The only site I have come across is:
http://time.unitarium.com/moon/where.html
It provides lunar distance real time, and you can put in any specific date/time (past or future) to get the lunar distance at that inputted time. This is time consuming to do it one day at a time, so it only makes sense to do those periods you are interested in. (If anyone has a better site that is more user friendly, I would appreciate the info.) Next I do the calculations to find the speed per day by simply subtracting one day from the next.
Why does it matter? For me, I need a model in my head to explain how markets work (or anything else). I believe that energy impacts emotion, and there are two impacts on energy, (1) the impact on energy from angular differences between celestial bodies that changes the mix of energy that impacts our emotions; (2) the rate of change of celestial bodies that changes the flow and pressure of energy on our emotions.
Obviously, there is a dramatic rate of change in energy at Apogee and Perigee. You and others have pointed out that those dates +/- 2 days appear to be of importance that impact prices. It is now confirmed that it is indeed 4 days around Apo/Per when the speed changes dramatically. There is another time, midway between Apogee and Perigee, when there is a dramatic change in speed – from increasing at an increasing rate to increasing at a decreasing rate. Is there any difference between the maximum speed (fast reduction in pressure) from one Perigee to Apogee period compared to another, and a corresponding impact on prices.
Lots of question, few answers, but have to start somewhere – with a question.
SC
Steve, thanks. From what I’ve seen these data confirm my 2/4 lunar filter; 2 days around apogee and 4 days around perigee. The roc extreme in distance is exactly the midpoint between these periods. Not the same as midpoint ao/peri. Remarkable.
http://www.seeitmarket.com/all-time-highs-bullish-stocks-caution-16013/
GEM hourly forecast has a buy in the 9:00 hour est tomorrow 11/17. The greatest gains are late morning to early afternoon.
https://twitter.com/mjmateer
Peggy,
Thanks, interesting stuff. I’m struggling a bit on graph and concepts. Is time running horizontally, perhaps it unfolds as a spiral – around and outward?
SC
yes around and either expanding or contracting. now the “3rd dimension” is expanding in a negative direction until 11/24. as you view the Spiral in 2 dimensions (as on my linked chart) the Spiral is traveling counterclockwise and reaches a high in the upper right quadrant through to the upper left quadrant (vice versa for lows). This would put the expected low for this negative expansion on 11/21. I’m looking at the 9:00 hour est for that low.
Hi Peggy,
thanks for sharing that. You mentioned a buy on 9 pm est today. When are you expecting a high if you expecting a low if you expect a low on the 21st Nov at 9 pm est. ?
I would very much be interest to understand your forecast methodology and forecast success rate.
Cheers,Joseph
today’s Spiral forecast has a buy in the 9:00 est hour (that would be am) and then up for the remainder of the day. The other “events” that are expected are velocity times – they are 22:00 (last night), 3:00 to 5:00, 8:00 and 13:00. The 13:00 hour could be the high for the day. The hourly Spiral forecast gives the shape of the day and the velocity times are poinpointing highs/lows and times of greatest velocity (hence price movement). I got the data for these forecasts from 7442 Analytics – they are the best ones to explain more about it.
to answer your other question, I am expecting a high on the 18th or 19th at either 6:00 or 13:00 before the low on 11/21.
yes around and either expanding or contracting. now the “3rd dimension” is expanding in a negative direction until 11/24. as you view the Spiral in 2 dimensions (as on my linked chart) the Spiral is traveling counterclockwise and reaches a high in the upper right quadrant through to the upper left quadrant (vice versa for lows). This would put the expected low for this negative expansion on 11/21. I’m looking at the 9:00 hour est for that low.
I have no idea why my user name changed on the above post.
this is the post where my user name somehow changed – it should show up soon on this thread – in the meantime here it is with the correct user name
Yes around and either expanding or contracting. now the “3rd dimension” is expanding in a negative direction until 11/24. as you view the Spiral in 2 dimensions (as on my linked chart) the Spiral is traveling counterclockwise and reaches a high in the upper right quadrant through to the upper left quadrant (vice versa for lows). This would put the expected low for this negative expansion on 11/21. I’m looking at the 9:00 hour est for that low.
Thanks for this analysis, Peggy. This is some of the most interesting information that I have ever heard. Since I am in inverse etf at the moment, I will be watching this negative event with interest.
japan gdp – what a disaster. japan officially a basket case. allen, you are correct.
long way to go until the morning, but theres the japanese gdp catalyst i mentioned. so far the reaction is the bad news is bad news. we are entering the third week since qe3 ended, which based on qe1 and qe2, should start the weak period. add in the potential some movements in ukraine now that putin is done faking it at G20, and you might see some panicking.
Just closed all ftse longs to bank remaining profit for a further 78pts.
I have pushed my luck. I just do not have the courage to stay long.
Still got my SPX auto shorts waiting to hit underneath.
2011
1975
1943
1914
thanks, Aaron. Good to know what other successful traders are doing. Good luck with the shorts!
http://www.bloomberg.com/news/2014-11-17/japan-stocks-fall-with-yen-as-economy-enters-recession.html
I’d be very careful with what you read as…..Japan now “offically in recession” suggests further “risk off” which amounts to a much stronger Yen ( as yen carry trade unwinds ).
Of course a headline like this would come from bloomberg….targeting retail.
Nikkei down = JPY up.
You can’t lend out/ print “a gazillion yen” at 0% then have your stock market tank with the currency along with it. Those Yen need to “come home” first.
Risk off = JPY up
i believe you are correct, yen needs to come home first, thus yen go up. at some point, i do believe the yen will devalue due to weak economy (and nikkei), when and what level thou?
If you pull a 25 year chart of Yen you can see that we’ve touched a significant trendline ( or have even dipped “below” ) with literally “miles” of upward direction to travel on a correction in risk.
If this is “indeed” the turning point in risk….( which we believe it is ) you’ve got months n months and months before considering a time when “both Yen and Nikkei” fall in tandem.
Japan GDP contracted again 1.6%
economists expected 2.2% increase after it shrank 7% plus later quarter. Japan is now officially in resession.
Will Abe have a job next year?
Abe may want to reconsider calling an election next month.
USDJPY and SP500 closed above 5SMA for 21 consecutive days. It is even absurd in terms of technical analysis. USDJPY down good for SP being down as well
USD /JPY “is” The SP 500 – Period.
As Yen is the fuel to the rally…..as goes Yen GOES ALL!!
What will be interesting ( and equallty satisfying ) is the “final realization” by naive retail “kool-aid / media sucking” traders convinced that The Central Banks have their backs ( and that “this will just go up forever” ) when they see The BOJ completely powerless to the flood of Yen repatriated when risk comes off.
QE will “once again” be proven ineffective as “the all in move by The BOJ” is slammed back in their face.
I would hope that Americans in particular are taking note.
America “is” the next Japan.
I think you’re right about QE. However, CB’s actually BUYING stocks and etf’s, that seems like a different story to me. How can Japanese stocks ever go down if the BOJ just prints and uses the money-out-of-thin-air to buy the Japanese stock market?
We can’t ignore the amount of Yen “already borrowed” and currently “in the system”.
The BOJ and pension fund aren’t the only ones holding Japanese stocks so…..when confidence dwindles – unfortunately what people often don’t understand or even “believe”is that there is enough out there to “bury these CB’s alive”.
It’s a confidence game – thats it. And when people start to lose confidence ( which I believe they will ) these things fall apart like sushi rolls.
My latest rant: http://forexkong.com/2014/11/17/japan-enters-recession-stocks-at-the-highs/
fyi, the gbp/yen just triggered a head and shoulders pattern (see hourly or 4 hour chart). i hope i don’t get whipsawed with this trigger.
I trade weekly charts / macro data and turns so…..frankly I have no idea what you are talking about.
Yen up on repatriation / carry unwind is such a strong market dynamic that i don’t even bother looking at individual currencies vs Yen.
When Yen goes…….they all go.
You can just as easily short any currency vs Yen in this situation, as no short term pattern in one or the other will provide any “further edge”.
hoarding galore – Japan central bank has proven successfully they cannot grow the economy even when depreciating their fx by 20% – major reversal point in my humble opinion in the carry trade. Same as 2007 when Bernanke gave the all clear on housing and 1 year later the market realized that was not the case. Should go the other way now for 1-3 year.
Combination 4 yr pres cycle and 10 yr decennial cycle suggest we are super bullish into at least Sep 15. A “5” year has never been down.
If like GannGlobal you believe in 90,60,30 year cycles then they too ate all very bullish.
GG latest free webinar.
http://www.gannglobal.com/webinar/2014/11/GGF%20Webinar%20Promo/14-11-GGF-Webinar-Replay.php
Not to mention Kaeppel’s 40 week cycle went bullish on 10/30. The Juglar and Kitchen cycles are pointing down though. The market has been up up up for 70 months without a sustained pull back. Could be like 1994 when the end of year and beginning of 2015 are down and Mar to Dec of 2015 are up up up.
Next week would be interesting to say the least. Hands on my trigger ready to lock and load. vinniesj, you can just sit back to watch and learn.
Interesting quote from Ron Insana : “Big cap stocks are now considered a safe haven too”. In this article he says that since these companies have lots of cash and there share prices are moving up they can be considered a safe haven. I am sure there was a commentator in the 70’s who were sure Polaroid and Xerox were a safe haven.
Was 17700.7 the ATH in the Dow for the next 5 years, I remember watching gold rise and rise to 1920, thinking it would go 2000, it never did. Well not yet.
Ant hindsight wonderful.
I suppose we mere mortals will never know till we look back in history.
Thanks for the responses everyone
You know I am a lunatic and consider gravity a major driver of financial markets. This weekend I did some work on Mercury. Mercury is definitely not about gravity; too small and too far away.
But Mercury has a relatively strong magnetic field that may impact the sun. This should be an electrical effect.
Now I think I have found electrical cycles. It goes like this.
Mercury goes retrograde 3 or 4 times a year. The sun is conjunct Mercury every 4 weeks on average (not a fixed cycle).
The rule is : when mercury is retrograde AND the sun is conjunct you get a major CIT. October 16th was such a moment.
The next incident of this is January 30th 2015. The SM (now sun/mercury ;-)) cycle is not fixed but makes 3 cycles within the retro conjunction cycle.
This idea comes from George Bayer, over 70 years ago. But I think it is worth considering as an additional timer.
The last merc retro conj cycle was down from june 19th into October 16th. The next one could/should be up into January 30th.
The idea is that confluence between electrical cycles and gravitational cycles really adds value to your analysis.
cheers,
André
Do-si-do Andre you mentioned in a post the moon gets out of its orbit from earth and comes back ….but not in those words…. Then if that was the case then it would enter another planets orbit and then come back to the earths orbit ? If I think that what you think ?
Not sure I understand. The last piece was not about the moon.
The moon orbits earth 4 days before and after perigee. Leaving this period adds speed. To day we are in the last day from the apogee period; 2 days before and after. So tomorrow we will see more gravitational force.
Earth’s moon never orbits another planet. So Mercury and our moon have no impact. It’s either sun/moon or sun/Mercury.
The last post is not about gravity, but about electricity. The idea being that if both forces are in sync you get a more reliable signal.
Mercury retro and conj. Sun–I believe that puts Mercury in between the Sun and the Earth. (As opposed to Mercury direct and conj. Sun which would put Mercury on the other side of the Sun from Earth).
That could account for the effect we see in these moments.
Have heard mercury is heliocentrically conjoining Uranus on the 18th. Stated that this may result in higher than normal solar activity. Wow, little mercury and planet far far away and if they line up the sun may have more energy. I think mercury is definitely a key in understanding stock price movement, since Uranus is considered negative for stocks maybe they will have a down day tomorrow.
November 9th.
On Saturday the moon left earth’s orbit and is now adding miles to the distance fast. So this provides a clear upward bias into Wednesday, as the longer term gravity cycles are still up.
When the moon spins fast it has less graverty as it is far away from earth…
Moon Spins slow when close to the earth more graverty influence from moon to earth.
That’s right. And the tidal force was up last week. We are now past apogee, so this week gravity increases; having a negative effect on markets.
Andre thanks
I will talk more about gravity next week keep up the good work…
Electricity is a new ball game for me…
SP500 will be going up down then down and up crazily AGAIN
Look at USD/JPY, I short early in Asia ,then long also in Asia.Realy weird. Only thing can explain from George Douglass Taylor 70 years ago. For a buying day like today, you can short early then buy later as well and both give you handsome profit. No GDP, no BoJ, no nothing can explain this behavior. Even blame for HFTs. Look for Sp acting the same. Today could be an outside day for SP. Could be an Whoops Day according to Larry Williams
30y bonds is breaking out of a multi-week consolidation, looks to me want to test the Oct shooting star candle highs. gold consolidating last friday’s gains, ES down few points but still hanging above the H&S neckline on the hourly. We need a clean break below 2028 for real action. But bonds are setting up nicely for a big move.
Wow! Only takes half a day to recover from a major economy announcing a recession. Without the FED the global economy is finished. Simple as that. Countdown to QE4 has started.
Dunno who did it but some big player in the background (probably a CB) did fantastic job to send the dax flying 200 points off the lows.
Draghi’s latest comments.
I’ve said it before and I will say it again. ANYBODY that thinks it is mere coincidence that Central Bankers open their mouths just as it appears that a market is either tumbling or about to tumble are dilusional.
YET AGAIN….the DAX chart is beginning to look ugly and is on the threshold of falling off a cliff and YET AGAIN Mr Draghi comes to the fore and saves the day.
And speaking of ugly. If AAPL closes at or below current levels that will be one very UGLY candle.
http://stockcharts.com/h-sc/ui?s=AAPL&p=D&b=5&g=0&id=p10804827153
With no offense but SP rally beginning for the next 3 months. Although I might short at Tuesday , Wednesday and Thursday this week but those would be quick shorts. There so many statistical edge for a bullish view, even serial month bias
The clock is rapidly running down on
any further significant 2014 declines.
Today and tomorrow are key imv,
if there is no downward traction by Tuesday’s
US close then it’s looking like bleak
house for the bears.
If the maket ends down today, it is an intermediate sell signal. A bull will just keep going up as the overbought is worked off going up/sideways. Much like the $ has been doing. If the market does not have a significant correction (16,000) we bears are in for more trouble. At this very moment at least, the sell signal is in play.
Past cycles and astro based signals indicate Nov 17-19 should be negative days with weakness. However, it appears the overall downside move thus far has been extremely limited and bears might only be looking at the prospect of a continued sideways consolidation at best during this time frame.
One key to any further price weakness is the requirement for today’s close to be below Friday’s closing price. If what happens again is say a weak price below 2040 SPX mid-day and then they ramp it up by 5 to 10 points again in the last 30 min to 2 hours, which has occurred numerous times almost consecutively recently, then you can probably kiss any significant market weakness until in December and it likely occurs from higher levels.
John Hampson: I have never posted on your blog before. I highly suggest you take a look at the MACD monthlies of the DOW and 10 year treasuries. I also suggest you do the same for the currencies, US dollar index, and Gold. I consider Silver to be an “industrial” metal just like Copper. I also suggest you do the same for Copper, Silver, and Crude. It will be an eye opener. Again, I suggest the –monthlies– using the Moving Average Convergence Divergence technical indicator.
I just looked at the monthly S&P MACD. It is in a very similar situation to the early 2000 and late 2007 charts. On the verge of a major sell signal only it is even more extended than the previous two tops. Is that what I am suppose to see? The bonds look very bullish.
Yes, that and when the MACD crosses its “signal” line the odds are high of a crash in the next month -if- there is going to be a crash and not a resumed trend wherein the MACD re-crosses its signal line. Should a major sell signal occur with this month then the crash probably won’t happen until December however if the major sell signal does not happen until December’s monthly bar completes then the crash probably won’t happen until January. The ongoing price downtrends along with the monthly MACD bear trends of Crude, Copper, and the Australian Dollar point most strongly to a world wide economic downturn thus the high odds that the sell signal will result in a crash of the stock markets. This agrees with John Hampson’s view but not yet in timing.
Thank you, fine explanation. Great stuff.
Tomorrow the moon leaves the apogee period and gravity will grow stronger. Today lunar declination starts a new cycle and tomorrow a midpoint in the sun/mercury opposition cycle. So keep an open mind. This consolidation phase was expected. December 14th is a major tuning point as the declination and node cycles synchronize. On dec 15 the Uranus/pluto waxing square is exact.
Mid december will set the stage for a 6-8 week rise.
Both Phil and Steve T have great observations. I too have 11/17 on my count as a significantly down day. It is just not panning out as I thought it would. Technically, the crash scenario may not need any catalyst. However, at this point, it is just super hard to see a strong case for the crash scenario without a major one. All the technical indicators are pointing into an imminently significant drop. And the daily cycle low is also overdue. However, there is no black Monday. Will there be black Tuesday? I truly doubt it. This week is my very last week of November anticipating for any significant correction.
On a personal note, I am happy and fortunate to stay in cash for now. I had planned to short last Friday and today, but this point, I believe the timing for shorting is still not ripe yet. I may start shorting when the waterfall begins, but the question is if we’ll being witnessing a waterfall in November, or another firework instead??? It is hard to imagine the markets drop significantly overnight before the US open… unless there is a major black swan event.
Both Phil and Steve T have great observations. I too have 11/17 on my count as a significantly down day. It is just not panning out as I thought it would. Technically, the crash scenario may not need any catalyst. However, at this point, it is just super hard to see a strong case for the crash scenario without a major one. All the technical indicators are pointing into an imminently significant drop. And the daily cycle low is also overdue. However, there is no black Monday. Will there be black Tuesday? I truly doubt it. This week is my very last week of November anticipating for any significant correction.
On a personal note, I am happy and in a very weird way feel fortunate to stay in cash for now. I had planned to short last Friday and today, but this point, I believe the timing for shorting is still not ripe yet. I may start shorting when the waterfall begins, but the question is if we’ll being witnessing a waterfall in November, or another firework instead??? It is hard to imagine the markets drop significantly overnight before the US open… unless there is a major black swan event.
Apologies… Double posting by accident.
There is an unusual divergence of sunspot count and flux. I’m wondering if after sunspot 2209 decays then flux will drop off rapidly, marking an acceleration downward of solar activity. http://www.solen.info/solar/
erick, expectations for today was for a minimum SPX 10 point decline and possibly upwards of maybe 20 to 25 points. I reviewed last autumn’s fractal around this time and also an equivalent pattern that occurred earlier this year too. As it stands we got so far maybe 8 point decline at best although it was a bit more since the lowest point occurred in overnight futures.
Any shorting at this point would seriously need to be of the quick trading varieties.
Thank you Steve.
What’s it gonna be today folks?….. Japan is in recession, Nikeei gets hammered 3%, and all we do is go up 20+ points on the Dow as a result. There is no let up.
Manipulation will not allow a sell off till the Republicans take control of Congress, that’s when the whole thing lets go.
Well, for this “folk”, it’s going to be maintaining 100% short….
I have both TZA and SPXU…. Doing just fine in this “no let up” day… 😉
And I believe you will make money too. As long as there is little leverage, you can set wide stops and eventually be right.
You go right ahead and keep fighting against the trend for 2 weeks straight. A fool’s game to never admit you’re wrong.
I started to write out a lengthy response to this, but ya’ know……screw it…
Have a great life, Vinnie…… I’m sure you’ll do great….
Thumbs UP Barry…
are you not concerned about the decay that the 3X etf’s undergo during sideways consolidation periods, or worse when the market goes against your position?
Not really…. Because I’m not in these positions ~that~ long, generally, and not to be flippant, but the market is only going to do one of three things….
It can go up, it can go down, or it can go sideways….
And it won’t go sideways for long, because no one makes any money… 😉
But yes, I’m aware of the decay issue… Concerned would be too strong a word….
There are times I use 1x or 2x ETFs as well, but right now, I think we’re setting up for something big…. We shall see….
Last 3 sets of signals occurred:
Sell 50% – 9/04
Sell 100% – 9/24
Cover shorts and go 50% long – 10/20
Buy 100% long – 10/23
Cover longs and go 50% short – 11/06
Sell 100% short – 11/14
I’ll let you plug in the ETF of your choice, but I think you’d agree, decay was not an issue… To your point though, “shorting” the opposite ETF is something I’m looking into, but nothing actually done there yet…
Currently losing a little on the SPXU, and ahead a bit on the TZA…
I’m down about 6 S&P points from my average sell points, so about where I’d expect to be… I’m actually ahead overall with the TZA, but that could change any moment….
Thanks for your note….
Also wanted to add, for the first half of the year, my system had a flat return…
Every time it went long or short, it would be back to break-even (give or take) before it covered and reversed… So a whole lot of nothing….
It happens sometimes, but you can only take what the market will give you, and that wasn’t much the first 6-months of the year….
Have to agree this would play nicely. Can just hear it now “it is their fault”, chose your side.
So, the cat is out of the bag. Anyone NOT buying physical gold now is mad (maybe use the profits made from an over-extended stock market bull?).
http://www.telegraph.co.uk/finance/economics/11235269/ECB-could-buy-gold-to-revive-economy.html
Really, there is a bizarro world ahead in the next few years, they will buy anything not nailed down to fight the deflationary rot. The chances of a prolonged bear are slim I suspect, it is all going to be compressed into a few years of mayhem.
I got short small today but then got stopped out again. (I made a small profit.) I continue to think that for me to short big, I need more trend and less backfill — i.e. more reward and less risk. For example, if I buy puts, I probably lose from time value and transaction costs even if the market is going down small amounts in this crazy BTFD in the final hour environment. Markets seem to give poor edges at the peak — and so I will let go of the psychological need to tell the world that I picked the exact top. I am going to bet even bigger when the waterfall is clear, and hopefully make up for the distance from the peak to entry.
Despite my zero positions, I am sure I will be mocked for agreeing with Hampson. That is fine too. But actually, on the balance, I will not be surprised if we rally from here till 12/26/2014. That will make this market as crazy as 1929 in terms of delay from the averages of my own solar max indicators. At this point, I am giving it 50% chance that it is crazier even than 1929, and 50% that it is not. The problem with a few data points is that the craziest time can always be in the future rather the past. Rationally, I am unsure which way to go — the expected peak is around now, and yet it can be earlier or later.
Emotionally, I continue to be sure that now that I am stopped out, it will tank really soon. Watching the DAX and the EM, it does look like the peak has come and gone, the second chance has come and gone, and now the waterfall is here. I wish the current bears the best of luck, and I sincerely hope that everyone makes money. My time will come later.
you are correct, shorting when the market is still in topping process is very frustrating. A 60 minute or 2 hour chart with some moving averages can give us a good indication of when a sharper drop may come. Same with various daily indicators. We can never know the future but we can put the odds in our favor and know when they are against us. You can short overbought conditions but have to be very quick and move down to 5 and 15 minute timeframes. Good luck !
I would be happy to see the final hour being down today. It is up for 15 days in a row or practically every day since the October lows. This is beyond randomness. A group of traders are buying, however misguided. When they are finally gone, the market might not top right away, but at least I will check that off my list of things to wait for.
Technically another up final half-hour, but small. Perhaps the tides are turning, but nonetheless waves still choppy.
insanity it is
you can short SPX by buying SH, a 1x inverse etf. No decay on that one (or if there is, it’s extremely small). Very little decay on the 2x inverse etf SDS as well. Taking long positions in either SH or SDS (RWM or TWM for Russell) will allow to to stay in the positions without dealing with the time decay that come with options. Me personally I stay away from the 3x etf’s due to their decay issues.
If you want to stick with options, you can use expirations that are several months out, say March 2015, and go with vertical spreads. The vertical spreads cut way down on the theta decay, even the wide ones, say long SPY 204 put/short SPX 194 put for example.
Good points here, PC, and I responded to your question above…. Thanks…
Thank you
Japan in recession even as they are changing out the money printers for bigger and faster versions because the old ones are worn out.
The problem with politicians is that they do not know anything, they do not have the expertise to be able to fix any of our problems or even to really understand what is going on. Whilst corruption is inherent in any monetary system, I suspect that 95% of politicians do not understand what they are creating with QE or really why they are even doing it. The banks know though……can you spell bankruptcy?
Make sure you have some physical land and shelter stowed away, our pensions are going to be worthless and gold has no practical use whatsoever…..:)
BTFD perhaps, but at least use guaranteed stops……
imho
J
Japan’s been stuck in the same GDP for like decades now? Prices have stagnant, food is cheap. Fast food chain Yoshinoya’s (MCD equivalent in Japan)’s Large Gyu-don (beef bowl) is still 360yen, unchanged from 8 years ago when I used to have as an exchange student. It’s good for tourists, but nothing has changed for normal citzens’ life here
Updated Spiral through 11/17 at 16:00. red = velocity next times: 11/17 21:00 – 23:00, 11/18 4:00 – 7:00, 11:00 – 14:00. Spiral shows hourly path.
https://twitter.com/mjmateer
typo – it’s updated through 11/18 at 16:00
Spiral hourly path (posted yesterday) showed a low today at 8:00-9:00 est and up to midday. nice move from 2039 to 2048 so far!
Hello Andre and Steve.
Found one more daily moon distance calculator, hope it helps.
http://www.aphayes.pwp.blueyonder.co.uk/ephemeris/index.html
Thanks; I will have a look at it.
Saturn goes opposite of earth tomorrow. Known as the planet of restriction let us see if this favors the bears, a few weeks at least.
Seems like a good article to tie in with John’s convictions. Backed up with interesting data.
http://www.seeitmarket.com/all-time-highs-bullish-stocks-caution-16013/
We closed higher yet again on the Dow and SPY. Ready to hear the excuses. It’s Nov 15th, you all basically started your pullback call Nov 1st…..
TZA up 2.34% today, Vinnie…. No excuses here! 😉
And an item of note, HY softened a little bit more today….
Wile E. Coyote gets a little bit closer to the edge….
Bond prices are so low, liquidity is infinite, there is nowhere else to go but equities.
I’m not saying that’s right, I’m saying that’s where the money is forced into.
For 6 years the US has punished the would be saver by keeping a ZIRP.
Well, I’m going to disagree a bit…. Liquidity may be infinite, but right now it’s slowly draining OUT of the market…. That will probably change at some point, but right now, by my eye, liquidity is draining out…
And that’s why I’m very comfortable being short right now….
I will of course let you know when I my signals reverse, and I go long the market..
And that WILL happen at some point…. I’m just hoping it’s from lower prices… 🙂
On the other hand, completely agree with you on savers being punished…..for years now… Completely wrong, and a real shame…
Post again when you know what the date is
hey, that’s funny, merely a typo and makes your case even worse….
My RWM up .4% today, not too shabby!
What higher than 17701?
Update: GEM expects the high on 11/19 at 13:00.
One thing is for sure, GEM nor any other system cannot tell the future. Unfortunately. 😀
J
really? did a great job of it today.
Good read from Hussman.
http://www.hussmanfunds.com/wmc/wmc141117.htm
“That’s really what quantitative easing has exploited: the willingness of investors to speculate, regardless of historically elevated valuations and extremely lopsided bullish sentiment, because of the discomfort that zero interest rates seem to offer “no other choice” but to take risk.”
For those interested in GEM; check out the subject of Vertex.
Eclectic,
Thanks, great idea. Just got book on vertex. I’ll move it to top of stack
SC
I just discovered that when Japan said equity allocation was increased from 24% to 50%, these are soft targets. In reality, they were at 34% at the end of June. That is, they knew about the increase and were already buying ahead of time. They probably bought more from June onwards…I suspect that there cannot be much more buying power left…..let’s say they reached 42% when the announcement came out. Then for all of November, we see the market rally the last 30 or 60 minutes. Surely they are at 50% now. Yes this is a soft target, but at 50%, I suspect it is harder for them to exceed the target, unlike how they did at 24%.
The Nikkei already suggests that the domestic buying is done…perhaps that is front run more than the Spx, and so there is earlier sell the news. But that should be splitting hairs in terms of weeks till the end of the buying pressure.
With Calpers and Texas getting out of hedges, everyone is all in beta. These are the big boys. Who else can buy. I am not saying top now, but let’s say next three months. What other buyers can come in?
“really? did a great job of it today.” – Peggy
So if I have had all winning trades on one day that means I can tell the future? What about if I had all winning trades for 68 consecutive sessions? Does that suggest I can forecast the future?
Do you really believe that “GEM” will prove itself to be prescient? Really? 😀
John LI
Of course the equity buying started some time ago. No institution is going to give notice of such things – that is unless they are just talking. The market suckers bought it hook line and sinker, I got a couple of hundred points myself because I know that even though I think about the timing I know it is likely the market will fall for it. Sometimes these things are a gift. I remember when Abenomics first was announced, my pension fund made about 7 years of gains in 6 months.
We will see how long this lasts, and of course afterwards how it ruined the country.
imho
J
Thanks for agreeing. My point was not so much that I did not expect them to buy ahead of time, but that I just found the numbers in the news. They did reveal their hand when they announced their positioning in June, followed by a survey of marketwatchers that expected an increase to 48% on Oct 28th — so an increase to 50% should not have been so unexpected.
just buy 9:00 and sell at 13:00 simple btw, GEM has nothing to do with vertex.
Buy what?
ah….I am guessing SPX then from all the promotional work I have now read:)
Peggy, please also specify the time zone…….ffs lol
J
Agreed, the world has gone mad. Market movements have little to do with geomagnetic movements.
http://jackkruse.com/energy-and-epigenetics-3-autoimmunity-cancer-autism/
For those of you who want to understand how the magnetic field impacts neuroimmune function. The effects are real, ion cyclotron resonance from magnetic field alterations is a property of nature we are not immune to…
Im sure the effects are real. But they are not what drives the markets movements.
The Gravitoelectromagnetism forecasts demonstrate that it does drive market movement.
I would agree that there isn’t a 1:1 correlation to market movement. What you can predict though is increased tension globally, from excitoxicity from calcium being effluxed from cells initiating apoptosis (cell death). The people who feel this the least are ones that have a precise circadian timing. In our world today that is a rarity. That may not translate to an immediate change but I look at akin to tightening a rope, it is a literal sentiment indicator.
Thanks I will read with interest
This one is about left and right brain…
Adding to comments. New lows is creeping up…
Banned By Elvis? You out there, buddy??
Your “chart that never lies” rolled over, and went on a sell yesterday – (I believe)
Figured you’d be all over it today….
Too much canned gas whipped cream?? 🙂
Elvis is setting up a WCG factory in a tax haven.
Tuesday morning update. US large caps trading sideways in a very narrow range. A big move should be coming, up or down? I maintain it has to be down given sentiment, allocations, neg divergences. RUT had another down day and is leading the way along with junk bonds. JNK shown below: note it started falling 2 weeks before stocks in the last two instances, so maybe equities can in fact eek out sideways into the weekend’s new moon before starting their decline. We’ll just have to see day by day.
Hi John H.:
In response to your question above about others calling for a top right now. Harry Dent “seems” to be trying to call one, but also seems to be covering his bases, if there is an all time high rally after the new year.
He still adamantly claims that 2015 is the start of the “Greater Depression”.
Here is a link to the article about the Mega-Phone pattern.
http://economyandmarkets.com/markets/dow-jones-markets/dow-jones-creates-a-pattern/
If the bradley is correct again the turnn will be this thursday or Friday and we will have a decline till december 6 or 10..
Auto short on ftse at 6710
SP just breakout from a bullish flag on H4 chart
Gold well ahead again.
As I have said the last few weeks, keep an eye on the Hang Seng. The following chart doesn’t show todays 267pt drop but it is beginning to look very bearish for the HSI. Yesterdays outside reversal looks horrendous given where it occurred.
Also AAPL’s reversal candle yesterday was very ugly.
http://stockcharts.com/h-sc/ui?s=$HSI&p=D&b=5&g=0&id=p19118074732
The other market to watch is the AUstralian All Ords. The AORD is strongly correlated to global growth via it’s predominantly commodity based economy and the fact that the RBA does not adopt an interventionist approach, so therefore it tells the whole truth and nothing but the truth.
The All Ords chart actually looks the worst of the bunch.
http://stockcharts.com/h-sc/ui?s=$AORD&p=D&b=5&g=0&id=p12148059371
Gold spike a result of the Jerusalem news?.
Whats the Jerusalem news? only seeing Abe announcing sales tax delay until April 2017, not sure if thats related to the spike. but will take it. good action. we just need price to hold here then it would confirm a false break down on previous swing point and negate yesterday’s shooting-star-like candle. Next target 1225 area.
stocks are just too boring comparing to gold
Hi John – So far my call is playing out. Internals continue deteriorating and confirming (hy, bonds steady/lower, gold, erratic fx, iwm, vix, nymo, european volatility) that we are at most 9 trading days (or marked by new moon) before we get another substantial dip (at least 12%) or potentially a crash in the 20% range. Im maintaining that, above anything else, the market’s inefficiency is playing out and we are seeing the same ~3 week lag after QE ends for the market to price it in. Japan GDP is still risk on as I write this, but believe this is will also be priced in with the same delay. Market psychology is clearing out another set of shorts before turning lower. I have real money at risk for this downturn to occur before opex in Dec, so I write not to convince others o, but mostly to validate to myself. thanks for providing this forum.
Self validation or denial, either way you’ll be broke by OPEX.
If you are looking for a December crash/severe correction,
you are fighting against seasonal strength, large buys backs
and managers chasing 2014 performance.
Possible, but the odds are stacked against you.
My own take FWIW is that this has to reverse here
and now.
Exceptions to this would be some seismic outlier
event.
$/Y double top would say so. Gold and silver say $ index being repelled at 88 – would need to test multi year rectangle at 74. Stocks down, Commodities up, Yen up.
The reason why Europe is up is partly down to JPM advising to sell US and buy Europe….I guess they front ran that one….as usual…
J
Technically giobal stock markets are in a bear market including the US by “broader measures”.
It is only the US majors that are making new highs whilst everything else made lower highs and lows in October.
What we are seeing now are markets preparing to rollover again. If it were not for the efforts of Central Bankers we would already be much lower.
I know many will disagree but looking at the whole picture tells it exactly way the way it is.
And that is WHY gold is now reacting higher. Not because of anyrhing that happened in Israel. It is beginning to respond exactly as it did in 2000 and those that have had the b%#*s to buy into gold and gold stocks on the recent fear mongering mania sell off in recent weeks will make mega bucks in the months and years ahead.
In over 30 years of investing I have never ever in my life seen a sector so hated and driven down as the gold sector was the last few weeks…….A BIG THANK YOU from my circumstances must go to Martin Armstrong for helping to create the fear that has allowed me the opportunity to accumulate gold and gold stocks at levels that I never thought possible. This man’s following and influence should not be underestimated. I have no doubt in my mind that gold will be many hundreds of dollars higher before he admits that the bottom was made months before ie November 2014, …….NOW!
My only remaining question, of which nobody could possibly know, is HOW MANY investors did he drive out right at the bottom?
Some think the Fed controls markets, some think that Armstrong does. Really, that’s a very simplistic view. Gold and the miners have probably not bottomed yet, but will do as markets have their final rally into 2015. Armstrong is generally an honest and savvy guy, I’d mock the gold bug writers, not him.
Gold may be reacting to the ECB speech yesterday BTW. They will QE into gold, be assured of that.
Allan,
His models say this in NOT the bottom. Just a minor bullish rally, then down again. Sorry. Look to January.
Japan stuck in deflation. Political change and cb action just s-t noise. $/y making new lows in the 60s over the next 1-3 years as a logical consequence. Major implication for most asset classes.
Allan, cash is the most despised asset
of all with ZIRP.
Japan shows that CB’s lack omnipotence,
something which uber bulls overlook –
understandably as the FED comes close.
Longer term the business cycle bites back.
Unfortunately for those net short US markets
it’s the US cycle that may be the last to roll over,
possibly Q3/4 2015.
Once this happens no amount of FED intervention
saves equities from rapidly de-rating.
GM, I take Allan’s point that sentiment is
hugely negative and it does take guts buying
now, as is always the case when near the fear
and revulsion phase in any asset class.
Cash is there now, it’s despised as an asset class.
I was addressing his Martin Armstrong point though. Agree re sentiment, I am a regular gold buyer myself.
Yes Phil you are right. Most people forget that cash is just another asset class and until a few months ago the USD was the most despised out of the lot!!
S&P VIX retraced 50% of move up 11/17, methinks this is it for the day. We could have reversal here.
And you’re wrong yet again, it’s the 18th, we are moving ever higher.
1/2 percent here, 1 percent there–where will it end?
I agree with others here who have said that the seasonal pressure this time of year makes a crash extremely unlikely, so I’ve been waiting for a pullback to get long. But with last night’s ramp job in Japan and this morning’s frantic buying in Europe and US markets, I’m thinking the pullback needs to start very soon. We will move into the negative period of the lunar cycle next week, but that still gives 4 more trading days (counting today) for the market to rocket higher. If we continue higher at a pace that’s similar to today’s move, we’ll be over SPX 2100 by end of week.
Jokingly…. I have converted to BTFD believer.
cd you mustn’t joke about what has become a ‘religion’ to a host of people. Lol.
Defensive stocks leading the rally. Cyclicals down.
https://pbs.twimg.com/media/B2u-vVGCYAIoHKN.png:large
HYG, JNK, and HYLD all down slightly (subject to change) as well….
IMHO, this is ~not~ a healthy rally……
H4 chart of SP bullish flag worked. Target 2570 at least. Seasonal to be disaster this year, except the second mid term
Frustration defined: The plethora of extreme technical and fundamental indicators John has shown us that are highly correlative with tops, have only seen higher prices. Megaphone tops all over the place, but just higher prices. Nasdaque McClelland Oscillator and summation index sell signal yesterday, higher prices so far today. The scary aspect is the correction we did have was it, and reset the mkt for several months up!
So what is wrong? I keep going back to the credit cycle. Almost all tops are “caused” by a significant rise in interest rates or a 5% inflation or deflation rate. A significant rise in rates in current conditions is a 15 month high in both short and long term rates. Has not happened yet. The bear market in commodities, gold, silver, copper, wheat, corn, cotton, and especially oil, plus the bull market in the $ make me think the deflation criteria should be met, but obviously not yet. The new contributor Richard Issacson pointed out the monthly MACD. It showed rolling over in a similar top configuration to 2000 and 2007 only at an even higher level, but no sell signal yet – more frustration.
I was hoping that John Hampson picks up on this as it backs his view most strongly. Take a look at the monthly MACD of Crude, Copper, Silver, and the Australian Dollar. Clearly, Crude and the Australian Dollar are in strong downtrends that will continue in Price and Time. “Dr.” Copper is setting up for a renewed downtrend in Price and Time as the %D and %K of the MACD have converged, but not crossed, and are likely to re-diverge to the downside as price collapses. Silver is not a precious metal but an industrial metal as its monthly MACD is doing the same as Copper. Gold is in a continuing strong downtrend just like Crude and the Australian Dollar but I know that goes against the beliefs of most on this blog including John Hampson. However, it backs up what Trader Dan has been and continues to post on his blog about Gold (he hasn’t posted here in over a month that I am aware of).
Given that the Australian Dollar is a proxy for the Chinese Economy points towards an implosion of the Chinese Economy. All the above points towards the crossing of the %D and %K of the monthly MACD of the DOW as THE time when a big move to the downside will happen. To see the power of this technical indicator on monthly time frames take a look at the US Dollar Index. It crossed in August and in September price of the US Dollar soared. So “if” a cross occurs for the DOW for November then that points towards a “crash” to occur in December (and beyond).
Opps (a Larry Williams term) it is not the %D and %K but the MACD and the Macd “signal” lines. Sorry about that. I am new to this blog and got my technical indictors mixed up.
Andre’,
I believe the examination of Mercury will be fruitful. An interesting factoid about Mercury, it is by far the densest planet (after Earth, although almost as dense). This has implications for solar activity, CME’s,… Also important, its orbit is by far the most eccentric of any of the planets (well, far away Pluto is a little greater). I have been considering your observations regarding the ~109/110 day cycle that you have mentioned several times. Also, your comments this weekend regarding the Mercury conjunct and retrograde alignment mentioned by Bayer (who believed that Mercury was the key planet, although that is a bridge too far for me).
The following focuses on Mercury synodic cycle of 116 days, which is close to the ~110 day cycle. When looking at market prices, weekends can ‘alter’ cycle days a little. I examined Mercury from 1999 through 2014, and confirmed that conjunction to conjunction is 116 days on average. Interestingly, the minimum is 104 days, the maximum is 132 days, and the standard deviation is +/- 9 days from 116 days. So there is considerable variation of actual which depends on the period examined, and 110 days certainly falls into the standard deviation range. Of course, this Mercury conjunction cycle could be coincidence to ~110 days, or perhaps a retrograde filter narrows all conjunctions to the ~110 day conjunctions. I will examine that next. Also, related to retrograde, I found that a Western (Eastern) to Western(Eastern) Elongation is about 115 to 120 days. Do you have a sense at how stable the ~110 day cycle you have mentioned is?
SC
Steve,
I make a distinction between a harmonic cycle system for longer term analysis – on a longer term everything averages out – and an actual cycle system based on natural cycles.
Natural cycles are (almost) never stable. That’s why I look at ‘real’ things like apogee/perigee cycles, tides and sun/mercury conjunctions. This gives constant calibration of your cycles in time.
The real trick is in combining these two systems.
Another thing is that I recently had to accept that both the 27,5 and the 29,5 day cycles are active. They synchronize roughly every 410 days.
So now I’m thinking that for a longer term harmonic system an average would be better. I tested a 28,5 day cycle and this looks promising. And it gives us a 114 day cycle that better matches the cycles you mention.
But the real advance is in combining two natural forces : gravity by sun and moon and electricity by sun/planets. That’s why I now also look at Jupiter/Saturn cycles.
The Mercury/Jupiter/Saturn combination should give an independent electrical cycle system. Seen some fascinating things already.
Cheers,
André
Jesus people it’s mid day 11/18, and the Dow and SPX are making fresh new highs.
Are you gonna quit yet, or wait till Dow 18,000?
I only ask one thing of you, Vinnie….
~Please~ tell me when you sell, and your reason for doing it…
Thank you….
Barry with all due respect….ask him since WHEN he has been long?
Actually my guess is that he is NOT TRADING!! Just my GUESS.
Your tone is of frustration of being so very wrong for weeks on end, and the posts dating back to 11/1/14 here bare that out. It’s a timeline of denial
You could have asked yourself, are you helpless?
Thanks for your ‘analysis’ I’ll take a ‘deep’ look at that. By the way how are your hands?
They’re better thanks, meanwhile I get to be a whiz with Dragon Naturally Speaking. It took about a week for the speech recognition to work well. Very fun actually.
Good to know that you are on the mend.
When any of my call positions are triggered by my daily moving stops.
I just keep raising them, as the market keeps rising daily. No need to watch or think about it. Just set it and forget it.
Kent, I think it is also SPX earnings.
The recent Q has been solid, if unspectacular.
As many, including John have referenced, multiple
expansion has overwhelmingly driven valuations over
the past couple of years, even allowing for this and reduced
expectations, SPX earnings continue to increase.
And the current consensus on 2015 looks favourable.
Last week I referenced the bear market in KGF
the LSE listed home improvement retailer,
as an example of a dramatic derating on reduced
earnings expectations.
The KGF mean consensus is for a 5% EPS drop this
year, 12 months ago the consensus was for an approximate
8% increase.
This is what needs to happen, or the anticipation of this,
to tip US markets in to a dramatic decline and new bear
market imv.
Corrections can occur without this happening,
as with the October price action.
Ironically, all three HY ETFs I mentioned earlier, are even lower right now…
As of this moment, I personally haven’t seen a divergence as large as this one, ever, in HY bonds versus the S&P…
Most fascinating…..
yeah this precedes all falls
this has been screaming all year but no one is listening
http://stockcharts.com/h-sc/ui?s=HYG:TLT&p=D&st=2013-01-21&en=2014-11-03&id=p03210192255&a=370629538&r=1416332174928&cmd=print
if it’s been screaming all year and no one is listening, then doesn’t that suggest that that chart is not a leading indicator, that it’s not predictive?
Presume you meant that for BBE, but for me, I don’t use that chart…
And as you noted, it doesn’t look helpful to me as well…
Barry, yes for BBE. I clicked on Reply to his post, not to yours. That’s why my reply is indented underneath his.
Most if not all Index and stocks follow their own path, but along the way they might meet and travel together down that path, and eventually they go their own way. So the only leading indicator is its own indicator…
oh as much as the BULLTARD nonsense hurts the time frames are stretched so very much and this is how a top looks
If the site would let me post multiple links I’d give you examples here but I’ll have to post later due to time.
Trust that the bell tolls for thee…. and thee….and thee…
for now know that XRT pulled back to support at 90
wait for it
http://stockcharts.com/h-sc/ui?s=XRT&p=D&yr=0&mn=5&dy=0&id=t15781211143&a=370502282&r=1416331535112&cmd=print
Crash delayed to 2015 or beyond! The best we can hope for is a sideways market until then. I might have given up on this one too quickly and John’s evidence strongly points to a drop but thats how it is. Draghi has mentioned he will do more so many times yet there is no action. Markets seem to love it.
vinnie just sounds angry….imho…..
BTW, plenty of us I am sure have been and are long on here…..just because the site is bearishly skewed doesn’t mean all the people trade that way….
imho
J
Who’s angry? I’m pointing out the ineptitude of self fulfilling commentary about a pull back that never happened. It is the definition of insanity here.
I think you mean, “never happened ~yet~”…..
But to be fair, there was that little thingy in early October….
Perhaps you noticed…
And not saying it definitely ~will~ happen again….
But am saying…..that of all the things I look at, they look like the ~probabilities~ are that it will….
When? You’ve said that for 2 weeks straight.
When Dow 18,000, 18,500? When?
No idea “when”….
Just watching the slow deterioration, as the market climbs….
My system is 50% short on 11/06, and 100% short as of 11/14, and as posted here…
The market was kind enough to be up today, and I added my last level of shorts on earlier this morning, so yes, I’m currently more than 100% short now….
That’s for ~me~, from an actual trade perspective… The system itself only has 4 readings…50% long or short, and 100% long or short….
I will be holding these until my system says go long…. That won’t be today…
Follow my system, don’t follow my system… I don’t care either way….
I’m good with it…
But good luck with ~your~ trading…
Trading options, I’m sure you’ll do well…
Your system will make you go broke then. The move today is just another leg up with no end in sight.
And as for trading options, I do so for my brother, I no longer trade for myself. I just made him a bundle over the past week, and FYI, I’m gonna close his position at 3:30 today to lock in his gains. Doesn’t mean we can’t go higher, just means the ride up was awesome, no time to be a pig.
“No end in sight”, yet, you are liquidating your longs….
No need to respond, I just learned all I need to know….
Please keep posting your signals. I’m watching with interest. How long have you been trading this system? It’s something you devised? Obviously it must have a decent track record or you wouldn’t be taking the trades. Backtested with something like TradeStation?
Good luck with your shorts!
I’m hoping I’m ~not~ bearishly skewed…..
I’m just bearishly skewed ~right now~… 🙂
Then you’re getting killed today yet again, as we make all time highs in the Dow and SPX. Fed meeting tomorrow will cause another wave of buying.
there’s no Fed meeting tomorrow. Just a release of the minutes from their last meeting
Just so you know the facts, and not just make uninformed, wild-azzed guesses, and pass them off as facts, my trading accounts were up 0.74% yesterday…
Today, at this moment, I am down 0.94%…
So down, yes… That happens sometimes, as you might be aware…
But getting killed?? Not hardly…
Relax a bit, Vinnie… Life will go smoother that way….
You’re right. Keep Calm and Carry On….losing profit while you wait for this big drop. I’ve taken beatings like everyone else, but that was from fighting the tape.
At least my brother benefits from all the years of mistakes. Trade the trend, it’s your friend 🙂
I’ve emailed John, and I applaud his technical ability and thoroughness, and at that time I was holding puts, which thankfully I sold. His problem is not accepting intervention and manipulation, which trumps all TA.
Vinnie, there are different ways to trade. One way is to wait for confirmation of trend change before taking a position. You could say Price is king for that method. You could also say that that method is prudent because you’re not anticipating the market.
Another way to trade is to anticipate a change of trend. Traders who believe Time is more important than price use this method.
With proper money management either method can work.
We seem to have a lot of folks posting here who are using methods that involved time rather than price.
And yet a third method is looking at the big picture, fundamentals, sentiment, cash flows, cycles, and technicals, and then taking a position based on their conclusions from their analysis. I think John’s method falls into this category.
My point is that your method of trading is not the only “right” way to do it. Yes, you’re making money right now. Good for you. Maybe you consistently make money in both up and down markets. If so, good for you. But these other methods can make money too.
An occasional post from you pointing out that the market is still going up could be taken as a friendly reminder. But when you come on here with dozens of posts reminding us (yet again!) that we’re doing it wrong, it’s at best just not helpful and at worst quite annoying.
I don’t see how “waiting” for a pull back during the most historic bull run makes any sense other than you state it as if to console yourself. By your measure, waiting is a strategy, and of course you can wait as you have, for so long you miss the trend at hand. It’s like waving away a 7 course gourmet meal, bcz you’re sure there is going to be a scoop of vanilla ice cream for dessert. Trade what’s in front of you, not what’s in your wish basket.
that’s because you see your way of trading as the only right way and everyone else’s way is wrong. Gann360 is one trader who anticipates both time and price and makes money at it. There are lots of others.
Your way works for you. Great. But that doesn’t make other methods wrong. Just different.
To your last point. Your endless posts as a group for TWO WEEKS calling for a pullback that never came isn’t annoying? You’re too funny. Stop swimming in denial.
my endless posts? I don’t think so. If you mean John’s posts, well guess what? It’s his blog. If you don’t like what he’s posting, you don’t have to visit.
and, as the Spiral forecast – velocity into 14:00 est today. here’s a link through to tomorrow’s close. https://twitter.com/mjmateer
Thanks for the daily Spiral forecast. Are you finding a tradable advantage by using the GEM system? Would be fascinating to have a % of tradable events with positive returns using GEM. Even a guess would be helpful and if it is greater than 60% I will start tracking your Tweets closely for trading guide.
I can’t give trading advice except to say that it’s one thing to have correct information and another thing to trade it well.
Will continue to follow your posts with interest.
Peggy, is the high today based on Spiral forecast 19th Nov an imporant one or just a short term consolidation ? How do you interpret that ? Many thanks.
Heard an old timer liken silver prices to a pig in a fire hose
just picturing the pressure required to squirt a pig through one of those
could go quite a ways if he is right
blastoff! lol
when guys like Peter Eliades are ready to throw in the towel then you better go back and check the data.
sentiment is as outrageously bullish as it could be
Dear Old Saint Peter, better listen up Vinnie!
Maybe it is different this time around. Scary read by Hugh:
http://www.zerohedge.com/news/2014-11-18/hugh-hendry-i-believe-central-bankers-are-terrified
We should rocket higher this week maybe hitting 18k dow. Have gone long dow and s&p. Short dax as a hedge. Bear case is dead this year but if you have deep pockets and can hold out over December I guess you can remain short.
rocket! make sure that flame out isnt in the cards
http://stockcharts.com/h-sc/ui?s=$VXV:$VIX&p=120&yr=0&mn=5&dy=18&id=t95495057062&a=376901291&r=1416338823808&cmd=print
Krish, the 2014 bear case was dead 3 weeks ago.
Shorts unfortunately are likely to be utterly crushed
in to year end.
I was giving it more time to play out but am now happier to go long. I have been so wrong being bearish so I’ve realised just do what the central banks want us to do. All TA and other analysis has been proven wrong if timing is taken into account. If I’m wrong and the market crashes then just my bad luck.
Good job Krish. I am just content to be in cash right now. Most of folks on this board, myself included, had expected a significant drop this week. How wrong have we been? At least we now know what direction the markets are moving, and glad that you are taking advantage of the move. This market kills both bull and bear I am afraid, so I am staying sidelines until the clear reversal is observed.
In my count, I agree with Phil that the crash case is pretty much dead. But I have yet given up on the correction case.
minimum target 2200.
bears completely destroyed. I’m sure there will be difficulties to going up vertically without bears looking how to lose their savings.
eh? we had a 10% pullback only a few weeks ago…..
It’s always bullish until it isn’t all of a sudden……just be careful whichever direction you are trading….
For me and vinnie who have gone long from 668 SPX and every 50 points since then, well we can just talk down to everyone like chumps…..****
————>
J
Simon, we have all been on the wrong side
of a trade, if you have been involved in markets
long enough then it’s a certainty.
As mentioned earlier if you are short now
then just about all major odds are stacked
against you, a bull market in major US markets,
seasonality and many investment managers
desperately chasing 2014 returns.
That is before you factor in supportive US
earnings.
It’a a potent cocktail.
the ten percent correction gave the so long awaited …chance to close shorts!. It has generated a significative low . today action is strongly negating the megaphone pattern that every bears is looking at. I continue to say that BANKS anc central banks totally controlled the market through derivatives. buibacks and retail buying/selling have importance only when BANKS decide to change direction. Who knows if data that we can collect from worldwideweb is partial, a fake or God knows whatelse. They decided in 2007 that market should have gone to 666, they decided that a housing bubble should occur, they pump and destroys emerging markets, they pump and then sell european markets, they pump and destroys gold stocks sector, they pump tesla and other tech stocks to absurd levels and so on…. They have created the sell off in October, buying at the low, and then have decided a target over previuos top… and be sure we will continue until we reach that level also if a nuclear war will start tomorrow. Divergences, indicators seem to work, actors improves their “knowledge”…so BANKS change the market…and you lose money. Only the fews inside the system can profit REGULARLY from this GAME. Traders are soldiers fighting against missiles…someone can survive only because of statistics.
I think sp500 is headed for 3000 in 2020 for the third bubble in two decades on U.S. markets, one of the most powerful tool of supremacy for UNITED STATES.
I’d like to be american. You are the winners on this planet..
just a couple of more potential BULLTARD days here
vix isnt going to tolerate this much longer
this should come unraveled like a crack whore at the sight of a Jackson
How high was VIX during tech bubble if compared to today. Do you remember?
The VIX is about the same level right now as 9/2000 secondary peak. Interesting huh? 14 now vs 16 then.
elvis,
with respect you have been saying the same
for weeks, just in slightly different ways.
The world won’t listen – regardless of what
your charts are screaming.
oh but you listen…
with respect!
how humans love to say FU with respect! lol
stay long phil
please
24th was a buy signal – and I’ve said so
LAST MONDAY was a sell or anticipated sell
look at the archives here
WITH RESPECT! lol
my dad went into the Hospital on the 24th so I couldnt trade that signal
short now tho to be sure, respectfully! roflmao
BBE, serious question….
Your chart that never lies looks like it went long an the 17th, for entry on the 20th?? Is that not correct??
Love that chart, BTW… Just watching it right now, but seems like a keeper!!
Anyway, curious as to why you have a signal on the 24th then…
Obviously you look at other things, but what’s better than that chart?? 🙂
Also, sorry about your father….
I take care of my 87yo mother, who more and more drifts towards dementia as well, so appreciate what you went through… Good man!!
Barry
so phil, do your passive aggressive behaviors actually work to intimidate most people? or is it a technique they teach you at the NSA?
http://personalliberty.com/new-nsa-docs-confirm-long-held-blogger-fears-there-are-government-trolls-among-us/
Emotion and trading is a losing combination.
so how is that important to you with regards to me oh 2 dimensional NSA proctor?
passive aggressive behavior and a receding hairline are sort of a losing combo too! wow!
Next time you wonder what possible benefit skunks play in ecosystems:
Skunks are “nature’s sanitation engineers.” They are an important part of our ecosystem and have a hearty appetite for grubs, insects, mice and baby rats. They also rid the environment of cockroaches, gophers, moles, “road kill,” and even poisonous animals such as rattlesnakes and black widow spiders. If you have an insect or rodent problem, a skunk in residence might be just the ticket. Sometimes we may not value another persons posts or opinions but maybe just like a skunk they provide a very important service to the whole.
this is the scenario that i worried would happen, but needed to be aware of its possibility – a squeeze into 2050 in ES, and it did. as we speak we are backing off highs with shooting star on the hourly, however the daily we clearly broke above the megaphone. not going to step in front of this freight train in the time being while i reassess the technicals overnight. all said and done, this is an interesting day with every asset class up – gold up, bonds up, stocks up.
Junk bonds down….on lows of the day….
Muy importante…
indeed, i dare say this is a spike to 2050 ahead of option expiry. i do want to see a bit more price action tomorrow before putting on medium-term shorts. i think we will hang around this big number for rest of week, not too worried missing out the top tick.
not seeing the break above the megaphone in ES – have it at 2050 for today
interesting, though it did break on the SPX and SPY. now it’s a matter which takes precedence.
drunk again……?^^
WCCG!
Barry, even that chart by itself didnt confirm until that friday
I use 3 bar net and the indicators in that chart and other stuff as you say.
http://stockcharts.com/h-sc/ui?s=$NAHL:$NATOT&p=D&st=2014-07-14&en=today&id=p17151796319&a=369189956&r=1416345212773&cmd=print
I’m not sure were in this mess of a chart you see a trigger on the 17th. The earliest
buy signal I see is the 20th but the way I use net line and the 13,65 ema as an FLD gives me friday the 24th.
similarly we have an early sell and the top of the cycle here which seemed to be confirmed in todays eod sell off into strength.
http://stockcharts.com/h-sc/ui?s=$NAHL:$NATOT
Hope that comes out right…
Looking at the MACD….
I’m ~sure~ I got this chart from you, but then again, I never thought we’d see 2050 today, with HY giving it up like it is….
So there’s that… hahaha
that’s the default version stockcharts posts when their servers get confused
and that happens alot
that said the macd doe give pretty good signals!
and it is leading the SPX so that’s another reason to sell to cash or short to tolerance
!!!!!!!!!!!!!
add spx to your chart
http://stockcharts.com/h-sc/ui?s=$NAHL:$NATOT&p=D&b=5&g=0&id=t26616524286&r=1416347792675&cmd=print
one the default high/low chart you need a move below the 13ema to confirm the macd signal
Guys, I’ve been warning some of you not to short the market. How does it feel getting school by a woman.
Ummm, did you mean to say “schooled”?? 😉
Feels kinda funny at the moment…
Why does gender make any difference?
guys are slow. usually. women make superior traders.
I don’t know enough female traders to have an opinion on that:D
for all long term traders $/Y just hit 117.2 with the 50% Fibonacci from the 1990 high and 2011 low at 117.71
$ index unable to clear major resistance at 88. Euro/Yen running into major horizontal resistance at 147.3 dating back to ’91 and ’96. Pretty significant long term chart levels here for the carry trade which lends a lot of support for John’s research and short thesis.
an elliott wave on the move up in $/Y from 2011 to 2014 yields some harmonic relationships being achieved here. Wave 5 at 273% of wave 1 which looks complete. Text book is 262%.
when comparing all retracement rallies in $/Y since 1990 the largest has been 85% with the current retracement at 86% (other retracements from multi year highs at 72% and 67%). Again confirms we are probably there in terms of the carry trade soon to get reversed.
Andre..Andre.. I think i know what you are thinking. me too….
And what would that be?
Thanks all, new post is out