

The short term first. The Dow Jones World stock index looks like this:
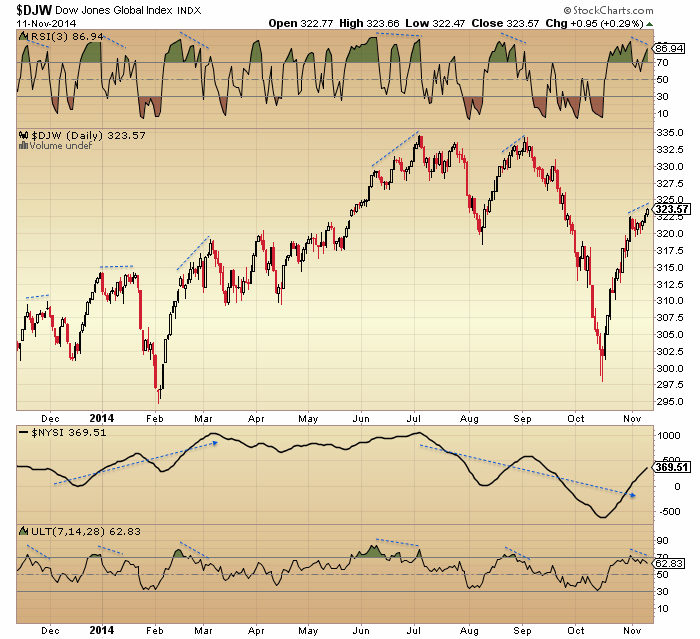
Source: Stockcharts
The current high is someway beneath the July/Sept highs and the lower high lower low trend in tact. The last week and a half has produced negative divergences in RSI and ULT and the previous highlighted instances add to the case for the rally imminently failing.
Bullish percent to put/call ratio and cyclical sector to defensives ratios also show a telling divergence since we turned into November, suggesting the edging up in price over the last few days will be reversed.

By cross-referencing indicators I’ve previously explained why the most relevant analog puts us equivalent to November 2000, and I am still looking for the bar following this box to be delivered this week to mark the trend change:

Interestingly, precious metals and miners have built out a potential reversal base these last few sessions, and back in 2000 at the exact same point gold made its secular bear market low, marked above.
We can cross-reference this with the gold/miners ratio that has reached the same washout level as 2000:
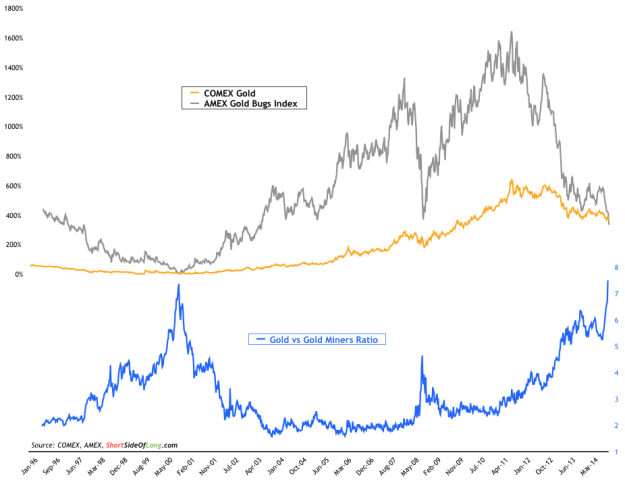
Source: ShortSideOfLong
And gold miners sentiment which also reached bottoming levels:
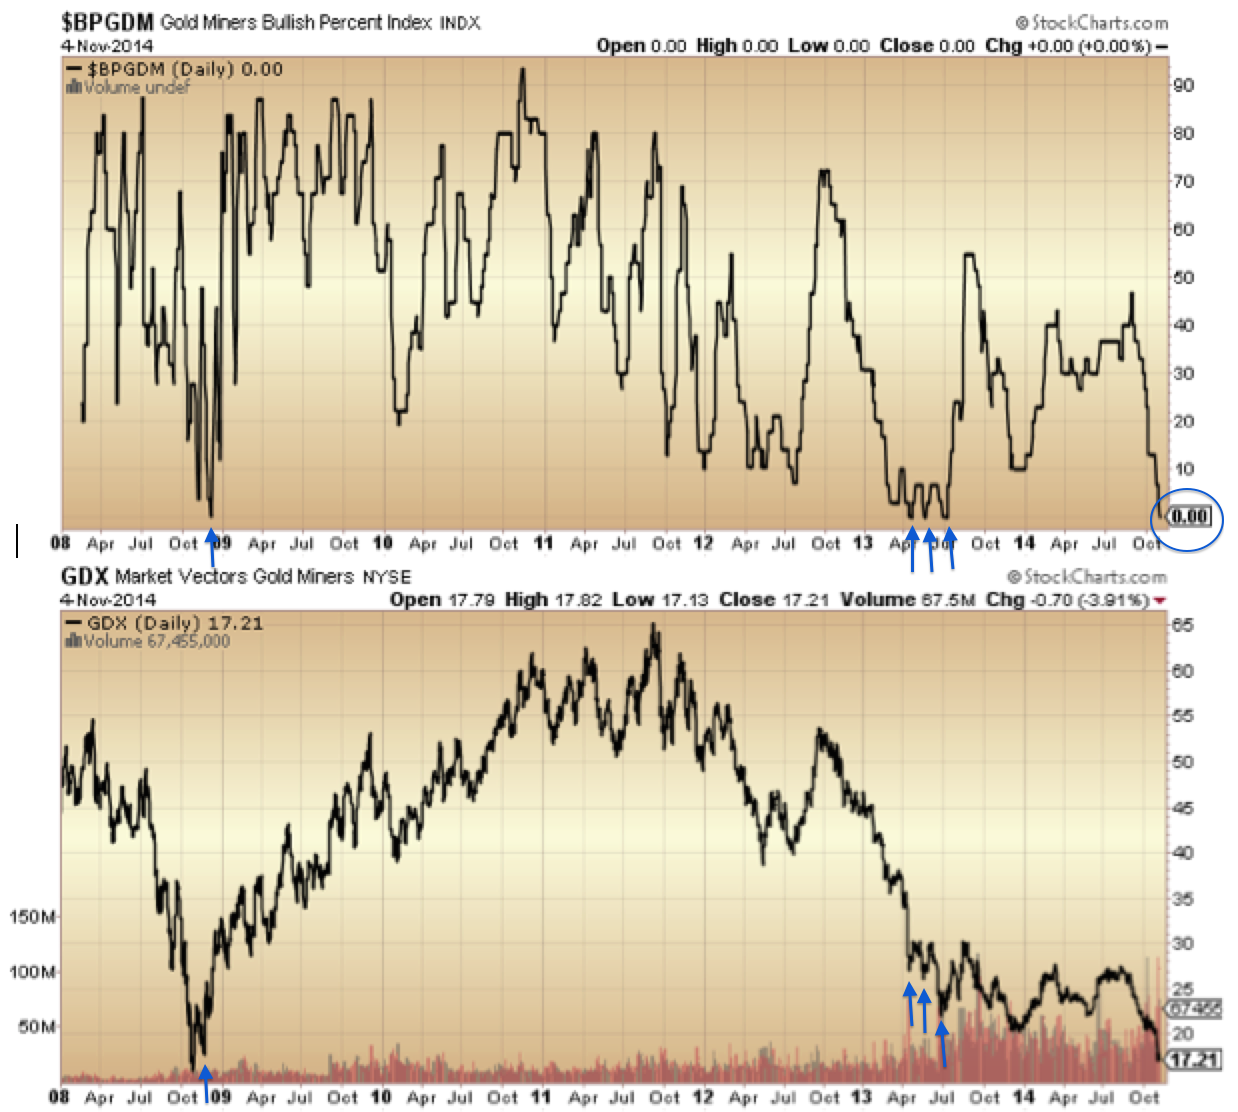
With equities at the end of their bull market topping process, this set-up looks compelling as the launch point for gold into a new cyclical bull within an ongoing secular bull. By demographics, the cyclical bear in gold from 2011-2014 has just been a pause in a longer term bull market that should extend to the next solar maximum of circa 2025.

On the flip side of that, equities should now enter a new cyclical bear within an ongoing secular bear. One of the most common misperceptions out there is that stocks are in a new secular bull market. But demographics, inflation-adjusted stocks and p/e valuations reveal otherwise:

Viewing stocks relative to treasuries reveals more clearly the major tops and bottoms. Below, RSI and TSI show an early warning system for the major peaks. They flagged again by the end of 2013 and have since been divergent, as stocks:bonds has made an identifiable topping process.
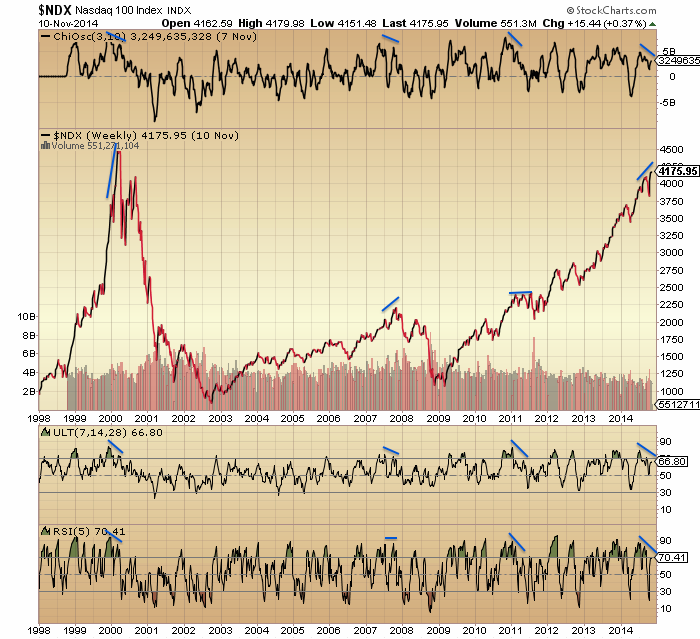
 The Nasdaq 100 index has had the most parabolic shape of all the major stock indices, but we can see below the same telltale buy/sell pressure and momentum divergences as the previous major peaks have been in place since the turn of July 2014. Those divergences lasted 3-5 months in the earlier events, and the current divergence has now been 4 months.
Finally for today, here are the smoothed solar maxima of the last 11 cycles plotted against Q ratio valuation for equities. Barring the 2000 outlier it has reached the same topping valuation level here at the 2014 solar max as previous solar cycle highs, and should be destined for a true washout level of circa 0.3 before the secular equities bear is over.

Underlying chart: Doug Short

I want to cover my shorts we must be close.
Man, do I know that feeling! Complete empathy.
Thank you John, for the new post.
By the way does anyone remember the 25 and 7 important number conspiracy from July this year?
I personally don’t believe in hidden market messages, but in did notice out of hours and market open highs on Dow and SPX
Dow 17656. 1+7+6+5+6 = 25
SPX. 2041. 2+0+4+1 =7
Or even
20+4+1=25
Spooky, but I still do believe it.I suppose you can always make numbers fit how you want them to fit
5+2=7
John, in November 2000 the 50 dma had just cut the 200 dma, so the SPX was in a completely different stage of the topping process than today, if there is a topping process at all now. I can’t understand, how you can ignore such simple internal measures of the state of the stock market in your chart comparisons.
Yesterday you published an overlay and correlation chart to SPX 1955. Last year mrci published a historic chart, which showed almost as strong a correlation to the DOW at the beginning of November as the 1955 chart is displaying now. And the correlation did indeed continue that strong until year’s end.
As to the resolution of the 1955 correlation we can can indeed expect a 2-3 p.c. crash near term and maybe a 5 p.c. decline at the end of January, before the SPX rises almost 10 p.c. above where it stood at the beginning of November. Even if we were to get a quick test of the recent bottom and though the correlation can stop at any time this continuation would be very much in line with several stats I mentioned here and which I had learned to know from Schaeffersresearch.
For today, tomorrow and Friday Armstrong’s computer program is displaying three directional change signals in a row very alike to mid October. We will see, how they will play out.
To be clear, I posted the 1955 chart as just an example of a megaphone top playing out at this time of year. In no other way do I see that year as relevant.
Hi john
This guy has a few scenario’s that will play out like you mentioned. I have been following him as long as yourself and respect both. He has a 1945 year chart that’s fits in with the 60 year interest rate cycle this year 2014 – 60 yr = 1944 yr ….Where as 1929 yr + 60yr = 1987 + 60 = 2047 yr. one year out is a lot of time error..
http://tinyurl.com/mpxjl4v. Here is the link…
2014 – 60 = 1954
Hi,great Q ratio chart vs SSN peak.
would be great to have the SSN minimum on the same chart too, which I believe will tell the full story for SSN.
I believe that the market has now entered a bearish window of approximately 4 sessions lasting from 12th-17th November. A bearish window is defined as a period of time when a swing high is most likely to occur and a resulting move down ensue.
There are indications to suggest that there is a possibility of a whipsaw back up on Thursday into the 17th (another high) so any short positions should be traded around this possibility moving stops accordingly to lock in gains should the whipsaw eventuate.
This bearish cycles means we are likely downwards into the 21st-24th November which should be bought providing trend indicators remain upwards.
Many thanks
Daniel
http://tradingtweets.wordpress.com/2014/11/06/12-17-november-high/#comments
I like that Q Ratio chart John – original and very useful. That SC24 timing circle shows just how critical this period is.
It also shows how significantly market action changed during 1995. So everyone will have to decide whether the 2000 peak in an outlier, or the start of something new. It strikes me that the 2009 low is also an outlier – that’s two outliers out of two since 1995.
I agree with Theo (above) that I can’t see a medium or long term topping process has started yet. Two moving averages on a monthly SP500 chart have a 99.9% accuracy record in defining cyclical bulls and bears (a 5EMA-Lows, and a 5EMA-Highs). The only failure was August 1998 during the LTCM crisis.
During a cyclical bull, the monthly candles stradle the upper moving average and only occasionally does price briefly touch the lower one. During the 2000 and 2007 topping processes the candles were contained between the moving averages for at least six months before a close below the bottom one, and the start of a cyclical bear.
At the moment, SP500 is still above the upper moving average, and it would take a November close below 2000 or thereabouts to potentially start a topping process similar to 2000 and 2007, followed by six to nine months of rangebound prices between 2000 and 1900 (approximately).
Ref the big change since 1995. The underlying really big picture is leaving the gold standard. Who would have thought that all that fiat money would go mostly into stocks and bonds, not gold. If more had gone into gold, $100,000! That foundation of easy money caused a normal major high to be double overvalued as we got a South Sea Bubble-Tulip Mania 64 month parabolic blow-off in 2000. That reversed the incredibly undervalued 1974 bottom, 6 pe, 6% dividend, and under book. That is normal major low stats. Will 2000 high bring double undervalued low like 1932? I have some old charts with the 200 day ma. Bull markets used to trade off the 200 day. This bull market has tended to find support around the 50 day. That is all the extra money raising all ships, plus the historic nature of the great bull (1982-2000) leading to such a major top.
Interesting observation Kent, about leaving the gold standard and the resulting fiat money causing stocks to become “double overvalued” in 2000. So would it be logical to conclude that the subsequent acceleration in fiat money creation, post 2001, should cause an even more overvalued market next time around? Sort of doubly double overvalued?!
Yes, but I’m working on the major tops only occur about every 30 to 40 years. Also, I believe that the tremendous debt is an extreme drag that can cause a 2008 deflationary risk anytime?
The Genoa conference took us off the pre- 1st world war gold standard, in 1922, averting the huge depression in the early 20s. Mankind’s biggest ever mis-step, which happened to coincide with the rise of democracy and women’s votes. So we decided as a species that a depression was too tough, when easy credit could be created via central banks expanding their balance sheets, which they did by ten-fold from 1922 to 1929. That caused the roaring 20s of course. Approximately 7 years of a debt bubble, which fed into stocks.
The current QE bubble is not far off 6 years old. Will it make 7 years, or even longer? I don’t know, but I do feel that the juice will not be turned off by the CBs (again due to democratic pressures) but that eventually the markets will see a 70-80% bear market.
Just don’t ask me when that starts, I will keep buying gold in the meantime.
GM, nice comment. The Japanese ended what had been an open ended QE type stimulation in Mar 2006. It had generated improved employment, higher inflation, an a cyclical bull market. After stopping, the NIKKEI continued up for a double top in 11 and 16 months later. Deflation reasserted then. Since we stopped last month, that extra year and 4 months puts it right in your time frame.
Raoul Pal is one of the very few guests that appears on CNBC for whch I have respect. He is very astute and very intune with the global economy amd the way currencies and markets interact.
When asked if we are going to reach the tipping point it takes him about 1 milisecond to answer in the affirmative…….
http://video.cnbc.com/gallery/?video=3000329483
As far as I am concerned the BoJ lit the wick two weeks ago. The Japanese have shown scant regard fr rhe consequences of their action.
Like I said in an earler post….. They deserve the tittle Fantasy Island.
If we end with gains today it will be
extraordinary.
indeed. we now have lower lows and lower highs on the 30 min and 65 min intraday charts. As I’m writing this, SPX is very close to touching the 5 day simple moving average which is around 2031. If we break below the 5 day MA, I will add to short positions (which are very small at this point).
Hi John – Thanks for the daily updates as we are at a critical juncture here. Is there an alternate analog for this point in time being closer to the Nasdaq in March 2000? Just looking at price movements, I put us closer to March than November 2000. The action into the peak in March was fast and furious coming similar to what we are seeing here. In addition, we haven’t seen that initial panic selling leg down (I dont see the October decline being remotely close to panic) here in 2014, so we need to see that first to wash out the overwhelming complacency. In Nov 2000, I think that was already done so the action then isn’t as telling.
http://stockcharts.com/h-sc/ui?s=$INDU&p=60&yr=0&mn=0&dy=24&id=p69049290307&a=341905337&r=1415792116198&cmd=print
reversal candle in Nikkei – lower highs in $/Y
If, and it still remains a big if
we are in a topping process, then
another 6-9 months would fit nicely
with a likely peak in SPX earnings.
3 comments above alluding to the same: the price action in US large caps & Nasdaq doesn’t fit being late in the topping process. That’s right, but there are a lot of clues behind price, and that we are at the end of the topping process is going to stun most people out there. A wide range of indicators with different angles plus price action in DJ World and European indices support us being at the end of the topping process. I’ve covered this in fairly exhaustive detail, so refer you to recent posts for more info, but ultimately price action will confirm it shortly if so.
Thanks John. I agree with you on the point in the topping process. We are much later than most think and do not mean to suggest that we are in March 2000. I’ve just been looking at price metrics alone to estimate the range of a possible decline through December, and basically see it being larger than the % decline in Nov 2000. I’m seeing 11% absolute minimum.
There I agree. In 2000 and in 2007 we had already seen a bigger correction by this point. In the last 3 solar maxima peaks of 2000, 1989 and 1980 we had already had a crash by this point. Price in US large caps has nudged up ever higher against the record stretching of sentiment, allocations, leverage and negative divergences here in 2014 and I maintain it is likely to crash hard and fast.
John, with USD JPY fuelling a carry trade, do you see US stocks coming down hard while the Yen rallies even when they are going all out printing? And where does gold sit in all of this? If gold doesn’t break 1180 and stand above it, it’s hard to be bullish about gold or its miners.
I’m no expert on FX. On gold I refer you a couple of the charts above – I see it as bottoming here and rallying hard against sharply falling stocks.
THank you John, I really appreciate your research and upkeep of this wonderful blog. Just wanted to say I have been buying sugar lately, as I am getting a buy signal from my charts. sugar etf SGG
USD/JPY should top out here at 115 and YES Yen will bottom here.
The correlation of YEN / U.S Stocks is like 100% bang on..as Yen is fuelling the rally.
US Stocks down = Yen Up = Major global pain on the horizon yes.
Today 11/12 the polarity of the Spiral flips which results in a negative trend into 11/24 (not the daily trend).
rather not the intraday trend. That is governed by the hourly spiral.
Thanks Peggy, very interesting information.
thanks, Peggy. This will be amazing if it plays out the way you’re expecting it to! Also interesting that that time window has been noted by a couple of others who have posted here, and I believe they are using different methods but arriving at the same conclusion.
Dare I say it, but IF the DAX closes Friday a little below its current level, at the moment down 122pts, then the weekly chart indicators will begin to confirm the bearishness of the price pattern in this chart
http://stockcharts.com/h-sc/ui?s=$DAX&p=W&b=5&g=0&id=p68944551794
Totally…..a weekly “swing high” here at the now “flattened 50MA” will most certainly push The DAX over the edge.
7500 a nice target for shorting DAX right now
Nice little gap down today in SP, proving yesterday’s no volume rally into close is bogus. Es futures broke ST trendline adds to cause we have a short term top, but we need the Dow break back under 17400 to get back inside the megaphone for confirmation. Until then scalping is the name of the game. Gap downs are like trading God’s gifts and usually they get taken away at the open if u don’t take gains based on painful experience. Closing my weekly spy puts at open, and look to reenter shorts on retest on trendline.
Closed spy 205 puts with es at 2028. Flat exposure to stocks still hold gdx calls
Doji bullish reversal in the hourly es, no short until 2040. Charts to follow end of day
And this good people is WHY I can’t wait for the whole God damn sickening system to completely collapse!!
“Which means that clearly nobody is going to jail, however the punishment is far more harsh: riggers will have a bonus of ONLY 200% their base salary for two years to look forward to!”
http://www.zerohedge.com/news/2014-11-12/caught-rigging-fx-and-gold-your-punishment-will-be-bonus-capped-just-200-your-base-s
Allan, I totally hear you on that……..corruption is out of control
No no Doodoo these are legitimate fines imposed for illegal actions…..oh wait buying your way out of a felony is corruption. You are right my mistake.
Allan J P Morgan are probably the worst of the bunch. I take it you have seen this:
http://www.rollingstone.com/politics/news/the-9-billion-witness-20141106
I just read the Rolling Stone article. It is good but truly sickening. Think of all the people who say what a great job Dimon has done (Buffet), and what a total crook he apparently is.
Max Keiser has been calling Jamie Dimon a financial terrorist (among other things) for years. But what can we do about it? They own the government. The government owns the newly militarized police force and the army. Torches and pitchforks ain’t gonna cut it against that kind of power.
So how did you like the whistleblower at JPM. She informed management that $400,000,000 of one 1 billion tranche had overstated income. They paid a $9 billion fine, but there has not been even one prosecution. They used to at least sacrifice some hapless vp somewhere claiming if they had omly known.
Her only compensation will be the movie rights…..which JPM will probably fund.
John, this is one of your best. Your bear case is compelling. I am just waiting for price to confirm your analysis. I am watching for sign to enter shorts.
What price action do you need to see for confirmation? Are you looking for a downtrend to begin on intraday charts, or for a moving average to get broken to the downside, or….?
ok so the cycle shows up this morning
http://stockcharts.com/h-sc/ui?s=$SPX&p=D&st=2014-08-02&en=today&id=p29184750730&a=369529410&r=1415802277356&cmd=print
weak until well into December, then?
http://stockcharts.com/h-sc/ui?s=$NYUD&p=D&st=2014-06-12&en=today&id=t79152647652&a=367854604&r=1415802916230&cmd=print
VO cross zero is when the fun begins
the divergence weakness in NYA and IWM confirmed the breadth indicators like % above 200 and AD lines…
vix needs to get over the 200 ma – for Phil, I do think the vix is being manipulated
🙂
xrt is catching a bid and trying to break out
consumers sector is going to give the dip buyers some encouragement
can the cycle be denied?
The vix may not be being manipulated. This may be another answer:
http://wolfstreet.com/2014/11/09/the-great-volatility-crush/
manipulated or not the low dream state of the vix will not last much longer…
0.2% drop on the SPX atm and
that is with Ukraine.
Incredible resilience.
Higher US close?.
Ukraine is all western propaganda BS. Nothing doing. As likely to turn into the emperor-has-no-clothes Suez moment as anything else. I guess that would be a black swan too…
Everyone else watching the ED on NQ hourly, yes?
AAPL going up vertically.
Manipulated or not, VIX just painted itself a whole load more headroom…
http://scharts.co/1B91xsy
yeah – that’s what I see as well. Time to wake oh sleeping children.!
the low dream state of the vix will not last much longer…
John, I wonder how you manage to handle all these heat going short?
I am pretty exhausted, hoping for worldwide disaster is my only hope, maybe a massive asteroid hitting earth and cause extinction events, or some hostile alien invasion might put down this market.
I think BTFD seems like the rule of this decade as long as all central banks continue to have rotational QE and pass their bucket from one to another.
Good Luck!
Under pressure. But all year the case has been too compelling that it is a topping process, so I am seeing it out until we get my >18% drop.
The Ponzi can’t be hidden one more time. There is no global growth this time. Fuels are drying up, and people with the most information have stopped breeding, anticipating a historical sea-change. Betting on collapse has risk for sure, but conditions are prime for it.
WT
And what is the USD telling you?? hmmmmm…..
The Volume Oscillator that Terry Laundry developed and I use has been saying that this cycle would have a bearish outcome; what he use to call a bear “T”
the divergences have confirmed that view, especially the NAUD. so this should get moving fairly quickly to the downside
http://stockcharts.com/h-sc/ui?s=VXZ:VXX&p=60&st=2014-10-22&en=2014-11-12&id=p84894202326&a=372598734&r=1415808421276&cmd=print
Financials starting to lead lower – need that sector to break down
the chart that never lies wants to rollover…
http://stockcharts.com/h-sc/ui?s=$NAHL:$NATOT&p=D&st=2014-05-16&en=today&id=t24020893407&a=369189956&r=1415808922229&cmd=print
Well it won’t take the destruction of
mankind to see significantly lower prices,
merely the next recession.
Cycle already turning down in much of the
Euro area and Russia, Brazil amongst others.
The Far East will follow and ultimately the US.
“destruction of mankind”…who are you referencing? another of your narrative strawmen in play today!
I dont get it. Pronouncements from on high!
xrt rally will pull this up…santa is real they say
wow how volatile are gold miners today……………………
It survived though. Closed green. Resilience?
Truly admire those who still have the guts to short. I have given up on the crash scenario this year. Today started out with some hope for the bears, then as always, every single dip has been being bought back.
All I hope for is some sort of corrections. The Fed manipulation is beyond heinous. The collapse will be epic, but the truth is how many of us would have enough capital / cash reserves / patience to to join the party????
erick, short stops or hedges are the only strategy for survival and sanity in this game. That means you have to be watching pretty much ALL of the time.
Thanks purvez. I am in cash and happy that I am on the sidelines. I shorted and hedged heavily, but still got burnt by the current insane corrective moves.
Best of luck to those who are hoping for a crash. I’ll rejoin the party next year. Sad to say, like past time, no bears will be standing and no bears will be in when this market nose dives, all driven to the sidelines.
A lot of extreme comments here based on some small moves……don’t overleverage guys….
elvis,
The post was a reference to cd’s earlier
conversation with John.
Nothing to do with you.
Neither was last night’s
comment, which you also appeared
to automatically assume was about you.
I don’t take notice of people who display
emotion when discussing trading,
as it rarely works out well for them,
as their calls tend to be a mile off.
But I wish you well.
Last nigh you posted AS A REPLY to my comment so FORGIVE ME…lol
this morning I’m just generally commenting on HOW you comment – pronouncements with no data, research, charts, reference sources…etc, etc, etc
you are a gem Phil. polished ego and passive aggressive skills galore! kindly end your self serving prevarications and read you pointed posts at the one whose been banned! lol
I feel comfortable posting whatever in this regard as you will take NO NOTICE anyway!
roflmao
A lot of people seem to think this is a US stocks bubble, or mania, assuming that this just cannot go on…
Look at the NDX chart in John’s post above, with a true mania on the left and the current bull on the right. See many similarities? I don’t.
NDX rose more in a single manic year (1999) than it has during the last SIX years.
Currently looking overvalued by many measures? – yes.
In a bubble? – not yet.
I think what the Bears know that will surely come is the day when the market moves in such a way that anyone long anything will not have the time to pull their position and anyone trying to short will not be fast enough to pull the trigger. I would rather not be fast enough to pull the trigger than to ride the loss down.
That’s what keeps a trader locked into a losing trade MP – the fear of bailing out for a significant loss, and then watching with horror from the sidelines as the market does what they had been hoping for.
Continually overiding stop-loss levels, on the grounds that they “know” the market will soon go their way, is a common and fundamental error. Anyone who keeps doing that will eventually back themselves into a huge gamble, where they need something to come along and prove them right. If that something does not come along on time, then they are forced out when the pain becomes too much to bear.
Everyone has done it at some stage.
Mark you can’t keep comparing now to the extremes of 2000 and make the assumption that we are not yet in a bubble because we are not at 2000 valuations.
Ths is by long term measures the seond most overvalued market in history. It is a bubble mate right here right now, you had better believe it
Does that mean it bursts now? Not necessarily so, but it IS a bubble based on long term comparisons to all previous bubbles.
Deny it all you like mate, but the facts speak for themselves.
Mark, significant overvaluation is, in my books, a bubble. Manic parabolic rises are just an occasional bonus.
The bubble is in credit. Harder to see. All Stock market advances are a function of credit expansions.
For me the 2014 crash window closed
2 weeks ago.
What you may get at best now is 2-4% downside
imv.
Going in to year end I think bears will be
torn apart, only something seismic can
alter that now.
SPX earnings remain too strong and
the cycle will not turn until Q3/4 2015
at the earliest.
Agreed and disagreed with you Phil. I think we are not yet in the bubble phase. Theoretical, after this pullback, I believe there will be a blow-off phase taking us to a bubble ATH levels, before this bull technically dies.
As far as the crash window for 2014, I still think this week and next week presents a strong possibility for a large reversal, and crash window technically is not closed until the end of November.
agreed. I think the market tanking between now and end of year is unlikely. However, we might get a pullback, probably just a few percent, in the next couple or three weeks. Might be smart to go long if we get that pullback.
I don’t want to short SP but DAX.Draghi needs EUR up a bit for a while before he committed totally his QE next year
http://stockcharts.com/h-sc/ui?s=XRT&p=D&yr=0&mn=5&dy=0&id=t05887390531&a=370502282&r=1415808323009&cmd=print
this and the vix are the bull mojo right now
On another note, and I am sorry in advance if I offend anyone on this board, as an US citizen, I am very concerned of what this government and the Fed organization are doing to this country and the entire world. I think the crime that the government fraudsters and the Wall Street thieves are committing to the current and future generations is beyond heinous. That is a the very reason that I have become a bear, a refused to be a bull, until this market crumples and falls. I refuse to partake in one of the most disturbing crimes of the 21st century, as the stock market is all the fraudsters have left to keep us, US citizens in delusion that the economy is truly thriving.
I wouldn’t beat yourself up. Thinking folks everywhere recognise that the kleptocracy is truly global these days. I guess it’s up to the rest of us to throw the bums out at some point!
Don’t be sorry. Your Uncle Sam just applying some social and economical experiments from Iron Curtain. QE, health care, disarm and eavesdropping without asking your consents. The world will collapse inevitably. However your USA will be down last. Right now, US companies prepare to remove factories , equipment and capitals to Mexico. Under the guidance of Jews elites (I love Jew not hate , please understand that), USA has used Japan in 80s as USA’s giant factory to produce goods. Then Japan wen to deflation for 2 decades. Next USA used NICs in 90s as multiple factories to produce cheap goods for US consumers. Later on Asia Crisis destroyed all NICs. Currently China to be used as US factories again. After that China will burst . Finally Latin America to be used as producers for US market. Rinse and Repeat. This strategy worked at Japan, NiCs and China then will work at Latin America. You fine. The rest of the world need to be worry. Me as an Asian , plan to learn Spanish and move to Latin America if possible
Great points LHL and ultra909. Thanks,
I agree with you erick. The good book says every jot and tittle shall be balanced. And Karma always returns.
ISEE equity put call ratio is running at 400 at the moment. It’s an extreme reading. The last time it closed above 400 was 26 March 2012. If you check your SP500 chart you’ll see that was a top.
Last time NYMO wasa over 80 twice in a week we had 4 week/ 4percent selloff, not this time. So lot of things are not working the way it should.
Silver coins are sold out. General public is piling into silver. Are they correct? Or is silver going much lower?
http://finance.yahoo.com/news/retail-investors-dive-into-silver-161233995.html
The urban myth is that the public is wrong. The reality is to follow COT of big specs vs producers. The big speculators have been massively short and correct for 2years. What to look for is when they run out of firepower to push prices even lower. Small traders are pretty much irrelevant. See Briese’s COT Bible.
agreed.
erik,
imv the bond market strongly indicates
how this cycle ends.
Regardless of earnings the r
business cycle ultimately reasserts itself.
Admire people who have the guts to short
this as I certainly do not.
Exact timing is exceptionally difficult,
as always.
Note to myself….
“Are you doing what your Trading System says??
If yes, you are doing the correct thing.
Thinking too much costs you money.
You don’t get paid to think. You get paid to react.”
I forgot to read that every day, a few weeks ago….
And I’ve regretted that every day since….
So….. Time to be back in alignment with my trading system….
If anyone cares, I started shorting wayyyyy too early several weeks ago…
Eventually covered for a pretty good loss, but hopefully the lesson learned is to ~not~ try to out-smart my own system…
FWIW, my trading system – a combination of trend-following indicators, oscillating indicators, and fast and slow junk bond TF systems – indicated a “cover shorts – go 50% long” signal on 10/20…
It also indicated to add another 50% long to that on 10/24….
So, didn’t trade ~that one~ too well, did I? *big sigh*
Regardless, that brings us to now….
The system went to a “50% sell” on 11/06…
S&P closed at 2031 that day, btw…
Buy and sell signals are always cover and reverse signals….
So that’s where I am today… It’s not a particularly “strong” 50% sell signal, but that’s where I am…
Looking to add another 50% short at any of the 3 following events:
A second new “sell” signal withing the system – which is close to happening if we don’t move from here soon….
A move to SPX 2082,
Or a move to SPX 1980….
Anyway, not trading advice for anyone, but that’s what I’m doing….
Quite frankly, I have no idea about the Sun, or the moon, or gravity, or time cycles, or anything like that… John does a fantastic job with charts and reasoning, and I’m certainly more comfortable being short rather than long – at these levels – but I think we’ve ALL learned that things that make the most sense in this market are often not what makes you the most immediate money…
And I’m not picking a top, and don’t have any idea if we’re about to head down, or surge even higher… Or if this is a large top, or a small top, or even if my system is about to reverse itself….
But just trying to do a better job of following my own mechanical signals…
And right now, it’s 50% short….
GL to all…
Barry, this resonates with me a lot. Any system (all systems?) are probabilistic at best and therefore prone to error. The REAL issue, with me at least, is having the strength of conviction to follow it ‘blindly’.
I’m sloooowwwly learning to trust the (my) system but then I get ‘over enthusiastic’ or ‘second guess’ its next move.
I wish you well with following your system and thanks very much for posting. I think it would help others here to know and understand how people trade.
thanks, Barry. Great post!
Also, wanted to ask anyone that might have an idea, I’ve noticed that junk bonds have literally flat-lined in this area for the last 3 weeks…. Barely any movement up or down at all….
It happens from time to time, but still, not that often….
Stocks have just been chugging higher, and HY bonds just ~sit~…..
Certainly a divergence to be aware of, but just curious if anyone has any thoughts to how steady they’ve been…
Thanks…
John,
What will trigger the November down month which are predicting, I don’t see any reason which can derail this rally. Wanted to get your thoughts on that.
There is nothing at all that makes me think the market will crash. That is enough reason to expect a crash is possible so I remain optimistically bearish but remain in cash. I may enter once all the bears have capitulated or if these waterfall declines start.
Lower highs and lower lows in $/y is constructive so far. 116.09 as important top?
Here my view for next 3 months:
– USD so strong but overbought across Forex market
– SP would correct a bit then rally strong for EOY. May long around Thanksgiving
– EUR will move up a bit before going down. Long this week and take profit mid Jan next year. Then short big with 2 hands. Target down at 1.21 then 1.1
– Short DAX this week before Draghi wants to do real QE for EU
– Gold and Crude could rebound but I m not interested in gold. Gold too small volatile to trade. Crude could be up seasonally so waiting for short later
Bullshit. $14/hr. http://www.indeed.com/q-High-Rise-Window-Cleaning-jobs.html
I find it “entertaining” to certain extent that the majority of posters/ retail are so clearly “defending” the idea that “these markets just can’t fall”.
Think about it for a second……
Isn’t that exactly what makes you “retail”?
When you’ve got this much “bullish crap/defense” posted while every spec of data suggests otherwise….don’t you all think it’s about time you make the jump?
You need more than a 2k account to get over these tops…and you need a much wider vision than the endless debate of “The Vix” or IBB on any given day to consider extracting any “real money” out of this.
It’s a top.
There really is no debate, it’s more a matter of “how you survive” – that seperates the boys from the men.
John ( and I ) will be rewarded – and personally…..I don’t care if it takes til mid 2015.
The “easy times” for bulls has ended.
I don’t understand why people label others as “bulls” and “bears” as if it is a permanent situation…?
I have been both a bull and a bear every week or at least month for the last 20 years…..
Surely no one is only one or the other for very long periods of time….?
Or is it a bit like when someone decides that they are a Republican and are so for life regardless of what the party does..?
Great comments jegersmart! There is no such thing as permanent bull or bear. Our ultimate goal is to make money our of these markets 🙂
To quote Bruce: Be water my friend. In other words, there is more money to be made by moving with the market from day to day than by figuring out where it may be a month or two in the future.
From what I understand of both “the human condition” as well the vast majority of “wanna be investors” – It’s bullish all the way…with even the “smallest suggestion of things going lower” met with frowny faces, disbelief etc….
Most “humans” aren’t too interested in pulling their heads out of the sand and considering that “everything’s not coming up roses” no?
The majority of humans “want to believe” – as they generally have no other option.
Ask the average investor over the age of 65 if they’ve ever “truly” gotten short…..I imagine you’ll get the same answer every time ( that being “no” ).
It’s scary….its intimidating, and even “anti-american” if you are indeed American.
Heads in the sand….until accounts are reduced to zero – as history continues to make fools of those unable to flip the switch.
left brain confabulation

An increasingly mechanistic, fragmented, decontextualised world, marked by unwarranted optimism mixed with paranoia and a feeling of emptiness, has come about, reflecting, I believe, the unopposed action of a dysfunctional left hemisphere…
– Iain McGilchrist
I call it Evolutionary Brain Damage and it is epigenetically reinforced and worsened by extant culture, tradition, precedent, institutions…
there is but one hope
NO
A terrible comments by Forex Kong. I agree that the market topping action is in progress, and I am here on this board as I admire John’s brilliant work. However, as a trader, I believe timing is everything. You might not care if the market would crash nowith or 6 months from now, but I do. We retail traders don’t have unlimited cash reserves Forex Kong.
While a I agree that the market is followin the 2000 crash pattern closely and it looks toppy, I think it is arrogant to say that the market is already topped as a fact. Nobody knows for sure until the powerful reversal has taken.
I appreciate your position Erick…and don’t recall saying “the market has topped” rather – “it’s a top”.
Tops can take months, and then several months more to complete, so it’s very difficult to “survive”.
It’s even “more difficult” when you put the added pressure of “needing it to happen” on the list of variables.
People make silly mistakes when acting from a place of “need” – don’t you agree?
This is the comment I would agree with completely. Thanks Forex Kong.
Spoken like a veteran FK…so true.
The market will roll. Staying solvent while the process plays out is key.
GL all.
repost from last night: tomorrow’s GEM Spiral is too compressed to show clearly – I’m linking a chart of 11/13 midnight to 11/14 4 pm. The path starts on the right (11/13) and curls upward to @ midday, then down overnight 11/14. Then begins up again @ 3am to a high midday and then down in the afternoon on Friday to the close. https://twitter.com/mjmateer
Looks like now IWM is also joining the party..performance chasing into year end ??
http://stockcharts.com/h-sc/ui?s=$NYUD&p=D&st=2014-06-12&en=today&id=t16038916273&a=367854604&r=1415824959781&cmd=print
certainly getting interestingly more strange
“It’s just going get weirder and weirder and weirder, and finally it’s going to
get so weird that people are going to have to talk about how weird it is…”
—Terence McKenna
Elvis – your charts are amazing!!!
This chart speaks to me.
John,
Imo, Nasdaq is the ‘tell’ – in terms of technical analysis, it is very close to making a double top. Having risen this far, it is very unlikely that it begins to crash here without making the double top (which is only 8% higher) !
The only question is: does it stop at the all time closing high of 5,048/intraday high of 5,132 or does it exceed it – if so, then by how much ?
Your thoughts ?
No fuel to go that high (sentiment, allocations, put/call, leverage maxed) plus the mature divergences on the Nasdaq put us right at the end of the topping process
John, “right or wrong” your analysis is far superior and more clear then most paid services I have encountered. It is something special when a person just shares his knowledge for its own sake. Thanks. I think long term you will do very well with your trades, probably short term as well.
Thank you
BR I agree with your opinion about the Nasdaq; something I posted a couple of months ago I think. Maybe they won’t be happy unless it prints at a historic high.
Given the debate amongst the group; I though the following article an interesting read; especially the bit about the retail investor going from rags to riches. Corruption was apparently bad back then as well.
http://www.thebubblebubble.com/south-sea-bubble/
19 days Sp500 closed above 5SMA.Anything beyond 18 considered outlier. I need a flying Buddha
and rallies last hour of the days. Too bullish to be true
http://stockcharts.com/h-sc/ui?s=XRT&p=D&yr=0&mn=5&dy=0&id=t35450374489&a=370502282&r=1415824618047&cmd=print
this is a problem for my cycles here
could presage a severe short pinch
New NYSE 52 wk highs topped on Oct 31. New 52 wk lows may have bottomed on Monday. Hopefully down from here.
Another gap down nullified and unconfirmed doji in spx, and Looks to me a clean break up in ndx/qqq. Not going to step in front until weakness. Agree with John li on that. Bot some qqq intraday and keep scalping
No entry on gold or silver today – it’s a rollover. However it still looks good and with the small range inside day today, the setup just got sweeter: tighter stop -> larger position for the same $$$.
Both Stoxx and DAX have entered their RTVS from yesterday.
One for Alan: the Hang Seng has painted an RTVS today.
The duckies are lining up.
Ultra, indeed they are mate. And it is happenng as most are completely oblivious to it, but that is just the way it should be.
ASX beginning to follow
http://stockcharts.com/h-sc/ui?s=$AORD&p=D&b=5&g=0&id=p13160267382
Back tested the underside of the wedge break and has I suspect…..FAILED
http://stockcharts.com/h-sc/ui?s=$AORD&p=W&b=5&g=0&id=p58198088002
A boring week. Nothing move much except DAX and GBP
Don’t think it’s boring at all….
As far as I’m concerned, we’re looking at a huge divergence between HY bonds and the US stock market…. Things are setting up quite nicely, if you ask me…
Sunspot is believed to have grown. http://phys.org/news/2014-11-giant-sunspot-bigger-badder.html
$/y is up around mid-day Asian trading, what is interesting is that gold is up also. a short term disconnect or rules of the game changing? let’s see how things develop the next few hours.
Thursday morning update.
Still think we are just hours or days away from the final roll over. European indices and Australia have now arched over, chart below. US still holding up, but the last few days have just been range trading at the top of the megaphone. I maintain the next move is down because the latest II reading is still at the historic limit of 15%, the latest Rydex reading ditto maxed (>11), and ISEE put/call yesterday was over 400 during the session, a major extreme, and closed at 235, still an outlier reading. All three spell maxed-out and highly lopsided markets. Gold and miners still basing for a move higher. I think the key today is Europe: whether their indices catch a bid and delay collapse.
nice head & shoulders pattern you have there in that chart (the last few trading days). let see if the cb’s let ‘nature’ take its course or do they intervene.
Yes John the ASX was the weak link in Asia today and is just a touch away from breaking below its 50 day for the second time in two months. The dfference this time around is the recent “golden cross” which adds confirmation to the bearish side.
The bearish signs are building in European indices and some of Asia, aside from Japans injection in the Nikkei it would be rolling over as well which I suspect will happen eventually anyway, but given what has happened to the DAX in recent weeks on bearish action I would not be surprised to see another effort to turn it around if it weakens again today.
What is evident though is that the DAX quite clearly wants to head lower, so despite any effort to keep it afloat, I believe the down trend will win out eventually.
John,
Check out DB. Largest German back and largest derivative book on the world. Stock has taken out the October 15 lows. Also it is probing a multi year low. Something is not right there. Do they have the old maid? They are likely massively short the dollar structurally.
Bluestar – glad i’m not the only one watching DB
i like your reference to the Old Maid
my wee lil short portfolio DB,JCP,SHLD,CCL,RCL,DAL
B;uestar,
Shorting the USD? Got to be nuts to do that.
Spent less time waiting for market to crash. Crashes happen every 10 – 15 years. It has been more frequent due to secular bear cycle. Spend more time with your family and love ones. Thats probably the best investment you can make. Whats all the fuzz about hoping the world falls apart so you can make some money. I can imagine many of your relationship had suffer, i know this! Its very easy to deciper your personal state from the comments. Mine has sufffer too, but i intend to make it better.
Especially that the price action is so boring, I had only 5 intraday entries in November. If a trader loses energy in a market that doesn’t move, he will have no energy left to profit, when it moves for real. Trading is about State of Mind. Those who are anxious, tired, depressed, angry, weak, agressive, greedy, or their brains are like a spinning CD with zilions of ‘this must happen’ and ‘I know I am right, if I am wrong, my timing is wrong’ and ‘something is brewing I know, dinner time’, won’t make money in the market. It’s all about fun, trading forum 🙂
That’s true. Trading is all about state of mind and I would like to add + your trading experience / knowledge (w/o knowledge no profit)
Probably yes, but sometimes children having fun can perform better than experienced actors. Best pro singer won’t perform on stage, if his state of mind is wrong. In a proper state of mind, with a glass of wine or not, someone who has been wrong about markets for years, suddenly sees all his ‘experience and knowledge’ fall like a curtain, to see the market as it is, for the first time ever. In a brilliant moment of illumination a trader can suddenly see a method or set up. Experience and knowledge is what we have known, but trading is always about the present : present market, present memory, present way of seeing the market. Just musings before going to sleep, good night everybody 🙂
I think yesterday erick mentioned the abysmal direction in which the US was heading. Now today I saw this:
http://thehayride.com/2014/11/video-obamacare-architect-admits-law-was-written-to-confuse-stupid-american-public/
The fact that this was done is atrocious but what is really galling is that this guy feels comfortable in admitting it publicly.
“This sh*t has to go”……..Jacque Fresco.
imho
J
FTSE sporting a perfect rising wedge and price now squeezed right into the apex and between the 50 and 200.
It is also reaching an important point right on cue with many others.
IF they manage to break all these indices higher in the next few days I will concede that the likelhood is that everything runs up into 2015 and blow off top at some point.
http://stockcharts.com/h-sc/ui?s=$FTSE&p=D&b=5&g=0&id=p77228235645
Boring continues. But let wait for Friday which would explode. IMHO, SP will thrust to upside strong, a final push before a small correction into Thanksgiving.NZD already move up for 3 days. The focus now is EUR which consolidated in a range for a week now. See you tomorrow, a Big Friday
Mate I think you are wrong. I think we head down amd given the patterns across rhe globe we will begin testing the October lows pretty quickly, BUT if they manage to pull off something and miraculously take everything higher then I am willing to concede that the time is just not right.
I have moved my ftse long stop up again to 6540 to bank a bit more.
I also moved up my latest auto short from 1995 to 2011. I’m sitting waiting underneath.
If it hits it the next one down will be at 1975
Looking at these markets is like looking at someone whos building gallows unknowning once finished it’s to be used on them.
It will eventually turn to tears, just a case of when.
Aaron that is such an amazing analogy!! Thanks for that insight. 🙂
Es futures backtesting broken trendline on the hourly near 2042 which is one signal i was looking for to reenter shorts. will decide at open. Ndx futures spiked above 4200, and still in breakout mode. Not stepping in front of that. Spx been relatively weak to ndx, dow, Russ2000 with megaphone still capping upside. If I’m to pick one to short it will be spx. But aside from intraday pullbacks, again hard to have real conviction in these grind up conditions. We need a catalyst, maybe something over the weekend
French CAC is beginning to follow through on yesterdays break lower. I think we see the down side excelerate from here in European markets.
Asia will follow. The US not far behind
http://stockcharts.com/h-sc/ui?s=$CAC&p=D&b=5&g=0&id=p71786304762
USD JPY is refusing to fall………… need it to come down
unless the equity markets make a big move, i think the $/y will trend sideways until gdp (japan) numbers come out monday morn.
I can see every micro move down is support by some big ass buying….. zzzzzzzzzzzzzzzzzzzz regardless of what the BOJ does, the Japanese economy is in hot water, i don’t even know why they bother.
Dollar ready to make a final move higher before a correction of sorts. You heard it here first… So what does this say to the equity markets?
Allan.
It will be yet another positive day for the US market
From ZH: http://www.zerohedge.com/news/2014-11-12/392-weeks
ES perfect kiss of trendline rejected. Unfortunate couldn’t enter shorts cuz I don’t trade futures. Looking to to shorts on every test on tradeline (~2043-2045)
VIX trendline support being tested again, must hold for the bears
Here’s my view more longer-term in SPY, in the weekly, we are resembling a V-shape recovery->exhaustion pattern that has taken place twice past 2 years:
– Multi-week drop followed by a hammer candle
– Bullish reversal confirmed and V shape recover to new highs
– RSI Divergence
– Test of upper bollinger band
In the last 2 occurances (mid 2013, Feb 2014), after 2 weeks of consolidation, we would run out of gas and retest the 20WMA (purple line). So on a medium-term timeframe, scale in shorts with best entry at the upper Bollinger Band (around 205), targetting 20WMA which stands at 197
but again only expecting “a” top, not seeing evidence of “the” top yet.
http://davinny.wordpress.com/2014/11/13/spy-weekly-a-repeating-v-shape-pattern/
those who enjoys the thrill of trying to catch tops in QQQ can take a stab around 103.5
closing out my QQQ long, small caps showing weakness on no news
small cap symmetrical target hit
http://screencast.com/t/2g6YaZgCws
Nice little squeeze there. Get in top tick – and don’t let go. This is the climax run we’ve been waiting for.
When is the top tick? Can’t tell if it has passed or not.
another day just watching markets tear higher. Still sitting cash and what a great short entry i’m gonna get at this rate assuming i get in at the right point!!
FWIW…. (and just a heads-up)
Unless the HY ETFs grab a bid here today, it looks like my trading system is going to signal (tonight) the next layer of shorts for tomorrow, bringing the position to 100% short….
I have no idea if this is ~the~ top, or even ~a~ top, but I’ll be adding to shorts tomorrow.
Again, this is just a heads-up, and is not yet a confirmed signal….
Just something that looks like its about to form….
I will update either way tomorrow morning….
GL
Right on. Thanks Barry. EW count has exactly the same prediction. Trust your system. It is working great.
Thanks, Erick…
And short of a BTFD recovery in the market this afternoon, there ~will~ be a confirmed sell signal tonight…
Not that that ~couldn’t~ happen *big sigh*, but hard to think we aren’t going to be on a 100% sell signal here…
Gas is on sale so global economy is expected to boom. Jobless millennials are rushing to rent V8 SUVs so they can drive around in circles. Happy days are here again.
Set a small dow short order at 18000 with 150 point stop. May not hit it but unless things turn round fast it might just churn up to it. After all it just takes about 10 words from a central bank and the dow will fly 300 points. If it breaks above 18150 then time to reassess.
USDJPY seems to be forming an inverted head and shoulders wanting to break up targeting 116.70.
I’d love that for my vacation trip to Japan
Today was THE high in the Dow …..according to
http://www.gordontlong.com/Tipping_Points.htm
“Wave (V) will complete an orderly progression of fibonacci multiples at 17,655 +/-50
Very good article on Supercycle Peaks are Occurring at Fibonacci Numbers
but what’s next? After wave V, then tumble (I’m not a fibo expert)
I think the author is thinking Dow between 577 and 995.
That’s too bearish for me
my interpretation is Dow between 6500 and 11800
In my cycle analysis I have noted that early next week (Nov17-19) has the potential to be negative. The moon is at apogee over the weekend on Nov 15. For a bigger correction to occur in this scenario the market on Mon Nov 17 needs to close lower than the Friday close. Otherwise it is just a regular sideways chop before another further up leg.
Thus, from a certainty principal and also risk to reward basis, you are almost better off waiting until early Monday before initiating a short position. Even though today could potentially mark a top at ATH because past situations where there was a deep correction had the top one or two TD before apogee. FYI.
great advice Steve. Big thanks. Agreed that tomorrow or Monday would be great to start shorting again.
http://stockcharts.com/c-sc/sc?s=$SPX&p=30&b=5&g=0&i=p82454317307&a=194192853&r=1389630561163
this link is active and will refresh with the browser
BBE can u pls put up good link i have stockcharts ty
Today is 55CD from 9/19 top (a turn day), reach 2046 SPX, if we got a reversal bar for today close, that’s possible a major top for 2014.
http://screencast.com/t/S9CM9U21mbos
Maybe write a blog post with capitulation and a white flag featured–banksta squeeze til then :).
end of the road for Wile E Coyote…
http://stockcharts.com/h-sc/ui?s=VXZ:VXX&p=60&st=2014-10-22&en=2014-11-12&id=p84894202326&a=372598734&r=1415895868659&cmd=print
http://stockcharts.com/h-sc/ui?s=VXZ:VXX&p=60&st=2014-10-22&en=2014-11-12&id=p84894202326&a=372598734&r=1415895868659&cmd=print
End of the road for Wile E Coyote…
https://encrypted-tbn1.gstatic.com/images?q=tbn:ANd9GcRkp3e3DshCyPGI7wOAAcApXZlOc91bHD-5Z94bYoJE347FdyHG
QE for Kids
https://encrypted-tbn3.gstatic.com/images?q=tbn:ANd9GcSZIKsoIcJQ9VyW7X-xSc8Nc2bslD1QZzUU3TIfRWHnZNA6it15
bbe, love the qe for kids one! Thanks
FREE! its all FREE!
I think the intermediate top is forming today, so the powerful reversal is within sighs. Geocosmics wise, this week and next week shall present extreme volatility, a spike up met with a devastating reversal. It looks like the spike up already took place this AM. imv.
SPY, DIA, QQQ all shooting stars in the making absent the 330 VWAP rally as john li calls it
yes and agreed and this is my thoughts – bear don’t get too happy too fast as normally they would make a double top (retest today high before “real move” on)
The first dip normally is buy for bull. I think today looks similar to 9/4 top and 9/19 was the final.
If today equal to 9/4 (11/13) then we will get the final high on 11/28 (+/- 1 cd) very likely coz’ seasonality trading days before thanksgiving is very bullish.
a high likely scenario is a drop to 9/19 top and bull would come in, retesting the high (break up slightly / double top) pn 11/27-12/1
apple. Your prediction makes sense from the EW perspective. A devastating reversal next week met by the BTFD, taking the markets up for one last time before crumpling and falling for real.
Have a look at Nikkei futures… also NAS100 and CADJPY…. hold your shorts.
H&S forming on 15min, 30min charts on NDX 100 futures. it’s brewing
Definitely brewing, love those candles on the 15 min.
I can see “Exhaustion”. happening right in front of my eyes. Can you?
Only fitting as demonstrated by a mega blue chip called WMT.
$NYAD Cum. rolling over. 1st short position bought.
The next narrative. Russia bombers are going to buy some gulf shrimps while they are on patrol
$NYADV (5 EMA) starts to roll over . Price needs to roll over from here to cause the HFT algos to go short like me.
IEF:SPY; (5 EMA) just gave a sell (SPX) signal.
I am an unrepentant Elliott Waver (not to be confused with Elliott Wave International) and the biggest tool in my techy box is counting waves. Also I trade the DJIA so everything that follows is in respect of that. Also my data feed combines the overnight and cash feeds. So that’s your context.
Despite the near vertical climb from Oct 15 there are waves that can be counted. I reckon wave 3 ended on Oct’31 and w4 bottomed on Nov 4th. The near sideways move since then is the 5th wave and despite being hard to count it appears to be an ending diagonal. We’ve had sub waves 1-3 of this 5th wave and also wave a of the 5th of the 5th completed today at the new ATH. We are currently in w-b of this 5th and based on trend lines I can see a top somewhere in the 17750 or just over region to complete this move.
The ‘crunch’ point for this projection is of course yesterday’s low at 17525ish.
Thought I’d try and make a contribution based on EW.
GL to all.
thanks, purvez. so we’re not there yet, but if your count is correct, we’re close. Wave c of 5 of 5 started today’s low at 1:30 eastern time? If so, then it will likely complete tomorrow.
You’re a better wave counter than I am! Hard for me to make out any kind of wave structure since November 4. But I hope you’re right! Good luck!
Seems like a bearish sentiment day based on the posts here.. Intra-day is bearish and needs to get into Oversold territory, but on a daily scale prices need to get out of overbought territory otherwise it is still bullish.
usd/y rising wedge break level nearby at 115.50
http://stockcharts.com/h-sc/ui?s=$NYUD&p=D&st=2014-06-12&en=today&id=t19695662111&a=367854604&r=1415903204921&cmd=print
VO head to 0 lol
and then there is this
Would appreciate it if you wouldn’t post pictures and videos, just charts. Your the best Elvis!
learn to live with disappointment!
tried to post this 5 hours ago and was unable to: velocity 11/13 from 4:00 to 7:00 spot on – next turn 10:00, then velocity to 13:00. Note that polarity changed as of 18:00 last night with an expected downtrend to @ 11/24. https://twitter.com/mjmateer
Peggy please can you tell us what time zone you are referring to please. Thx.
I’m in est. These are hourly GEM forecasts – the turn will come during the hour. The 2 minute or 10 minute data (from 7442 Analytics) is available but I don’t have it.
Thx Peggy.
midcaps – the 13ema, support and price are all converging
http://stockcharts.com/h-sc/ui?s=$MID&p=D&st=2013-07-21&en=today&id=t48268507956&a=374805050&r=1415906125884&cmd=print
http://stockcharts.com/h-sc/ui?s=$SPX:$VXO&p=D&st=2014-05-19&en=today&id=t07884406427&a=367751425&r=1415906741184&cmd=print
cycle is closing out so what’s next?
Yes i agree we are close, Santa (satan?) rally and break out above 2100. imo.
hohoho you funny
Selfie?
HA!
from last night!
after this
http://stockcharts.com/h-sc/ui?s=$NYDEC:$NYADV&p=D&yr=0&mn=7&dy=0&id=p90609425033&a=368771002&r=1415907564096&cmd=print
imho, the line in the sand is drawn at 115.80 to 116.00 $/Yen. in the last few days there have a number of attempts to break that line without success but the level of retracement have become more and more shallow. the next few days, we have the gdp numbers, news on tax hike or not, election or not…will decide if we break that line or not. I also believe the $/Yen will have a major say as to where the $, equities, gold, oil…will end up.
it can never come down!

Lol another doji in spy, no sell signal, stay flat and sleep well
This post doesn’t seem to be even obliquely connected to the subject of stock investing based upon Solar Cycles or Lunar phases.
imv today SM reflects an inverse image of Oct 15th. It seems the reversal is quite powerful and is here to stay. I believe that John’s scenario is playing out. However, I still don’t see a crash, not yet. Just a correction before the BTFD action again.
On a personal note, my biggest mistake in my 20 years of trading experience was on Oct 15th when the sell-off took place then reversed. A reversal signs were all over the place, but I made a dumb mistake of not switching positions from short to long, believing that the market would have crashed. Boy, how wrong and how dumb I was!!!!!
erick, please don’t beat yourself up. Instead learn from the mistake and move on. I know how difficult that is…..but that is the RIGHT thing to do. Just speaking from experience here. (I was going to say bitter experience but everything can have a sliver lining!!)
you are right purvez. Live n learn.
The collapse will be epic. Hopefully we on this board will get to celebrate together.
It would depend if those signals are in a specific time frame and if your strategy is also based on that specific time frame… On a yearly or qrtly or even monthly. This rise is nothing but a blip. But on a daily or intra-day. This would have been devastating. SPX has been in OB since Oct 23rd… Quite long in the tooth without any significant pull back. But we are living in irrational times…
Amen…
The reversal signs on the 15th, PLUS a 1%+ move up in junk bonds on the 17th…..
I saw it, and ignored it……..expecting a crash instead…
~NOT~ going to do that again….
That said, as to a BTFD opportunity coming up, it looks like an awful lot of people expect that…
Maybe it happens, maybe it doesn’t, but if everybody is looking for one thing, we can rest easy knowing it won’t happen….
Not sure what ~will~ happen, but I’m having a hard time believing it’s going to be a small sell-off, a run back up to slightly new highs, and THEN the real sell-off happens…
Regardless, still need to run through my data and charts, but 99% sure I’ll be 100% short by COB tomorrow….
Appreciate all the comments, Erick… Keep them coming…
The RUT gave the tell in mid October,
it was mentioned on here by some but
dismissed by many.
Always easy after the event.
erick, don’t beat yourself up about that,
it did look like a crash, it had me convinced
for at least a day or two and I was uber sceptic
of the 2014 crash scenario.
I recall that call of yours Phil. Great job! I did finally got out of my shorts and saved my az a few days after 10/15. And I have been in cash since. Don’t see a need to short yet. I might jump back in short maybe tomorrow or Monday.
x flares are a coming.

yes another bold graphic!
I would agree with Barry. 100% short signal is pretty much what I see as well. I think the next move must be super impulse, either a moon shoot or an epic drop. My bet is on the epic drop for now.
I truly hope that I am wrong in saying the crash will NOT happen in 2014. John’s work is genius, and I have repeatedly said on this board that I can’t find a single point to argue against John’s brilliant analysis. The only thing I disagree with John is the timing of the crash, probably due to the extremely stretched cycle. The new 50 week cycle has begun on 10/15, so imv there is a very slim chance of the crash, being just 4 weeks after the cycle start. This cycle should have run at least 8 weeks before a potentially devastating correction. On the other hand, geocosmically speaking, what I see is a very narrowed window of the crash, from now till 11/22, or Thanksgiving as the most stretched window.
for the market to crash, there needs to be a loss of faith in the system (i.e. the central bank printing), and we ain’t getting that yet. sheeps are still buying it and hoping for more from ECB, BOJ. just can’t see the catalyst yet. yes at some point the system will collapse, but the million $ question is when
there doesnt have to be a trigger “event” just a deepening of sellers with no buyers.
margin will take care of the rest as will consumer debt
agreed, but you will have more margin/leverage created out of thin air thanks to ZIRP and QE for people to double down. there needs to be a tipping point those don’t matter anymore.
its here in all the divergences that show no liquidity
QE is done and BoJ is done and Mario just lied his pants off and has no plan
so…it’s here and now
I agree that one of the components of the crash scenario is there is no need for a catalyst. However, we would need a major shift in human sentiment, and that what the cycle count is all about imv. It is all about how much fear embedded in those who are blindly buying at the market peak right now (except the criminal corporate buying backs). When the first wave of sell-off begins, the second wave will be due to margin calls as bbe mentioned.
Of course a black swan event would definitely help. To me, that is when geocosmic plays a role in the crash, like the 9/11 event.
” major shift in human sentiment ” – thats exactly my point, the prevailing sentiment is that central banks’ strategies are working in boosting asset prices and they will do whatever to keep that. the shift in sentiment will be when people stop believing in central banks
this is not 2008. we have plenty of liquidity. banks are full of cash. they have so much cash that they dont want to take your money because they dont know what to do with it!
trend is your friend until no more. the last 5 years the trend is/was UP.
plenty of liquidity! wow that must be a fatty you’re smokin’!
banks are broke and broken
a debt based economy with no debt reset is doomed to deflation and it is here
http://www.shadowstats.com/imgs/sgs-m3.gif?hl=ad&t=1415422397
Well, I would argue against davinny and Big Tuna. A shift in human sentiment might just simply due to the overvalue in the SM. A return in the SM now is minimal as it might not go much higher. Investors may decide to shift their funds from one bucket to another, say from the SM to PM. A large wave of investors exiting the SM may trigger a second wave due to fear, then it would be a domino effect.
The markets corrected a few months after the Fed ended QE1 and QE2. I think most investors still believe that there will be QE4 if the market crashes. However, QE4 would only happen after the Dow already dropped like 20% or so, and that would be too late for the Fed to intervene. Just imho.
BOJ and ECB have defacto taken over Fed’s job to keep the status quo going. Though this time the USD is strengthening which make it different this time, but still you have billions of dollars coming abroad to buy stocks, and in their eyes, US stocks look cheap because check out where German and Japanese interest rates – almost zero (or negative at some point)
i think we need ECB to disappoint big time (they do have that reputation) to get this major correction. until then, would be grateful to get 4-5% back to 20 week moving average in the SPX for a trade
Harry Dent is predicting next few years of economic contraction due to demographic aging (read: older folks don’t spend as much on real estate, cars,
or t.v.’s). This mirrors what John has already shown in previous posts. Combined with solar waning will this equate to lower earnings and lower SM prices? In an era of fed printing will this time be different? I plan to trade lunar edge, seasonals, lunar declinations, apogee perigee, etc., thru the coming months to profit from market movement in either direction.
John, will you be adding soon? IWM looks like it is rolling over, -0.83% today, which is the biggest down day for 3 weeks. VIX is strangely off the lows too.
However, the last hour of the day is still positive some 15 days in a row. I just wonder, if I am Japanese and want to invest $50bn, would I spread it over 2 weeks? Or 1 month?
Gold warning: This guy (Rambus) is one of the best long term chartists I’ve come across. Interesting article with lots of charts that, according to him point to $700 gold.
http://www.safehaven.com/article/35778/wednesday-reportgolds-smoking-gun
my target has been 800 for gold and 8 for silver
my worry and deluge of chartists’ as well after the triple-bottom breakdown in the weekly
The Stock Market and Gold
http://ceo.ca/2014/11/13/why-there-might-have-to-be-one-more-downdraft-in-gold/
I don’t understand why people are looking for capitulation in gold…hasn’t it already happened? Sorry just have to be honest. I have no position. Perhaps it will go down more.
GDXJ is trading its entire float every 2 days — that means all the shares outstanding keep changing hands. What will capitulation look like if this is not it?
Do people understand that what the cost of oil to gold miners is?
In the last decade the rising price of oil added huge production costs to gold miners. So with oil collapsing and wages to contracters declining what do you think is going to happen to gold miners costs?
Martin Armstrong just published an article about the inevitable collapse in the gold mining industry. It appears that every second article he publishes is to dump on gold and gold bugs and whilst some of his comments are spot on, some of them appear downright hysterical and I gotta say suspicious.
The current decline in oil is reducing gold mining cost dramatically and I mean dramatically.
Allan, thank you for your insights………….. while I think gold can possibly drop another 150 to 200 dollars. from almost EVERYWHERE ive read, people are looking for further declines to 1000 or below, it’s almost a consensus – so is that a contrarian indicator/? i think …….may be
Thanks all, new post is out
The chart below is my current count for the DJIA. The vertical red line is where I believe this expanding diagonal (megaphone) started. I’ve marked waves 1-4. The current up wave since Oct 15 in my view is only sub-wave A and therefore I’m expecting sub-wave B to come down to the mid blue line before a final sub-wave C to new ATHs.
I believe sub-wave A will complete today or Monday with a small new ATH before we get the next down up waves.
So although I think we will have a 1000 point drop in the DJIA and something that resembles a crash I am not expecting it to go much further. i.e. John’s call for a crash is correct in my view but the ‘crash’ will stop around the 5-6% mark rather than the 18% that John’s expecting.
Just my thoughts.
https://www.tradingview.com/x/ZTEwygfk/