
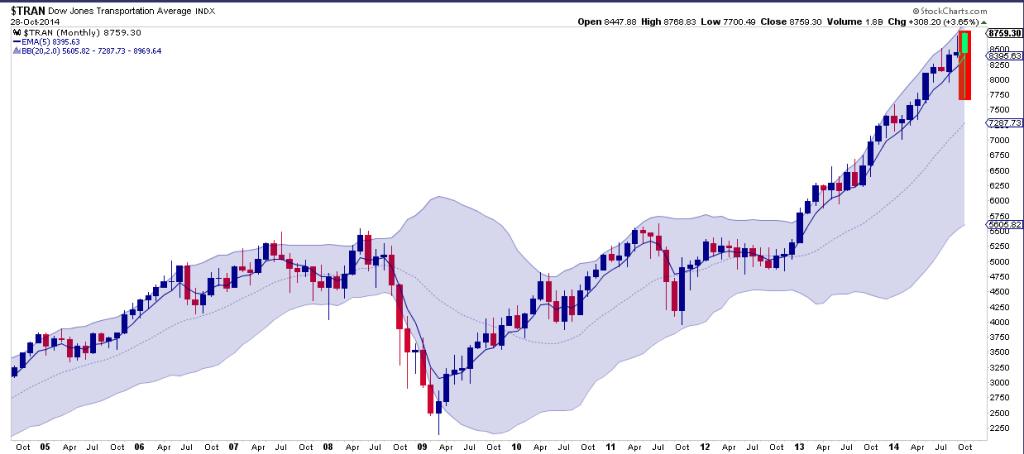
Another surprising day. Strong bullish action in US stock indices with leadership by cyclical sectors and small caps putting new highs within reach on most indices, and actually achieved by Dow Transports. The monthly candle on TRAN is something to behold, fairly unprecedented in the last 2 decades.
 Source: Northman Trader
Ditto on the other US stock indices, which makes drawing on a historical analog for guidance difficult. With 3 sessions left in October, we would need to see a significant reversal to negate this current candle. Should that not occur, then I have to allow for the prospect of a continued bull market into year end, given the seasonal tailwinds, breakouts in Biotech, Apple and a decisive move back upwards in the R2K. However, I still rather see the weight of evidence as supportive of the wider markets having peaked, putting us in the early stages of a bear market.
European indices show a fairly clear lower high and lower low, and the October rally looks like a relief rally and nothing more:
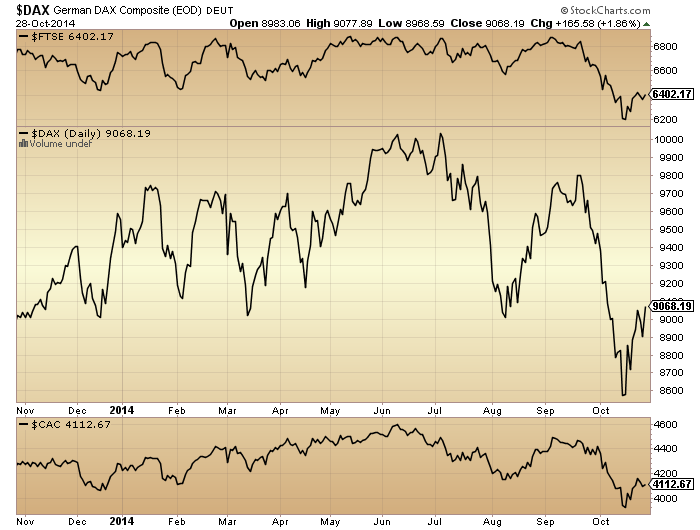
Source: Stockcharts
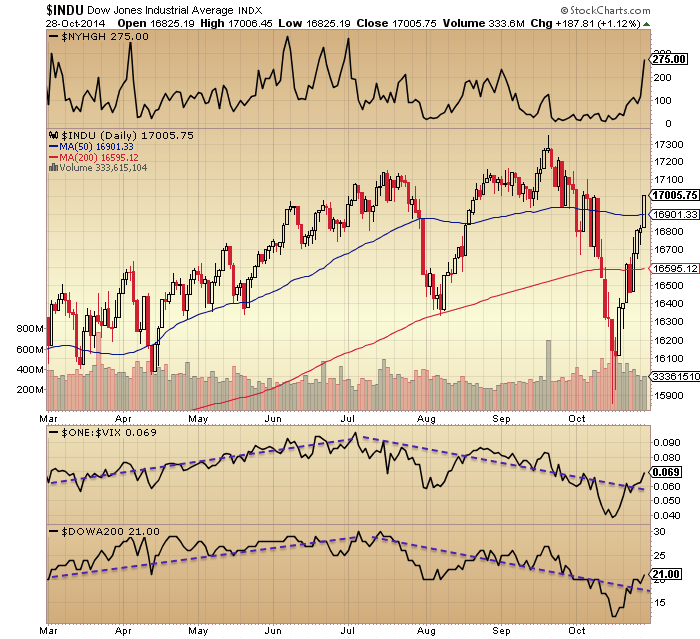
Turning to the US, here is the Dow (Industrials). We can see clear divergences in breadth and the Vix that still suggest we may have indeed made a switch from bull to bear at the start of July, but the price action is nowhere near as clear cut.
 The trajectory of the October rally is powerful but unsustainable. Nymo over 80 is a measure of how overbought we have become and previous such occurrences shown below led swiftly to significant reversals 8 times out of 9:

Source: Jack Damn
Therefore, the rally ought to reverse today or tomorrow and the FOMC output may provide the trigger.
Credit spreads have not confirmed this rally and are also showing a peak at the start of July:
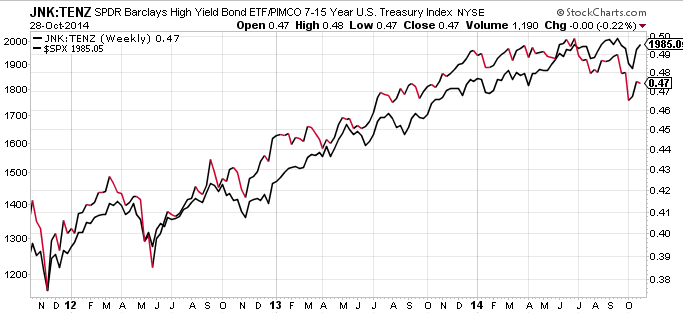 Source: Michael Gayed
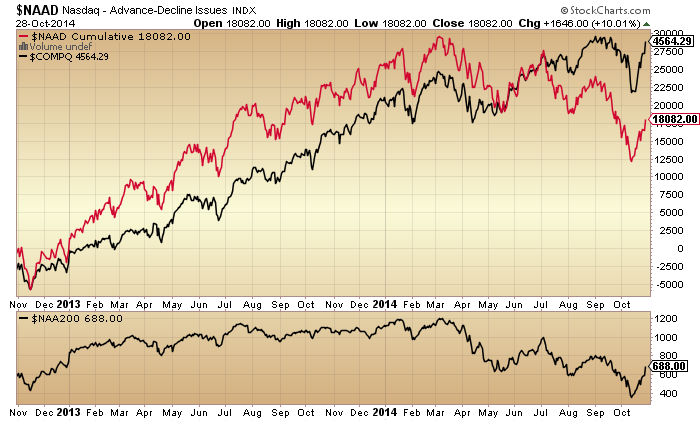
Nasdaq breadth diverged significantly at the same time and remains non-confirming of the October rally:
 An overall topping process in equities still appears to have begun at the turn of the year, with various angles on this:
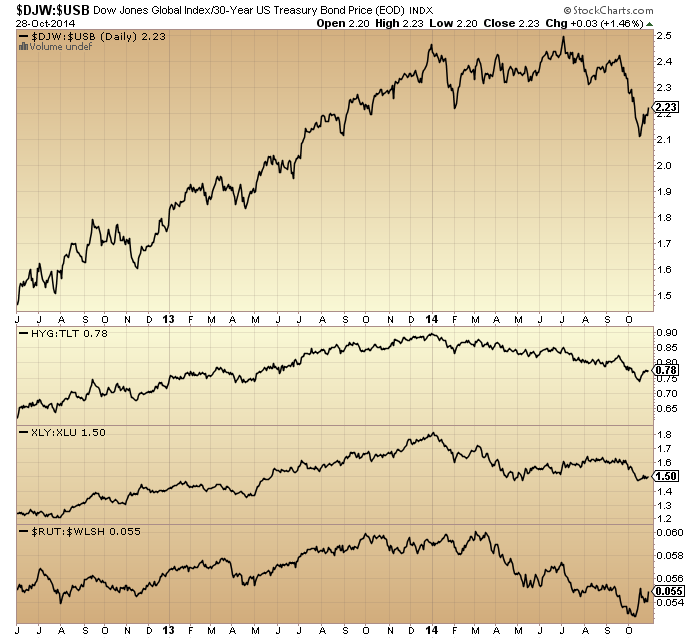 Again, there has been little repair from this powerful October price rally.
Skew remains in an extreme high band since late 2013, warning of an outsized move in price.
 Source: Barcharts
Investors Intelligence sentiment has been in a similar extreme high band over a similar period. Ditto Rydex allocations:
 These are all particularly mature flags now.
The key question is whether US stock indices can rally to new highs here and squeeze the bull market into year end. I have kept this as my worst case scenario for some time. Given the mature divergences and topping indicators that have been in place since the turn of the year, it remains questionable that they can extend that far. When we add in the additional non-confirmations that have been in place since the start of July, the probability further shrinks. However, given the breakouts in certain stocks, sectors and indices and the power of the October rally, I have to respect that it could happen.
The sharp rise in the Vix into early October and the subsequent collapse is unprecedented in speed, magnitude and reversal. Like the monthly candles on the stock indices we don’t have a mirror from history to guide us. If we are set for decisive new highs in stocks then I believe it will be clear with hindsight that the solar maximum was not through yet. If so, maybe that October spike in solar flux holds some weight:

Source: Solen
For now, the weight of evidence still supports the smoothed solar max being behind us, along with the speculation peak in equities. The weight of evidence supports a topping process in stocks that began at the turn of the year and peaked in early July, and a bear market being in progress since then despite wild oscillations in price. If instead price can make new highs here (in US large cap indices), then indicators suggest that much like the September marginal highs they should be short-lived. However, given how overbought the rally has become, it appears likely that price should retreat before this week is out, which would likely create the missing lower high in US large caps. After that, we would then turn attentions to whether price can base above the October lows.
My opinion on today’s FOMC is that it will be a market mover, and that they will stick to their QE exit. It seems the likely point for the markets to reverse back down, in a sell-the-news scenario, but given the power of the October rally, we will just have to see. Either way, the power has generally been in price, not in health. I see no reason to be bullish here unless many of those indicators and divergences can be repaired. However, we are once again at a crunch point, as this is about as high as we could expect for a ‘second chance’ lower peak. We have currently retraced 83% of the October falls on the SP500, exactly like the 1937 second chance lower peak. That, plus the Nymo and FOMC provides a set-up for a reversal here. No change in my positions until we see if that materialises.

Cheers John. No doubt in my mind that QE exit remains as the Fed needs to maintain cred. Any deviation from previous guidance to end POMO in October would be deemed as misleading and unaccepatable given that markets are virtually at all-time highs yet again.
And yes the action of the last few days both in the US and Europe does not have many precedents that I can immediately recall.
I knew the other week that this was going to apbe a strong rebound but this quite frankly has completely shocked me, not least of whch was the DAX action yesterday.
The CB’s mean business and Draghi’s comments the other week that he would do whatever it takes to support the markets was proven yesterday.
I am still pinning my hopes on the belief that the decline unfolds so swiftly that it catches even the best laid plans lacking.
Cheers again.
PS should have stayed with my 1980 target two weeks ago :(………..started biting a little too early.
I am sure there has been but I can’t remember such a large % gain over such a short time frame across all indices ever before.
‘Draghi’s comments the other week that he would do whatever it takes to support the markets’
Hello Allan. Rest assured Draghi is only interested in avoiding deflation, he couldn’t care less about the markets (just look at EZ unemployment levels as evidence of their monetary rectitude).
I will state for the record I don’t trade, but I deal with investments, and for the next few years HUI is the best candidate for good gains (potentially spectacular), as well as USTs, Bunds, Gilts and JGB.
The markets are weak, as we read at this blog, so I hope your trades pay off, I think a sudden crash is a distinct possibility.
Thought the group might find this interesting. I’m not taking sides here and no I don’t believe in 5.000 gold: no time soon anyway if it might happen. Note too how the CNBC guys advocate ‘trading’: in a rigged market?
http://www.zerohedge.com/news/2014-10-28/fireworks-fly-peter-schiff-warns-economy-lives-qe-dies-qe
Peter Schiff has been wrong, wrong, wrong. His investing advice stems in the main from his political views (even though he might not say so), generally a prescription for disaster.
He just opened Schiff Gold. A few years ago he promoted Euro Pacific stocks, maybe he is always early by a few years in his investments.
He was 100 % correct on the Housing Bubble… just a little early in his forecast.
Why because he recommended gold sub $300?
To the contrary, one who followed his advice based on his reasoning has done very well the past 13 years.
http://www.zentrader.ca/blog/?p=24322
Zen looks at options to conclude we are in the “phew” stage of a new bear market.
My own take is that this is being held up as QE expires and until after the Nov. 4th elections.
I’ve a suspicion SPX will likely put in a new high as the “b wave” of an expanded flat correction. If this transpires then the 200 point “a wave” could provide a “b wave” target of 2067, before a “c wave” fall to 1743, based on recognised fibonacci relationships.
Or, we could just double top into the 4th November date as another alternative. Either way, I think it’s unlikely we will get a strong reversal from current levels.
That said, I’m not writing off your analysis John. You’ve made some stunning calls over the years so I have sufficient respect to pay close attention to your work.
GL
TDL
This is not a criticism of you, TDL, but don’t we have a few other here who use EWT and suggest we have topped right here in this wave up? A perfect example why those who don’t use EWT feel there is too much discretion in calling wave patterns.
Happy to be corrected —
Why single out EWT? A few others here have said repeatedly that we’ve topped without using EWT. Every form of analysis gives us bulls and bears. Why should EWT be any different? Why is it singled out as a failure when all other forms of TA and fundamental analyses result in ambiguity? If EWT is a failure, then they all fail.
This guy does a much more eloquent (and funny) job of answering EWT criticisms than I do. http://www.pretzelcharts.com/p/in-answer-to-some-critiques-of-elliott.html
Thanks primaCanyon. Interesting link & another one to watch.
Regards
TDL
In my personal opinion I find EWT’s biggest STRENGTH is in its ability to define an ABSOLUTE STOP LOSS point for every trade. The ‘theory’ ALWAYS provides a point at which the prognosis is defined as a FAIL!! It took me a while to ‘get’ that but since then my trading has improved immeasurably because I’m out with a few points of failure. I have far more losers than winners (estimate about 60-40 or even maybe 70-30 on a bad day). But my winners are usually hundreds of points (I trade DJIA) while my losers are usually within 10-15points.
I agree with pimaCanyon that as a forecasting tool it is similar to other TA or ‘systems’ but its stop loss has zero ambiguity.
Use it like that and you’ll realise its primary benefit.
Sensible comments TDL.
And I also make SPX 2065 the natural top of a Fibonacci sequence (666-996-1201-1366-1531-1736-2065). The penultimate level, 1736, was perfectly backtested during early February 2014.
As for the expiration of QE, surely markets priced that in when it became obvious many months ago?
Alla Peters of http://alphawavetrader.com/ believes based only on price and fibonnaci that the near term outlook for the SPY is bullish.
A thought I’ve been mulling over is the amount of liquidity in markets and how that might be affecting price action. One could speculate the primary actor at the margin is the hedge fund manager, not the public, and the former are caught out underperforming this year. This, along with the lack of liquidity, would explain the almost schizophrenic behavior, particularly of late, and the tendency for markets to “overshoot”.
the action over month of October feels like cleansing of both bulls as bears, and I am speculating that yesterday was mini-capitulation of the bears similar to the mini- bull capitulation two weeks ago. If we do get the whoosh down in the coming days, I will say that the market “soda machine” amplitudes are getting bigger and bigger which would signify a huge change of trend. lets see what today and tomorrow brings. the latest vol should be very unnerving for the buy-and-hold crowd.
And with many of the shorts squeezed out of the market by the rally, who will buy on a sudden decline. John Hussman refers to air pockets in these circumstances, when there are simply zero buyers.
major source of liquidity are the banks and the regulators are still not done with the reserve reqs for them as per Basel. Per schedule there will be new reserve demands coming up to 2018. Some banks could be in compliance with them already though. But still, when/if QE ends, the spiggot will dry up, we have seen this movie before.
Not a problem Gary. I’m only speculating, not making a prediction. I use EWT to describe possible outcomes. In truth I don’t find it all that useful in my own practice.
FWIW, I’ve come to the view that the US indices are more a function of government and central bank will; I still marvel at Obama’s public speech in 2009 near the market bottom telling people they could go out and buy stocks with confidence.
But, we are where we are and I do place store in support and resistance. We’ve broken back above key resistance on the SPX and are now within sight of that all time high once again. That alone suggests to me it will get tested.
I could easily be wrong so DYOR & WTFDIK.
GL
Gone long on dow at 17005′
Just to hedge my SPX short at 1979
Hoping not to get whipsawed
Speaking of overshooting, is this THE most important LT chart that will reverse or is it THE breakout that bears fear the most?
charts.stocktwits.net/production/original_28523718.jpg?141452214
Earnings will tell the tale in my opinion, per John’s thesis.
Those are not valid trend lines…..read Edwards and MacGee
Sorry should read long 17007
None of this is surprising if you read some Martin Armstrong, understand capital flows and think of this in the terms of game theory and not astrology.
Since forever astrology has been used for everything from agronomy to commerce. Even Warren Buffet seems to plan his investments based upon the science tho’ he is not public about it. Just look at the stats on this site on the Lunar Edge system to see the validity of including some amount of astrology in your trading.
DAX and Nikkei have put in 48% and 57% wave 2 retracements which is permissible under EWT and should make them complete in case S&P 500 decides to turn lower from here.
Bear markets occur with falling earnings and a turn
In the business cycle, 87 is the only recent exception.
You can have violent sentiment swings within a
Continuing bull market, John’s 18% minimum decline
Could still have accrued within a continuing bull trend.
The multitude of charts that looked uber bearish just
Two weeks ago now look incredibly different,
Elvis posted so many I lost count, that is not meant
In a disrespectful way.
A moderation in earnings growth will not be enough to
Kill this bull market imv.
There are plenty of warning signs which may continue
To develop, particularly from global multi nationals
Reporting recently.
My own take is that the US domestic economy remains
Strong enough, for now, to enable the global bull market
To continue.
The FED cannot abolish the cycle,
They can alter it but ultimately the business
Cycle reasserts itself, as will happen with the
Next recession.
Bear markets start with increasing earnings and sales. Way, way back in the good ol’ days (1950 to 1960’s), a good time to sell was when GM reported record sales and earnings. The bear market would begin and proceed through and bottom during lower sales and earnings (losses). Repeat. The exception to this which is very rare is deflation.
https://pbs.twimg.com/media/B1IRuHwCAAE_TRZ.png:large
interesting that the spectacular earnings growth periods match periods of cheapening money and the floods of cash coming our either from declining banks reserves or newly printed $
Also from firing all their employees.
can you specify on a technical basis what you mean by ‘incredibly different’?
elliott wave definition of wave 2 tops is that the majority thinks we are back in the main direction of the trend – check
Another ol’ saying, buy the short lines and sell the long lines. That is, on the way up the daily weekly monthly chart lines (bars) are about the same length. Then there is a blowout and/or the bottom falls out and the chart lines are much longer. That is what is happening now. If you look back at previous tops, the current action is typical action at tops, not unusal. In fact, the transports are typically one of the most volatile, and this one is spectaclar but its DNA. A long time back when we started trying to call this top, I said the only problem is that tops can wear one out. Well, at least I right about that.
cf. http://www.investopedia.com/terms/h/hangingman.asp
Yes, but I’m thinking more engulfing.
For sure, an outside period of either colour at the end of a long run up is an amber warning light.
Kent, my point may be not well made,
Is that 20% plus declines are correlated
With earnings compression.
My definition of a bear market is a decline
From the peak of at least 20%, and the index
Remaining at below this minimum level for
At least 3 months.
I did not say earnings compression needs to
Occur at the beginning of this period,
But earnings will begin to fall within a bear
Phase.
Agreed.
Closed SPX short and long dow, both for a small loss.
Just spooked about getting a whipsaw move up and down. I’ll sure I’ll regret it later.
Will look again 8pm tonight
I find the fibonacci retracements to 2067 very interesting, since I have been getting a deja vu feeling of Oct 2007 when the SPX fell 10% in 6 weeks from Jul-Aug, then rallied to new highs in 8 weeks. A similar rally should top by Thanksgiving, providing an inverse Bradley turn. The market always does what is least expected. After that we saw a 20% decline that took about 4.5 months.
Stick save for the VIX up-trend?
http://scharts.co/10yLJPK
Have previously written by indicators we should be equivalent to October 2007 or January 2008. The monthly candles for those two months don’t look dissimilar if we can close the month slightly down from here.
John,
The graphic is very clear but it also shows that it is possible we will see a slow bearmarket instead of a crash so were will we go from here?
Do you think we will test the lows again very soon..
It does show a slower bear roadmap as an alternative to a crash. But in 2000 the crash came early, in 2008 the crash came late. It still crashed.
First things first, looking for a reversal and a lower October close. Then November should be down, but whether down mild or down massive we’ll see.
thanks for your answer..
I still think the bradley is a great tool and there is a good chance it will invert again in the direction where it’s heading..
You can see things speed up in the graphic end of this month so we will see a big move comming up or down?
I have been following John Hampton’s blog since I discovered it last December and I fully appreciate all of the hard work that John devotes to it. Today the NYSE announced margin debt for September 2014.. The figure came in at $463,878 million. This is a slight increase over last month but is still below the peek established in February of this year keep up the good work
Thanks
Got my short in early in the week, a little under water but holding… In a position with JNUG.. Miners and Gold are completely hated right now. Barons had their sentiment readings out and over 87% of respondents were Bearish Gold. Last time that many were on one side of the trade was at the top of the Japanese Market ( 85% + Bulls that time – Yes that was the Top Lol). The current set up in JNUG is looking like the April/May 2014 setup. Consolidation then a drop lower then a move up over the 10DMA then a nice run up of over 100% from support in the Consolidation area. Looking for a 10 DMA cross of the 20 DMA and a close above the 10 DMA and we should be good. There is currently some divergence on the RSI and MACD is just hanging on…. We shall see
Just read on ZH that Alan Greenspan said that QE didn’t work and that investors should buy Gold…. Damn, now I’m conflicted… Should I sell my JNUG and SPX short and go ALL IN SPX, lol.
it is definitely a conundrum
Since I have been a GDXJ loser, I agree and would add “wrapped inside an enigma.”
Do the opposite of what Greenspan, or Bernanke, and undoubtedly Yellen. Greenspan, irrational exuberance – 2 or 3 years early. Bernanke, housing prices would not drop and subprime loans contained. Yellen biotechs ?
Central banks have come to realize that every word is a market moving event, and that their policies have little economic stimulus for the working masses. To protect themselves from responsibility for both bubbles and crashes they will attempt to talk the markets into a flat range, buying time until some other event will take the attention off of them. It is there only move, on a professional and reputation preserving basis. Whether it works is another matter.
The stock market has gone up with the expansion of the Fed’s balance sheet. So today the balance sheet will stop expanding.
John mentioned the rally has hit the maximums of 37′ and I believe 87′.
At this point it doesn’t matter what the fed says or does it is how the traders react to the news that is important. Most will wait until after the announcement to make a trade. My bet is we close lower than yesterday. Placed 1/2 my bet at the 63% retrace and the remaining just today.
Today is the line in the sand and we don’t want to close significantly higher. If we do I will take my 2%-3% loss and sit in the corner again.
No more money out of thin air, but cheap money to stay, probably forever. Cheap money did not really help Japan earnings much tho. Bank reserves are yet to continue rising per regulation, where the liquidity will come from to support these valuations?
Perhaps not quite forever – cheap money is predicated upon running the world’s reserve currency – and *that* is predicated upon being the global hegemon. So how much longer might that be the case? Someone attempts an answer here: http://cluborlov.blogspot.ch/2014/10/peak-empire-take-two_96.html
http://fxtop.com/en/historical-exchange-rates-graph-zoom.php?C1=USD&C2=JPY&A=1&DD1=01&MM1=01&YYYY1=1990&DD2=29&MM2=10&YYYY2=2014&LARGE=1&LANG=en&CJ=0&MM1Y=1
went back and checked the long term trend lines coming into play for $/Y and it looks like there are 3 at 108.50, 109 and 110. This should be enough to reverse the carry trade lower. Have a seen another test of those trend lines today in my view making a lower high in the process confirming a possible roll-over in the indices. Also Biotech back into uptrend channel after a bearish over-throw the last days is noted. Little support till 2650 in NBI.
Pegasus, I think USDJPY may decouple from stocks here as it looks like it wants to breach all that resistance levels. It made a low of 105 on Oct 15th, finding support at previous major high (of Jan 2nd) and didn’t look back.
For a long time I thought USDJPY should crash with stocks but it seems that $ is the king for months to come.
Both GDX & GDXJ broke support at the Dec 13 lows. This is MAJOR. Down from here. Looks like Armstrong’s low for gold in fall 2015 might be correct. I however, think perhaps next summer.
The 8 year cycle in gold, one of the most reliable I have seen, is due to bottom in Dec, 2015
how come GDXJ is only down 6.6% today ? With the FED, i would have expected down 12% or more. Down 6%-7% daily is pretty normal for GDXJ. Still, I can’t complaint.
So, what’s the view now on gold and the markets ?
Watch out for the full moon, most of the gains on GDXJ have been the 10 days prior to the full moon and then sold off.
Only down 6%!
Trannies look to put in an outside reversal day.
DEFINITION of ‘Outside Reversal’
A price chart pattern in which a security’s high and low prices for the day exceed those of the previous trading session. The outside reversal pattern is called by candlestick chartists and analysts a “bearish engulfing” pattern if the second bar is a down candlestick, and a “bullish engulfing” pattern if the second bar is an up candlestick.
Gold on its way to triple digits… and stocks still do not get they’ll be taken to the woodshed soon.
yep. 3 years ago who’d-a-thunk that gold could drop below 1000. Now $800 gold seems a real possibility.
Well, I would say gold at 400$ soon, then a rebound to 410$, then a continued collapse to 200$ to triple bottom. GDX should bottom at 3$ if they are still some miners standing.
Huge increase in GDXJ volume this year. Anyone got any theories?
http://scharts.co/10zjZum
Yes. Sell. Going lower.
I don’t follow GDXJ but i will chip in some ideas. Does anyone study volume spread analysis? Basically, volume is activity, someone’s buying while someone’s selling. Professional money buy when the market’s going down. Retail investors do the opposite and buy the market is going up. GDXJ has been in this trading range for a good period of time and only recently do we see a massive volume coming in, this is professional money buying. To enter a trade position I might wait for a trigger, but the set up is there. DON’T SELL. OR SHORT. If you’re waiting to go long, pay close attention.
https://www.tradingview.com/e/JmBFjf2c/
I should add that the price will likely go below previous bottoms to kill stops and investor confidence. Then it’ll retest several times along the range to make sure there’s no supply, then it will start a new up trend.
If there is massive volume coming in on the buy side, wouldn’t that cause the price to go up at the same time.
Steve, the volume is massive. I can only tell you that because the chart says it’s massive. To answer your question, no, smart money always buy on down bars and price will keep going down. One reason is market sentiment which is often led by news. I didn’t invent this stuff. It’s the nature of the market, when I want to sell you something I’ll tell you how cheap it is and how much profit you’ll be making, when I want to be buy something from you I will tell you it’s worthless and I will do anything to do mark down the price so there’s no competition.
Yup, this was pretty much my thinking. Against this we have the triple bottom in gold itself (a rare to nonexistent beast) and fresh air below on my monthly chart. Will be keeping a weather eye out.
Beautiful EW ending diagonal on NQ hourly (24h)… if I believed in such things 😉
Needs to drop from here.
But… EW-ers, that makes 5 waves up, which means either a truncated 5 to finish here and crash, or we a-b-c and then off to the races north again. Which leaves me wondering how all that actually helps me – and that is rather why I don’t spend too much time counting waves these days… 🙂
I don’t either actually. Almost always too many counts. (But I do like looking at other people’s counts, I guess that makes me lazy, eh? 😉
However Ending Diagonals are worth paying attention to, but even those have fooled me at times–they look like an ED and then turn out to be nested 1’s and 2’s.
Friday will be a Buy day so if high made first within the first hour opening, short
looks like everybody is calling for at least another leg down for PMs and looking at the charts it just may happen. i’ve read some articles regarding strong demand for physicals at these prices, well, i have seen it first hand. did some traveling the last few months and one of the stops was Hong Kong, decided to stop by as many jewelry shops as i can find and what i saw was an insatiable demand for gold by the mainland chinese, it looked like there were shopping tours just for gold as there will be 20 to 30 folks huddled around the gold section while barely anybody in the other departments, this was the same for all the shops i checked. some of the folks here are calling for gold to go down to 3 digits, if it does it will not stay there long and by the time the price recovers, i am afraid all the gold will have been shipped out to the east.
due to this strong physical demand i find it hard to imagine the price of gold going much lower but when one can short more than what is physically out there…anything can happen.
Agree with you but I m from East and I know the physical demand of Asia not compensates enough for the lack of investment demand of the west. ETF gold holding worst and TIPS spread down as deflation prevails. Only thing keep gold at that level right now is safe heaven.
Central Bankers can only keep the bear at bay for so long. Whilst I believe that intervention is very real, I also believe that once the tide turns completely against them there will be no way of stopping what is coming.
They DO understand deflation and its consequences. My beef is that they have made the inevitable far worse than it had ever needed to be by creating massive debt to fuel an artificial binge.
The DAX is still forming a wedge. Can they break it higher or does it eventually break lower with force?
I think they lose control at any moment.
http://stockcharts.com/h-sc/ui?s=$DAX&p=D&b=5&g=0&id=p47702180936
I still believe as I said the other week,despite the frustration with this rally, that we are currently building the right shoulder that will eventually lead to a crash. How long this takes is anyone’s guess but based on the DAX I don’t think we hang around too long at these levels before heading significantly lower.
http://stockcharts.com/h-sc/ui?s=$SPX&p=W&b=5&g=0&id=p14467017861
Low gold prices would be a boon for the US government who need to find many hundreds of tonnes for Germany……tongue in cheek perhaps…..?
J
Swiss gold initiative vote is on Nov 30 – and it could actually happen:
http://www.zerohedge.com/news/2014-10-28/things-make-you-go-hmmm-swiss-gold-status-quo-showdown
Switched to long on ftse for the Christmas rally. No positions on US markets though as I refuse to go long on such overvalued areas. Although I expect ftse to gain 200-300 points which would take dow to 17500-17600 (maybe even 18000) before a drop in January. Still think John scenario will play out but just not this year. I think we get further Europe downgrades and that will kick it all off.
The long term HUI gold bug index looks like death to me. If you view weekly chart it hit a top mid-Sep 2012 and basically went into freefall until late Jun 2013 (9.5 months) for a decline of -61% from about 530 to 205. Basically it has been trading in a slightly downwards sloping sideways channel starting from the high of early May 2013 until now (18 months). To a chartist eye this looks like the first impulse move down and then a consolidation period marking the half way point before the continuation of a second impulse move (down).
If this is indeed the case then HUI 150 would mark the lower bottom of the present sideways channel and realistically looks achievable by the end of Nov 2014. If it breaks below the channel then a second impulse move measured from the last top of the channel at 250 in late Aug 2014 would result in a projected move towards 100 or -60% and occurs within an one year window of the break out.
This could potentially spell huge opportunities in leveraged inverse ETF’s such as DUST or JDST. Both have already doubled from their end of Aug 2014 prices in two months. A move to HUI 150 implies additional 45% to 50% upside near term and a HUI 100 implies additional 130% upside in DUST. The risk is if HUI bounces hard off the lower channel around 150 first before it breaks out of the channel which would destroy leveraged inverse ETF prices during such a rally.
Thanks all. New post.