
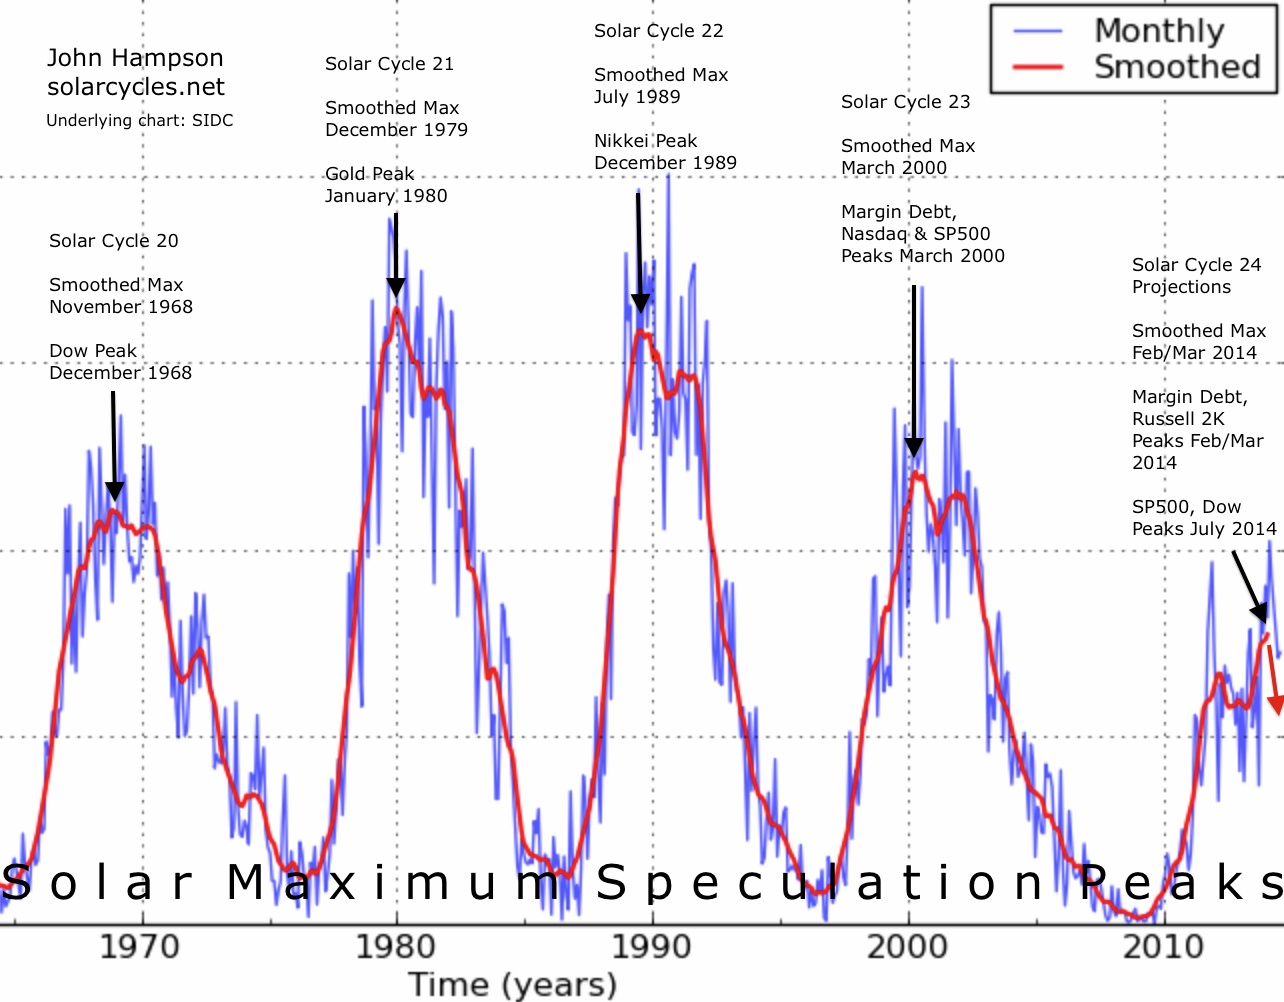
Sunspots and the smoothed solar maximum appear to have peaked around March 2014.
Margin debt, Russell 2000, social media and various breadth measures look to have peaked around then, in a speculation peak epicentre, and all major global stock indices have tentatively topped out within 6 months of that.
In line with previous solar maxima we are seeing a particularly hot year globally, with 2014 so far the joint hottest on record globally for land and ocean combined.
Agricultural commodities may have a burst ahead of them.
Equities have run away from the cumulative geomagnetic trend in keeping with a speculation mania over the last 18 months, whilst broad commodities continue to track the model.
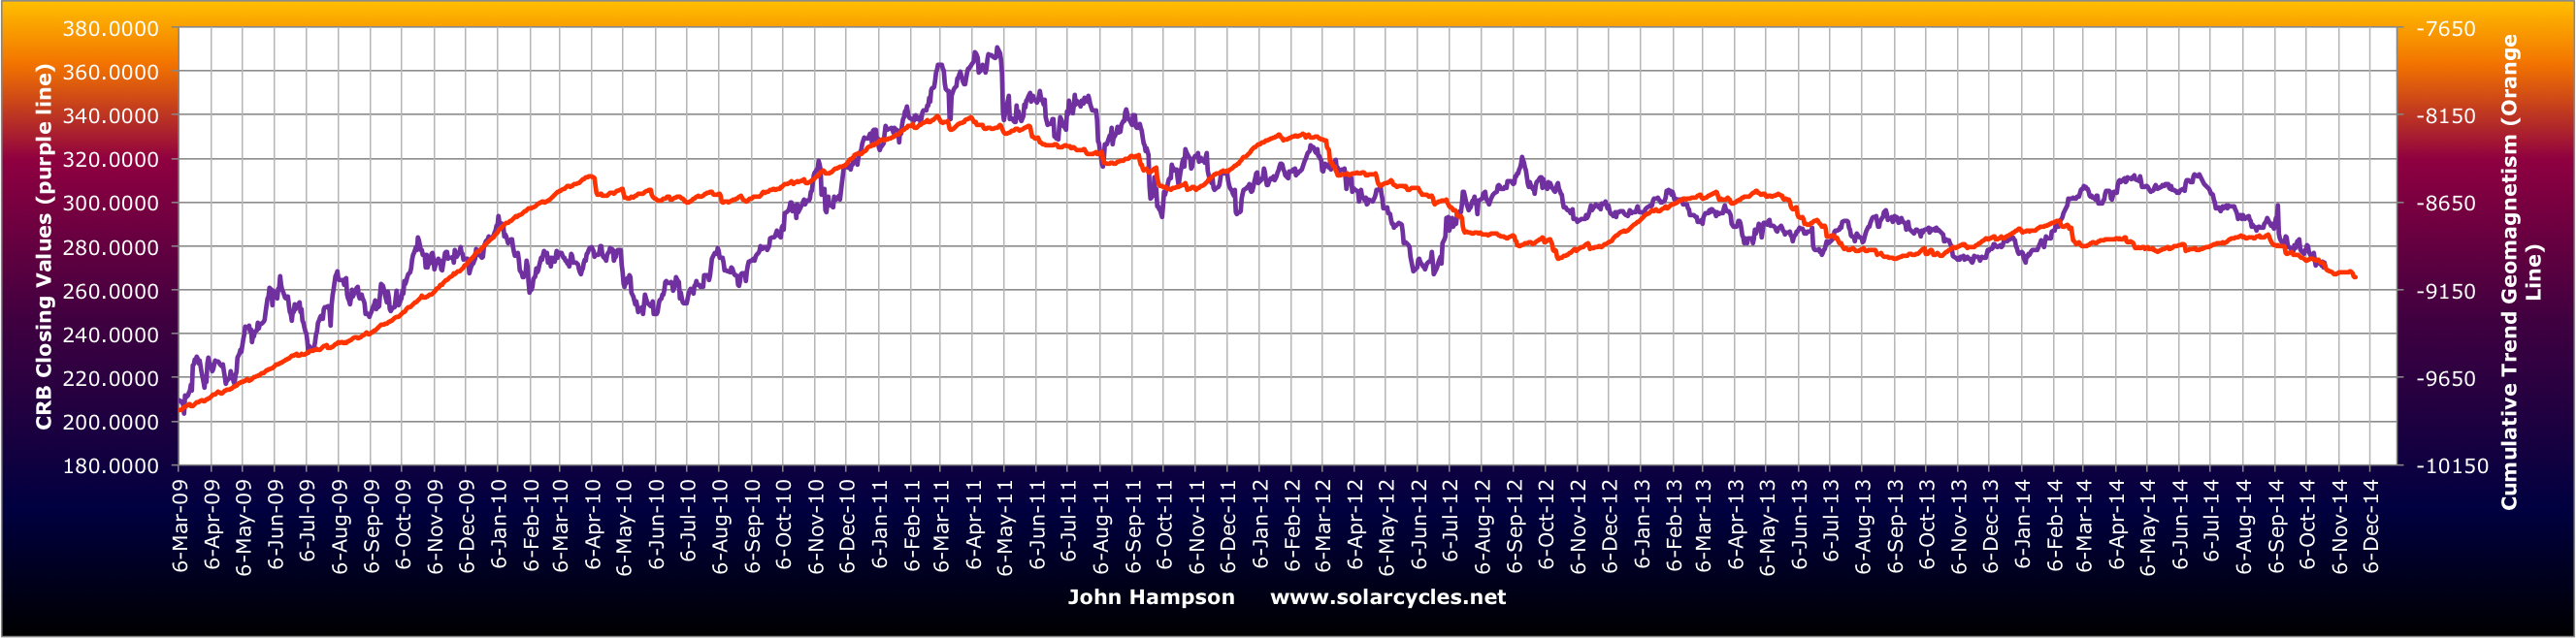
The geomagnetic trend just lately steepened downwards, in keeping with the seasonal geomagnetic peak time of year.
This post-solar-maximum, geomagnetic pressure period is likely to drag equities down and maintain the peaks between March and September in the major global indices, implying we are in a new stocks bear market.
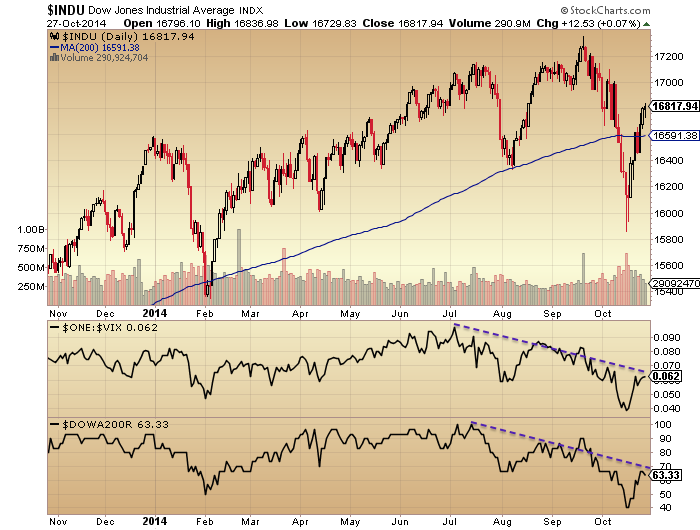
I maintain the likelihood of the new moon reversal, i.e. that this week should now see the renewed move lower, making for a lower high in US large caps.
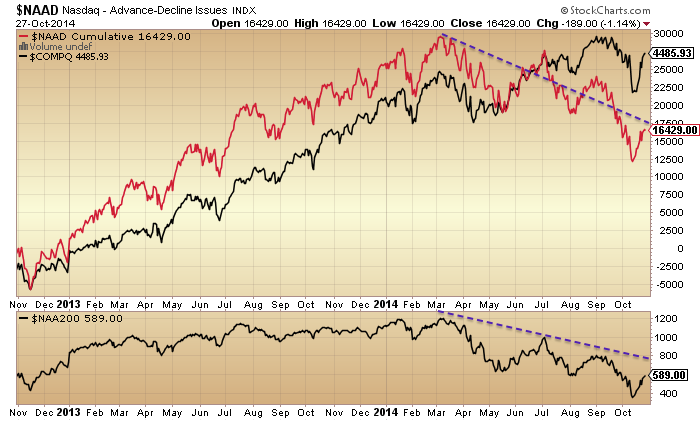
This probability is supported by the picture in Nasdaq breadth, which peaked out around March.
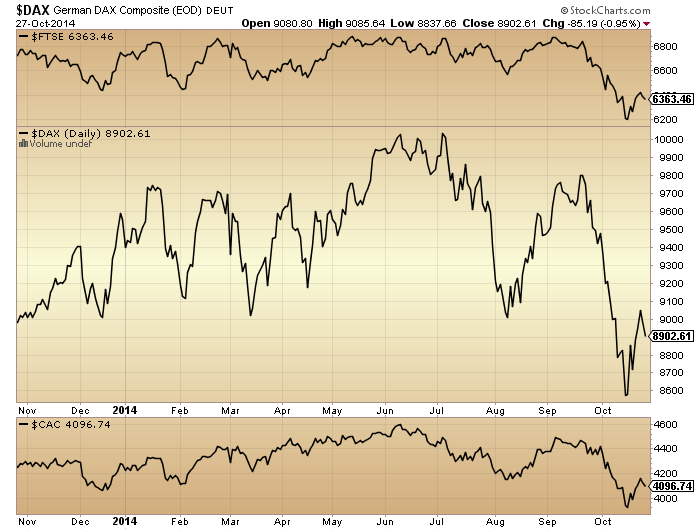
The European indices likely initiated the roll over yesterday.
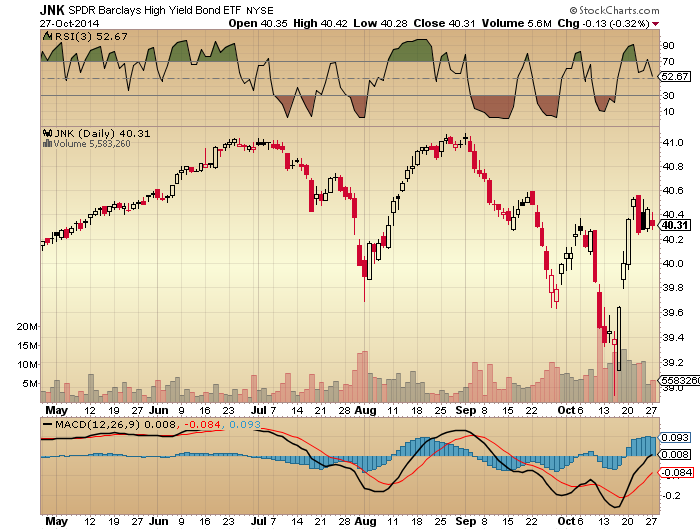
Whilst the junk bonds rally has possibly petered out the last few sessions.
 In summary, I still expect the markets to roll over here, providing the missing lower high in US large caps to go with the lower low (and existing lower highs in other indices). With a doji candle yesterday in US indices, a further doji candle today would provide the roll over set-up similar to 1987 and 1929. The likelihood of the Fed sticking with their QE exit in tomorrow’s FOMC output could then provide the trigger for the falls to initiate. The triple negative of the period into the full moon, the geomagnetic seasonal peak and the post-solar-maximum hangover provide the backdrop for this all to occur. I believe we are already in a bear market in equities but this isn’t going to be clear for a little while.

I’m the first!
John, I’ve been coming to your site everyday since March.
Thank you for sharing your great work and I’d like to thank
other people who have been sharing their research as well.
Thank you!
Thank you John for a great post. Futures are all green across the board today – looks like it may make a shot to 1973
S&P E-mini is 1967 right now (08:13 ET) so the
opening price would probably be 1973.
Thanks
umm, sorry folks for the huge chart above, I cant figure out a good way to post it. John, feel free to remove it. I thought it was a good one tho:)
Looks fine here Slim. Great chart!
None needed. The message is large and clear. It woke me up. Does the narrower fuse indicate a more rapid crash?
not sure, i think it could be warning that the down move is coming very soon.
Thanks John.
The markets are not going to give this up easily. I guess we should known by now that with the Fed “fix” again this week that investors would again be poised ready to pounce on every word and that the opportunity to run the indices higher, prior to the actual statement, would prove irrestibly easy.
I read a article recently that the Fed statement prior to 2008 used to contain roughly 100 words. Since then the statements have grown exponentially in length and as such complexity, to now contain over 1000 words.
I remember a time when markets hardly blinked at Fed statements. Now they have become the ONLY thing that are of any consequence. Fundamentals no longer mean much at all.
This has been the worst post recession recovery since WWII and yet market growth has outpaced GDP growth by 5:1 to become the second strongest bull market in the same period.
We keep hearing how well companies are doing and yet wages growth is the slowest EVER, as share buy backs cover up the truth and Corporate debts levels are beyond scary.
Once again in yesterdays session the intraday charts slumped further into negative divergence and defied gravity.
Again I am reminded how foolish it is to underestimate “Fed speak week”
Cheers
http://www.bloomberg.com/news/2014-10-26/s-p-500-rising-at-five-times-gdp-shows-recovery-priced-in.html
Allen, your SPX target was a great call,
even if this does reverse right here,
Which is by no means guaranteed.
Thanks Phil, I may have turned bearish a tad too soon, however Friday and leading into yesterdays session things looked to be turning.
Add the following on top and well…………..? I’ll just say that I think there is a little bit of shenanigans going on here.
Taking a look at the DAX chart as of close yesterday it doesn’t take a technical genius to see that the days action was pretty bearish and that indicators were beginning to appear to roll over. Another down day I believe woukd have set the ball rolling.
Fast track to today and we have the DAX rebounding 1.4% at one point whilst all other European indices are up just around a third of the DAX…..how so?
http://stockcharts.com/h-sc/ui?s=$DAX&p=D&b=5&g=0&id=p46157268096
In fact here is the chart above but this time showing the open as well as the close and it is even MORE bearish than I first thought.
Yesterdays bar was in fact an “outside reversal” day. It is not very common to get an outside reversal day in a large Index especially at such a crucial price level as the DAX was situated yesterday, so it would appear that overnight in Europe some BIG players have decided that something had to be done to arrest the potential bearishness in this chart. And it is pretty damn bearish.
http://stockcharts.com/h-sc/ui?s=$DAX&p=D&b=5&g=0&id=p48911638521
Bears are becoming discouraged, and understandably so with the behavior of the Trannies, biotechs, MMM and others. Still, the fat lady hasn’t sang yet. The market is counting on continued earnings growth and while I haven’t seen the stats yet, the reports so far for the 3rd qtr look decent.
But the overarching meme continues to be the Fed “put” but now it’s migrated to what bulls like Nick are saying, i.e., that even if QE is over, the Fed (and other CBs) will continue to buy equities to support markets. Really? To me, that’s a very slim reed to lean on.
I say it’s a slim reed because it’s unprovable. It’s one of these “stories” that sound plausible, and may in fact be reality. But no one knows – it sounds good, though, and so long as the market continues its ascent, people believe it. To me, that’s not a very solid foundation on which to invest one’s money.
Gary, its new paradigm, this time its different, the Fed got our backs and the money will grow on trees!:) all we have to do is put money in stock market, retire and live happily everafter. maybe we heard this pre 2001 and pre 2007, but this time this is truely a new world!
Hey Gary I wouldn’t lean to hard on that reed either but man ‘o man I look at that DAX chart and the bar yesterday is UGLY UGLY UGLY!
Outside reversal in conjunction with a break down from that rising wedge and just above critical support and low and behold what happens today……..hmmmmm??
Somebody is buying the DAX on no news for a reason??
When QE ends, I’ll feel more confident about reading in to price action. Right now we’re in the thick of it with the Fed, so I prefer to exercise some patience. Now no doubt Dr. Yellen will say we have an extended period of low rates in front of us – will that come as a surprise to anyone? It will surprise me if it does.
If I were a bull, I’d be concerned how much of this “QE extension” story is embedded in prices.
Mate, I’m actually with ya on QE and that bulls should be concerned. I guess my posts today are to highlight that “someone” with big pockets is still prepared to put up the $ regardless of how bearish a chart can look and in fact if recent history is any guide, even more so. Ie, the more bearish things turn the greater the effort appears to be to reverse things. Take the past two weeks as a point in case.
I hate harking back to that DAX chart but there is no way in hell I would have bought that yesterday OR today given the bearishness of that reversal yesterday and I fail to see how anyone possibly could.
One thing I feel pretty certain of is that I know where a lot of the ECB QE went today and very timely as well.
Allan,
You say bulls have to be concerned? NO it is the bears who were misled who have to be concerned.
Thanks John great post! Massive sunspot 12192 turning out of view tomorrow.
Bumping against uptrend channel in biotech and downtrend channel in spx today.
In biotech the market is retesting the parabolic ascent from the last year
biotech is about to gap up today on pfizer earnings and extend its parabola move further out (pfizer, btw, is not a biotech.:) this is great, brings up a sense of deja vu in me.
John, I admire your persistence! I have been throwing in the towel with this rally. I wonder if I am overtrading.
I know you mentioned you might add if there are a few Dojis. Have you generally kept a static position since the peak otherwise?
1968 on S&P Futs is now lateral resistance. The market will sell of on the Fed minutes, new lows ahead within a week. IMHO.
Buy gold.
Yes, just kept my positions but not added as we didn’t yet get the roll over
$/Yen remains inside the ending diagonal structure which limits market euphoria – 108.25-108.75 thick resistance from diagonal and multi year falling trend line. As John pointed out on lower lows and lower highs the carry trade so far made a lower low (2011/2012) and recently a lower high. Therefore the pair will resume its multi decade downtrend soon.
Pegasus, I’ll be watching this closely with you!
Marty Zweig coined the term back in the 80’s I think called: “Don’t Fight The Fed”.
Another Iv’e heard recently is “Fight The Fed And End Up Dead”.
The following reminds me of what investors are up against.
Pattern in ES contract has formed into a wedge with final exhaustion forming right now. In my view all that rise rise from last lows has morphed into one big A-B-C and not 1-2-3-4-5 impulse and this spells real trouble.
Only time will tell but now I give more odds for breaking last lows so that means no final rise to Jan 2015. Fed will NOT extend QE tomorrow.
As John said many time Russell should lead the decline as being the weakest index.
Looks like Steve T’s fractal has given up the ghost. 😦
I am not writing it off. Day to day movement does not need to be exact. But instead of a small decline correction from the big rally like last spring, what might be occurring is a “consolidation low” presently (even though prices are ever creeping slightly higher and above the Oct 8 high) before an impulse move upwards for a breakout. Recall that on the big decline from Oct 8 to 15 it was one big daily drop without any noticeable rally, unlike in the spring where there was a two day counter rally. It looks like the same thing occurring here in this huge snap back rally again.
The fractal calls for higher prices over the short and medium term and that is the bigger picture. It is just unfortunate that there is no set up to get in at more favourable entry if you want to go long.
thanks for the update!
So it sounds like you’re bullish medium term? You’re expecting new all time highs on the SPX?
“You’re expecting new all time highs on the SPX?”
Yes. This was already stated back in September that this scenario occurs after a mid-Oct correction likely under 10%.
Oh, I should also mention that I do believe that John’s call for a deeper correction in the realm of -20% will occur but I think the timing for something like that does not happen until maybe autumn 2015. Unfortunately, if it even happens, it does so from much higher levels than today maybe even 2500 SPX or whatever and it would still not help folks who are shorting at today’s prices. The drawdown on such a move would be analogous to someone shorting late 1998 during the dotcom boom just before the parabolic move occurs and not very many souls could survive it financially.
I think there also might be another shallow correction in the -5% to -10% range that occurs early next year, possibly around mid-Mar 2015, but I have not really looked into either of these two scenarios too much. We have to wait and allow for the action for the remainder of 2014 to transpire.
man, i just love watching the biotech index ripping up on this parabola move, with gaps, up 17% over last two weeks. good old days come to mind:)
blow off top
if we close down today in biotech would be the ultimate reversal
Market is NOT going to crash so close to Election day.
is the r2k march peak based on p/e? wasnt the price peak in july?
Hi everybody ! So, how are your shorts doing this morning ? My IBB and QQQ are doing very well, thank you.
Nikki, always a pleasure to hear from you!
horrible day, Nic!:)
Biotech ETF has an average PE ratio if 42x and Price to book value of 11x – not bad as a bubble leader – believe there are some shenanigans going on from not including stocks in the caluclation which have negative earnings. So the true PE may be even higher.
I used to dismiss the notion that the market “valuations” are driven by the free money from the Fed but have grown to believe that this is one and only thing that does it. Same thing was happening in the 90s and 00s the only difference is that the flood came from ever cheaping money and ever decreasing reserves (increasing leverage) of the banks. Once the flood of free money from the CBs stops- markets will suffer. Next bad thing that can happen- the increasing cost of money. The Fed is in a humongous pickle but they have to stop the insanity. Otherwise- people will have no incentives to work as they money is growing on the trees oo the Feds printing presses. First- stop printing. Second- end the ZIRP. I believe tomorrow they will say- we are done with printing sorry. But you get to keep your ZIRP for “extended period”. I doubt the markets will like it. But too bad.
Biotech index was growing at roughly 17% every quarter since 2011. Thats spectacular but begs the question: where was this kind of performance in prior years? I am curious if Yellen brings it again tomorrow- the index is up roughly 20% since last time she said is was overextended, lol.
good point Slim!
and one final thought. I believe that the main money printing goal of the Fed was really to beef up the banks reserves. Replenish them after the silly games they have played in previous bubbles. Make them stable. I think they have achieved this goal in the US. Europeans- not really. But apparently they pretty much passed the stress-tests. Is it a coincidence that the european stress tests reasults are published right before the Fed meeting?
bank shares in Europe are not co-operating so far but you are right this was the plan.
Final thought on Biotech just noted a confluence of two uptrend channels coming together here around 2080 in NBI – s-t uptrend from March this year and the other one from 2011/2012 lows. Lower channel supports at 2650 and 2000.
correction should read 3080 in NBI
yep, IBB is short term very over extended. I also like one old school metric -OBV, on balance volume- this is from the times when people used to think it was all about the volume 🙂 Per OBV metric, IBB is extended beyond its 2010 levels, i.e. the $70s 🙂 Man, i really do think that few years from now we will look at this insanity and will ask ourselves: what were these people thinking, lol.
I would recommend that this discussion board does not become one where people’s egos are distorting the information available. If you are going to give information in terms of trading, I would like to see specifics and reasoning behind it so that something can be learnt. It is entirely useless to for example share “buy xxx and sit back and retire”, whether that call is right or wrong. Nicolas above is a recent example but there are others. He doesn’t have the tools to deal with his activity, because above you will see that he feels upset about someone pointing out that his Amazon call was very wrong. The person that pointed it out also is lacking something in themselves when pointing that out, unless he or she shares something useful at the same time. Nicolas feels attacked and a need to be right, hence the comments above.
Anyone that trades markets will win and lose – every day/week/year. There is no shame in this, there is nothing unusual in this. There is nothing to be upset about. No one can win every time. If we are here to share information, or learn about others’ methods and what they know or think they know, we have to have an open mind. If people cannot even put their ego in the box for the few minutes they spend on this website each day, then I suggest they think about that and their motivations for doing what they do and acting like they do.
I always end up feeling sorry for people who cannot allow themselves the opportunity to learn something. This is not due to the fact that they are bad people, they are a product of their environment. Perhaps their father taught them that being right was more important than anything else. Perhaps they were ridiculed when they got things “wrong” and now a need persists to be right, even when this is a meaningless exercise. We have to help people like that, and that is why I lastly recommend that we do not encourage others to leave. These people have to learn from someone, anyone….
all imho ofc.
J
Brilliant post – thanks
Seconded. Trolling is not winning. Even if it is occasionally amusing.
Thank You Dr. Sigmund Fraud for you insight. Nick is the one that was slamming
banned by Elvis on a constant basis. if he can’t take the heat then tell him not to be so rude
I believe that’s what he did, in a polite way.
What I don’t think Nick (and others of his ilk) realize is that by engaging in his sort of behavior he loses respect and credibility. He is put in the bin of amateurs, immature actors, who are suspect (i.e., likely not investing at all) and not worth paying attention to and subject to ridicule. That may come across as harsh but at least for me I don’t have the time to waste reading silly posts.
Again Thank You Dr. Sigmund FRAUD.
I know I keep saying it but something is not right here. The MACD on the 60 min charts of the major indices have been unable to to give + crosses for nearly a week in the case of the SPX, even with todays move.
I still say we are going down HARD very soon.
Trannies at new all time high.
hmmm… at this mornings highs many stocks and indexes finally hit their first important resistance based on the tools i use…. we shall see
TY Slater
This may be the start of a short position here. The SPX broke below the recent uptrend support line and has backtested three times on the 60 Min and can’t get back inside… For now…. MACD is confirming weakness.
Obviously we would be setting up a huge H&S pattern with the bottom way down in the 1600s .. targeting the June 2013 congestion area. Or a this turns into a big Mega Phone pattern here and we are targeting the low 1700s which is the January 2014 congestion area.
If the Mega Phone plays we could be at 1720s ( Mega Phone support ) by November 20th … Next big Bradley turn date, then we could be looking at SPX 2150 by June 2015 ( Bradley turn date )… then a move down into the next Major Bradley turn date for 2015 with a support area in the low 1300s by November of 2015 ( this would test the May 2012 and March 2008 support area) with an eventual bottoming happening in November 2016 at SPX 1000.. Testing the September 2011 and August 2004 Lows.
If the H&S pattern plays out … and we hit the SPX low 1600s by November 20th ( Wave 3 ), then a bounce back to mid 1800s ( Fib 50% ) and a Wave 4 with a Wave 5 down to the mid 1500s and test of the 2000 and 2007 Tops. This can happen rather soon by January.
Both of these setups are viable for me…
There is one other Option that I have been looking at … and that is that we are in a Secular Bear Market that is going to run a little longer than its usual 17 to 19 year time frame… Due to the unprecedented Central Bank Liquidity. Simple Mean Reversion would say that the Markets are so overly stretched for only one reason and there is no way the Market can enter a new Secular Bull Market until it has worked off the excess.
In this scenario the Mega Phone pattern plays out but instead of hitting SPX 2150 area in June 2015 we only get to SPX 2050 area … this would be resistance stretching back to the 2007 top through SPX 2019. The bottom of the Mega Phone is actually an intersection of the above Mega Phone scenario and the Bottoms of the 2009 , 2002 Mega Phone we all know about. This scenario will get us to the SPX 500 area around Sept / Oct 2018 ( always a good time of the year to Bottom LOL )
At this area all the craziness will have been flushed out, the DOW would be at the bottom support dating back to 1900 … all the excesses will have been washed away… the PE will surely be under 10 … The Dow / Gold ratio will be at least 1:1 in not 1:2 – which has signaled other major market turns 1932 and 1980 setups for major Secular Bull Markets.
Anyways , looks like we roll side ways till 2pm tomorrow. LOL
Brian, thank you, this is very interesting. I posted my thesis above regarding the CBs of the world getting out of the corner of market support. IMO, it will be a two stage process, first- the removal of QEs, second- gradual increase of the cost of money. These two legs will take a long time, IMO, and the first one- removal of QE- is about to begin (the reason for that is the confirmation of the European bank passing the stress tests, with US stress tests already being completed). So QE is about to end. But the removal of ZIRP will take time. Therefore my personal opinion is that the pain will extended way far in the future and your analysis of 2018 makes total sense to me. Cheers.
In addition, I am also looking at Gold and Miners. During the last down turn both the Markets and Metals moved together, but in the 2000 turn they ran opposite. If We are as some believe moving into a new Secular Bull Market, then Gold is officially dead and from here it just craters. I don’t buy that.
How can Gold and Equities move both up together.. with rising inflation and thus rising interest rates… I don’t see it. In addition – Russia , China and India are acquiring all the Gold in town and then some.
Many here are believers in the Natural Cycles of the Market ( as I am ). We are due for another Monetary Crisis – History shows that. If three countries control the majority of the worlds Gold – what is the inevitable outcome of that ? Wealth officially transfers to those who hold it from those that don’t because of one simple word – TRUST. And all the value of a Currency is backed by Trust. Gold = Trust.
It would be most logical with the Cycles of History that the next Monetary Crisis is the flash point for the downturn in the Market, the rise of Metals ( Gold and Silver ). This time around they could move Up even in a deflationary spiral as they no longer represent a Commodity and much as the Currency they have been for 4000 years.
Brian, I have been a gold believer for a few years and have spent 1000s hours reading and watching gold related commentary as well as studying charts trying to figure out the patterns of the miners and some way to profit from their volatile moves. My conclusion is that gold and silver while they have a storied history as a means of economic exchange may have lost their importance since the important consumers, those under 40 and well educated whether in the West or in the East are enamored with technology and technological innovation and if offered a bit coin or a one ounce coin may chose bitcoin. Further, all the non monetary uses of Ag and Au may be at risk from new materials that mimic their functionality with limited cost of production, graphene for instance as a replacement for silver. Finally, there are some indications that the actual amount of gold and silver available may be much greater than current estimates and extraction costs may be much lower using technology that is not the current standard in the mining industry. Picks and shovels could be replaced with electrolytics that seem sci fi but may actually be developing. There may be a gold silver super cycle once again but I would not treat it as anything else than a trading opportunity. We are entering the age of tech marvels that will make everything cheaper, cleaner, and more functional including the currency systems. There is the chance that Au will be used as a measure of wealth for backing up currencies and that could be bullish but I still see the long term prospects for the gold industry or gold itself as not being a sure thing. I will enter GDXJ if it stabilizes as a trade only but not as long term investment. Plus the miners are known to pay their execs really well and to constantly dilute their shares whenever possible. It is a fascinating industry and I will continue to study it but am not counting on it for profits. The expression is don’t fight the fed and until the fed starts promoting gold as an aspect of monetary policy I see limited upside.
Always controversial and difficult to prove but interventionist antics appear rife in Europe today.
FTSE + .61%, CAC + .39% , DAX + 1.86%
The DAX up today strongly despite yesterdays very bearish reversal, that if had followed through today would have, I believe, been horrendously bearish going forward.
Just my opinion but, the ECB very much alive and proactive on QE.
If that’s true, the bears are fighting a battle that cannot be won.
Hi ! That’s exactly my point. Central banks won’t let the markets go down. They will print and buy stocks officially or secretly on any down move. I don’t want to be rude but this is what I’ve been saying all along and my investment results speak for themselves.
Nic, I work at a bank and if this process of perpetual market support continues, I will quit and will pursue some other career as it seems like the bankers are no longer needed, lol. Whats the use for people like me if the CBs can simply dump all risks on taxpayers? Just happen to think the perennial support of the big daddy is too much of a good thing, and my hope is that the powers that be are clued in. Cheers.
Slim, the thing is if CB’s are doing stuff behind the scenes to keep prices elevated, they are not going to tell us. Move along, nothing to see here… So it’s just speculation (ahem…) as to whether they are or are not. But as Nic said, the results speak for themselves. SPX 3000 anyone?
You certainly were right about GDXJ. By the way, GDXJ is up 1% today and JNUG is actually down (3x leverage). I thought it always had to be up or down in lock step with GDXJ. Shouldn’t be up 3% and not down? I wonder if other leveraged products from Direxion or others don’t work on every trading day.
This is last frantic move before collapse begins. I was considering bullish scenario but this exhaustion move finally resolved my wave count.
No more highs. Next weeks will bring crash. I am fully committed on bear side.
Maybe “they” know it comes soon and want to start it from higher levels so losses are limited. But it will overshoot and make May 2010 or August 2011 like walk in the park. 1929 or at least 1987 are most probable scenarios for this market
Hello Bunell,
What makes you so sure the market will collapse can you add something about your wavecount?
I do agree if the bradley will make it’s turn down again there is a little turn in the graphic end off the month..
Cheers..
Hello Carpediem,
This is my count for ES starting from bottom on Oct 15th.
ES contract is instrument that I consider as best of wave interpretation as it is liquid and trades almost continuously
Please note perfect waveforms that it has formed, with first A leg of correction, retest of lows in B wave and then this unstoppable move in C wave that made almost all bears to cover at great losses. Wave 4 of C itself formed ascending triangle (wedge) and today it bursted with final exhaustive move taking stops in 1970 area. Touching resistance line in perfect way !
If this is correct and that was A-B-C then soon there will be dramatic reversal and next wave of decline should be so frightening that the first leg from Sep 19th would seem to be mild and orderly. Discipline will be required during that move
Best trading all…
1929 wave 2 retrace was 67% and 1937 88% – currently 83%
My volume bullish accumulation charts say we have a little bit left and has not turned down yet. So far it looks likewe have another 15-20 points up left but its hard to tell. All I know is there is some juice left as of end of day today.
Thank you very much Bunell,
Under normal circumstances I agree the only thing that makes me doubt is the manipulation game that centralbankers are doing everything to prevent the market going down.
But I also believe that we have to be close to exhaustion levels so we have to wait and see.
why specifically next week Bunell?
I expect decline starting even before Fed communique tomorrow and rolling faster then first leg of decline (to S&P 1820). That may take 3 weeks or 1 week – I do not know – but I think it will be swift as it was due for too long. It is too late for orderly decline.
Why people are short covering today I don’t know but it happens the same all the time – buying high and selling low…
Exited my shorts and luckily at break even due to some trading in between. I’m no longer fighting the central banks. Not worth it. Good luck to all the shorters here anyway.
i’m Bought half position here ! HALF HEDGES remain in place.
They may want to touch VIX 14 as I wrote on Friday as to form right shoulder in H&S pattern. VIX should find support here.
gone short dow 16977, big rising wedge from recent lows
also closed my long nasdaq from 3861 that allan said I was crazy to take 🙂
This last 40 minutes action sure looks like a ‘blow off top’. Both on the DJIA and the S&P ending diagonals (EW term) have been forming and both are exhibiting ‘throw overs’ (another EW term).
Under ‘NORMAL’ circumstances these provide a violent reversal to the base of the Ending Diagonal. However these are anything BUT ‘normal’ circumstances to please trade with caution.
BTW the Ending Diagonal started at 1927ish on the S&P and 16458 on the DJIA.
Found interesting trading strategy. It consists of three simple steps:
Bullish
1. Only go long during Lunar Edge (F+4 to N+4)
2. Only go long during S. to N. Declinations
3. Only go long when Seasonals (Equity Clock.com for indexes) are up.
Bearish
1. Only go short during non Lunar Edge
2. Only go short during N. to S. Declinations
3. Only go short when Seasonals are down.
With this you are only in market long or short 1/3 of all trading days and the returns are remarkable. Bullish is triple strong, bearish is triple weak. For example, the first six months of 2000 the market was up 5% with high vol. The return with the above technique was 25%, seven trades, no losers. This was based on R2K.
Thank Steve, please tell me which the best site I can find Declinations
http://www.astropro.com/features/tables/cen21ce/mo-dcl-2014.html
Hi Steve. Very interesting post. Please, can you explain how do you trade declinations?
PS. I don’t know what declinations are
LHL,
I’m not Steve S., but there are some sites for free, Google: lunar declination. Also, there are software programs like Solar Fire and others that are very exact and go back to the beginning of time. They are a bit intimidating at first though.
Jordi,
Declination is important, and is important to become knowledgeable about (Google any word that follows and you don’t have a good understanding of astrophysics of, starting with “declination’). Here is a start. The Earth goes around the Sun, although it looks like the Sun travels around the Earth. The path that the earth follows around the Sun is the “ecliptic”. How is the Ecliptic positioned relative to the earth’s equator, above or below or both, and by how much? This path repeats the same every year, where the ecliptic is at the same place above or below the equator (where is the ecliptic relative to the equator on March/September 21 & June 21 and December 21, as expressed in degrees?). Could it be that this is when the earth is mostly aligned, or not aligned, with energy of Sun? Now look at Moon. It too follows a path around the Earth, “Lunar Declination”. How is it positioned relative to the ecliptic, since the Moon follows the earth around the sun, is it tilted to the ecliptic – by how much? What/who is “Rahu” and “Ketu”, and does Steve S. feel they are important? In the in the late 1800’s W.T. Foster made excellent long range weather forecasts utilizing the above information. Also, would any of the above have any electrical or gravitational impact on earth? Finally, and of importance if you get this far, how does Lunar Latitude differ from Lunar Declination? Good luck researching (it is better to learn to fish than to be given same).
SC
Thank a lot SJC
to clarify: You go long only when ALL 3 conditions are in place? In other words, you have to be in the bullish lunar edge AND the declination has to be moving from south to north AND the seasonal calendar has to be bullish. If you have just one of the three or even two of the three, you do not take the trade, you’re in cash, right?
And vice versa for shorts.
That is correct. When ALL 3 conditions are in place the move is very predictable. Yes cash all other times.
Sorry I might have missed something in previous posts. What is the lunar edge and how do you calculate this?
Sounds interesting. It may not change your results but just be careful with the seasonals as I believe they’re using data up to end 2013 (the 20 year seasonal up to 1999 will be different to the 20 years up to end 2013, the latter includes look-forward bias if you’re looking at results within that time period). Ideally one creates running seasonal and optimized lunar edge series (because the lunar edge may also have been optimized using recent data although it’s probably not too biased).
True, I am sure the seasonals will change with years like 2008 or 1929 which can alter the pattern significantly. One thing though that seems to keep the seasonals somewhat stable is reoccuring strength at certain holidays, end of month, tax rally in April, tendency to have most gains in the first month of each quarter, mid month 401K buying, etc..
Hi Steve, this month in october the markets behaved like an inversion. When we had highest North degree on 13th October markets made a low and yesterday having Lowest South degree the markets made new highs. Any thoughts why ?
Volume dismal and clearly declining from Oct 15th. Great short squeeze in RUT but it also may be rejected from bottom of diamond pattern tomorrow.
Tomorrow will be a great day and there is nobody left to buy as “everybody in” and shorts panicked. So we will see…
By the way, the only days that have clear direction according to the above post is 12/21 to 12/24 which is bullish. All other days have Lunar Edge and Declinations cancelling each other out since they are out of sync.
Bunell, get used to short squeezes because this is a perpetual short squeeze with no end in sight. And if we have a few down days you can be sure that the FED will buy stocks, they will never let this market go down again.
I know I may sound stupid but this is the truth.
You are not stupid. This is a game of confidence. It is only stability which would allow power to be retained. I used to believe that Central banker would only come out to support the market with it is broken. I now think that CBs just usher the indices along the way. It is cheaper and cost shared by the bears.
“Reversion to the mean” aka crash now or sooner or later is Wall Street ‘ flashcard to keep bear motivated,. Stay shorted and bears get their pocket cleaned out from time to time. Wall Street also teaches bears to stay short because volume is absent during a rally or some TA indicators aren’t supportive of a rally as it all rally must be perfect.
Wall Street also taught bears to believe the market is expensive because PE10 is sitting at 26+ Well, it was at 45.5 in Dec. 1999 so an expensive market is not an automatic short. Why can’t we go back to PE10 of 45.5?
Let me offer a simple chart to show where we stand… $SPX with an overlay of 320 SMA. You can go back to Year 2000 if you want. The period 2007-2009 is very instructive. Studying the intercourse between price and 320 SMA would suggest that we have yet to top and the second chance is also yet to come. The current rally happened right on cue.
Twitter yesterday now facebook longs getting smashed down 10%, I thought the results looked ok.
Ps my auto short kicked in at 1979
1979 ES or SPX? If ES, congrats, you’re position is green.
typo: “your position”
SPX,
Something just spooked futures but only by a small margin.
Re facebook, looks like many went long and got burnt when the markets making a record recovery from 15th Oct. As I mentioned earlier, I thought the results was good. Maybe for facebook It was sell the news.
Wonder if that will be the case for the Feds tomorrow, we will have to wait to see.
Good luck all.
Ahh, this is why.
http://www.zerohedge.com/news/2014-10-28/us-and-canada-there-are-13-facebook-users-every-employed-worker
Thank you John. I truly admire your persistence and patience There is not even one single point on your strong analysis that I could argue against. On the other hand, I admire those who who went long today. In my opinion, the market has been so kind to both bull and bear. Short squeeze today was epic, the largest in 3 years I’ve heard. It was a great opportunity for the bull to collect their profit and get out before the waterfall sell-off. It will be the bear’s turn, shortly
Call me a stubborn bear… I am 100% short, but heavily hedged with XIV. My cycle count is still validated, as Dow has yet reached 17.125 and the corrective cycle count is reaching its final stage. I believe that the corrective rally has reached its peak today. The imminent waterfall sell-off will be as epic. And perhaps this time the bull might not even get a chance to get out.
Great comment Eric – I hope you’re correct .
Thanks P. I have never had more confident in the bear case than this week. I was short back in April, but never saw enough bear evidence piling up are they are now I simply believe that the on risk and reward scale, the risk staying long is just too overwhelmed compared to the reward of staying short.
The rubber band SM has stretched beyond fundamentals in one direction, so the fall is inevitable and imminent. Its a rinse and repeat process. It worked that way before, it works that way now, and it will work that way again. For those who believe in the Fed saving this SM, I think you give the Fed too much power. They can stretch the cycle, but there is no way that they could prevent the calamity from happening, which is the market crash. It is an inevitable result of the weak global economy and deflationary. Falling oil price is an epic example of deflationary. The crash is imminent. I don’t see any other way around.
Personally I can’t see this not reaching the ATH the way it has gone but I expect a quick reversal to the downside at that. Only then would I consider being short. A break to new highs for me would mean no shorting until next year. I refuse to be long in this market as like you it just feels like someone is trying to levitate a market that wants to head down. seems like there is some intervention in the background to try and eliminate bearish indicators with this explosive rally being one!
Krish. Certainly the ATH scenario can’t be ruled out. I think we’ll have the answer real soon, maybe this week after the FOMC. There is some manipulation going on to keep the markets up until the election on 11/4. I think the reversal is imminent though, either this week, or right after the election.
I think a lot of you are very smart obviously, I’d just like to point out one thing- what we expect the market will do has nothing to do with how we trade. While I’m bearish on the outlook of the stock market, I will not enter a single short until I see a confirmation of a lower high. The reason is that, a trader’s fund is limited but opportunities in the markets are not. If my position is countering the market, I”m losing on trading mind and opportunity cost. Also, I think it’s best to stay neutral on any position with both scenarios in mind. It’s just not about being right or wrong, but being on the right side or the wrong side. If I join the right side late, I have money management to up my gains and exit strategy to protect my losses. Good day to Y’all!
Well said Luigi. I think the neutral strategy might be the most reasonable one at this stage of the game. Over the years, I’ve learned that attempting to trade NOT to lose money works a lot better for me than trading to make quick money.
Just an error
thanks john
I just went back to the beginning of the this bull market and confirmed that in terms of duration and points gained this is without doubt the most explosive rally to date out of a bottom.
I have two suspicions:
1 The timming of the rally given US elections next week.
2 The timming of the rally given the ending of POMO.
Certain indicators on daily charts are the most overbought in over 4 years and my final observation is that rallies of this kind occur out of major bottoms and at the end of long term bull markets.
Which one is it now?
Couple the above with the action on the DAX the last two sessions and it is easy to see that interventionism is as strong today as it has ever been and in fact quite likely stronger than it has ever been.
I am at heart a purist and like to think at heart that markets are free of too much intervention. I am unfortunately beginning to see that even after all my years in markets that I am still very naive as well.
It’s not about intervention, but about bias and rifusal to ponder well elaborated opposite arguments or indications, some of which I have presented several times here via links.
theo, the action in the DAX was intervention. The whole market is interventionist, it can’t be denied.
As for the opposite argument, I know the story. I have heard the arguments for why the market either deserves to be higher or at least trading at these levels, but history says the market is wrong.
So am I to beleive that things are different this time?
The ECB bank has recently made it’s intentions quite clear, basically that they would do whatever it took to support the markets.
Spin it anyway you like yesterdays price move in the DAX followed a horrendously bearish move the previous session. It is NO conicidence that the DAX was up 3:1 against the FTSE and 4:1 against the CAC yesterday. They targeted the DAX right out of the gate to avoid any negative print whatsoever.
The DAX was up over 120 pts at the opening bell.
Nobody will convince me that the last week has not been a very well orchestrated intervention…nobody. I have been around way too long and I can tell you that the moves in markets now are not like they were a decde or two ago.
One last thing. I have said for some time now that the markets in general are broken. They have interevened and tampered to such a degree that risk is no longer quantifiable. Bond markets no longer reflect true risk. Stock markets no longer correct for more than a few percentage points beore CB’s hit the panic button.
Investor market approach has been dumbed down because you don’t really need to think too much outside the square when everything is so contrived. The only focus now is the Fed and how much stimulus they are hoing to provide or not provide.
The one thing I am certain about is that it is going to end one day and it is going to end so badly that I am scaree for my children and their children.
Baby Boomers are responsible for the most disgraceful display of greed, selfishness and lack of responsibility to their offspring, not seen since the Roman Empire.
I am actually sickened by it and ashamed that I have been a part of it.
I suspect there was massive intervention to get the market to rally before the Fed’s Wed meeting so if it’s announced QE3 is ending as planned it’ll seem reasonable. Also to cover themselves if things go awry later. Moreover, I wonder whether they’re intervening based on Sornette’s crash prediction model. It doesn’t need to be that accurate, just instigate massive buying when there’s a drop within the predicted time frame.
FWIW, https://www.tradingview.com/v/v2fpy6IR/
Allan, don’t beat yourself (too hard)
Luigi
What does your link and post mean to you?
Thanks everyone, new post is out