
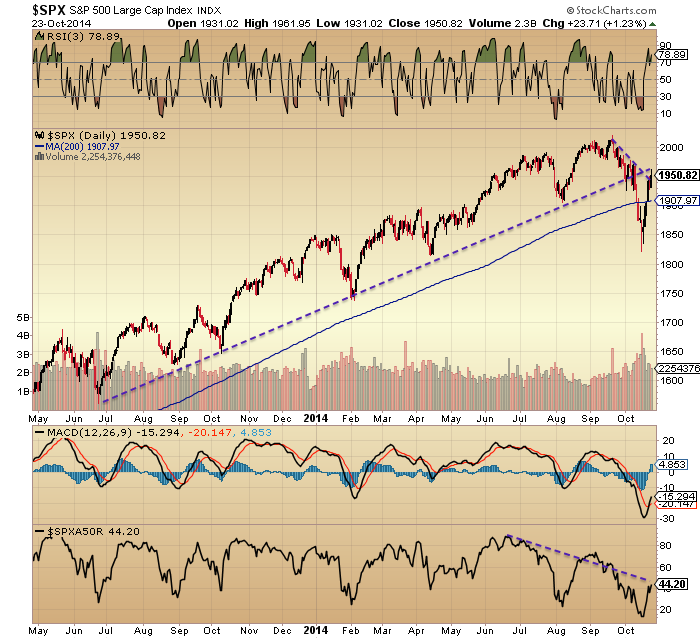
A bullish day but with a weak close and weak after-hours produced a candle with a tail to the upside that could spell a reversal, with new moons often marking tops. The SP500 has rallied back up to the measured decline trend since September and has made a retest of the broken bull trend of the last 18 months, so adds to this being a suitable spot to reverse:
Source: Stockcharts
Additionally it has made a 61.8 fib retracement of the Sept-Oct falls, and this is in keeping with the second chance peak of 1929 which was a 61.8 fib retrace of the initial falls.

Underlying Source: Ritholz
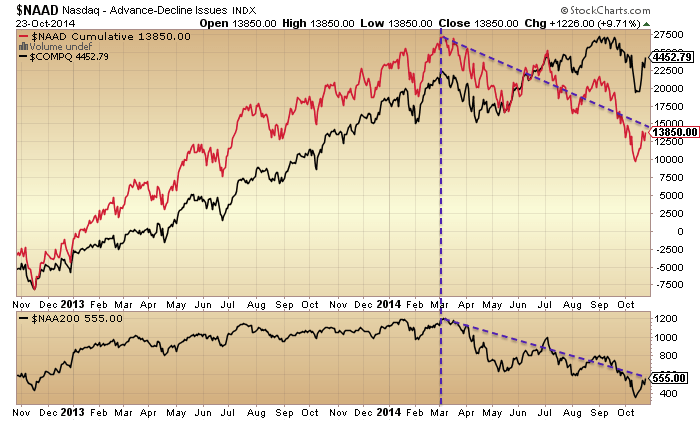
On the flip side, Apple and Biotech broke out to new highs, so we have to allow for an alternative scenario of wider new highs being ahead, unless the markets swiftly reverse here. However, when we look at Nasdaq breadth as a whole we see a continued pattern of weakening with underperformance behind the current rally, which casts doubt on such broader new highs:

The key question is where we are in the topping process. It’s a process that began at the turn of 2014:
By the majority of indicators we are late in the topping process, equivalent to January 2008 or October 2000. So when we look at the selling climax of last week, the most applicable mirror is that from the turn of 2008, the first true leg down in the bear market:

Source: Sentimentrader
If that isn’t our current position, then we would be looking at a catapult to higher highs. Ditto the reading in capitulative breadth that last week hit a ‘bear market bottom’ level. How do we reconcile those with (1) II bears still being at the (toppish) extreme <20%, (2) AAII bull-bear ratio back over 2 despite last week’s sell off, (3) margin debt and net investor credit still being at levels that exceed previous bull market peaks, (4) the average of 5 valuation measures putting us on a par with the 1929 peak as the second biggest mania after 2000, and (5) allocations such as Rydex and Fund Managers still being too high to have sustained a washout?
 Source: Fat-Pitch
I believe we can reconcile if CBI and selling climaxes marked the bottom of the first leg down in a new bear market, because the sentiment, allocations, leverage and valuation indicators have a long way to go yet before they will have mean-reverted.
The wildcard remains the solar maximum, which I believe is the most dominant force in play. It is the reason certain indicators reached all time extremes this year and why speculation once again became of mania proportions. The stamp of previous solar maxima such as Nikkei 1989 and Nasdaq 2000 has been all over this year’s developments. Knowing that the current solar max has comparisons to SC5 which produced a delayed smoothed maximum or that the market resonates with 1929 which was a delayed peak beyond the smoothed maximum, then we have to allow for the possibility of a peak stretching out into 2015. However, this is where the cross-referencing has been powerful…
The most probable scenario by solar models and data is that the smoothed solar maximum is behind us circa March time, and we can cross-reference that with the peaks in the R2K index and margin debt, i.e. it appears speculation did indeed peak then. Generally, indicators reveal a 6-8 month topping process that ended in September, and this timeline fits with previous major peaks. Various indicators aligned already with the solar/market peak in March 2000, not earlier in the process. And through a combination of extremes in leverage, allocations, sentiment and valuations in the face of a demographic headwind, we appear to have reached saturation in the markets, i.e. questionable that there would be fuel to go some way higher yet.
In essence, if we remove the solar maximum from the equation then we have a strong case for a topping process in equities that initially began 31 Dec 2013, had an epicentre around March, and completed by September. If we now add the solar cycle back in with most models pointing to a smoothed solar max behind us around March, then this looks doubly compelling versus the chance of a market peak delayed until 2015. But, if I am to be proved correct, then equities have to now turn down again and not reach back up to new highs.
Year to date sector performance still looks like a trademark market peak. These are the two sectors that perform the best once the market tops out:

Earnings growth for Q3 currently stands at 5.5%. This needs to be over 10% to justify valuations. Don’t take my word for it: analysts projections for this quarter at the turn of 2014 were 13% growth, but the reality means they were gradually reduced to 5% as the year progressed, so now in fact we have a little ‘beat’. I just don’t believe that is enough to propel equities higher, but rather, the gap between valuations and reality has been a flag for 2 years now and with three failure quarters out of three so far in 2014 that gap is at its biggest yet. Hence I believe the repair in price is now underway and we are in a bear market.
The Sornette bubble end flag still shows as July for the SP500 and September for Technology. There has been no move back up with the recent rally.

Source: Financial Crisis Observatory
The European indices are bearish, unless the Dax can break back upwards here. Rather it appears the ideal place for a reversal back downwards, along with the US indices.
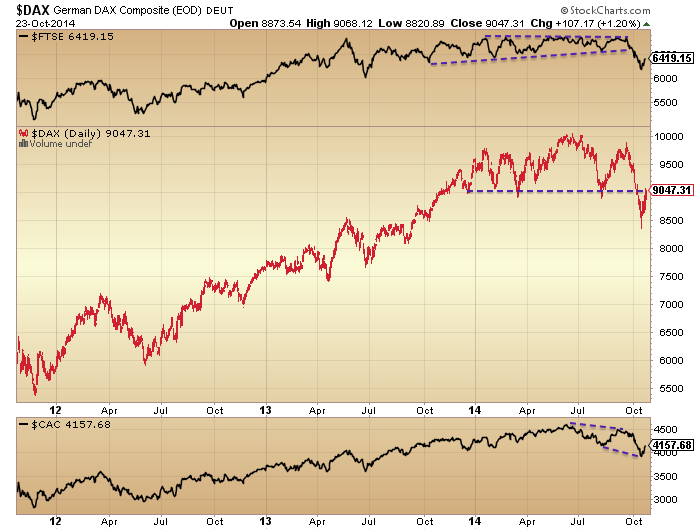
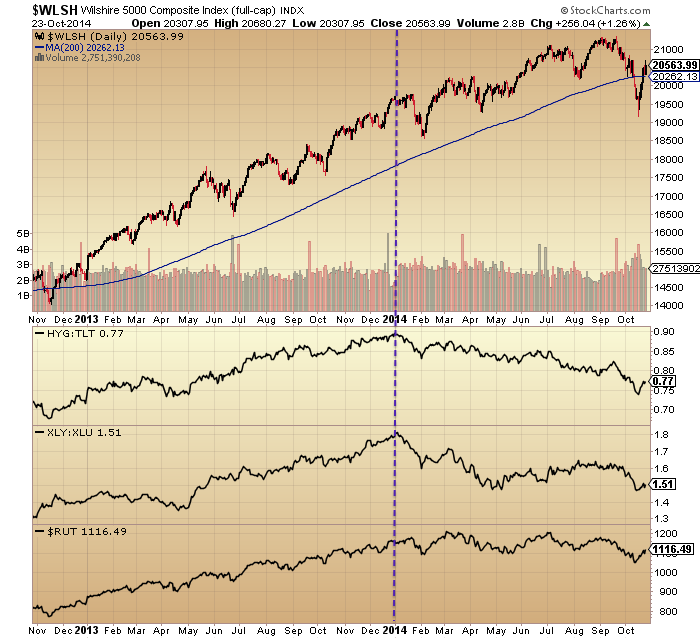
The pattern of a lower high and a lower low since June is fairly clear on the European indices and also on the Russell 2000 and the Bloomberg financial conditions index. What’s missing is a definitive lower high on US large caps, so that is what I am looking for. Uniting all the above analysis I believe this has to now occur and that we won’t rally back up to new highs. With the new moon now behind us and stocks arriving overbought and on negative divergences at suitable technical levels for a reversal I expect stocks to reverse back down to last week’s lows. Once that occurs we can judge whether there is evidence of capitulation again and also of positive divergences. I believe there won’t be and that will be the trigger for the markets to then cascade lower. But first things first, let’s see if equities are repelled from yesterday’s peak.

Thanks again John for the clear analysis.
I would call this next leg down the “Ebola Reversal” which will start on the next open. The folks in NYC are likely starting to freak out already.
thanks john, can u explain how these analysts can get away with lowering earnings estimates so they can still be beaten and then the market just goes along with it. and then rallies. i thought mr market was intelligent. or ist it just sentiment?
It’s a lack of realism that stems from people expecting the economy and hence earnings to recover normally like in the past, but the difference this time is demographics. Plus, the bidding up of price despite earnings the last 18 months is the run into the solar max: traders, analysts and the financial media all ‘justifying’ the excesses. The picture is clear in valuations.
European Bank Stress Tests I believe come out Sunday…could be an interesting day.
Thanks again John
John –
Are you still 100% short and adding? I know bullish strength has surprised you and many on this site, but what is your current feeling? Still short or cash? I know you wont go long…
Next week should be interesting, stress tests, more earnings, GDP and ahh yes, the Fed. We are almost through the bearish timeframe you have eluded too, then will be coming into the Santa rally time of year. I am also curious if there is a value of S&P500 and/or timeframe you are looking to step aside if we don’t break downward very soon.
Thanks again for your all you in-depth analysis and commentary.
“Moreover, according to research conducted by analyst Paul Kedrosky, since 1960, the average annual return on the S&P 500 was greatest when earnings were falling at a clip of 10 percent or more … while the smallest returns on the S&P 500 occurred when earnings were growing at up to 10 percent per annum!”
“In other words, rising corporate earnings does not guarantee rising stock prices, by any means. Nor do falling corporate earnings guarantee falling stock prices!”
http://www.swingtradingdaily.com/2014/10/22/the-most-ruinous-mistakes-that-investors-make/#sthash.HYIvIPT6.dpuf
The primary driver behind this sort of apparent irrationality is “just sentiment”.
Or, Mark, it is that the market is a discounting mechanism, and anticipates that when earnings are falling they will reverse upwards and vice-versa. Today markets are anticipating earnings and the economy will continue to strengthen, i.e., a normal recovery. That combined with an extremely low discount rate due to ZIRP can rationally explain current valuations.
The key is whether in fact earnings and the economy will in fact continue to grow. John is making the case that due to demographics the recovery won’t be a typical one. I think this is the basic fulcrum point between bulls and bears.
Gary,
You are forgetting that QE 3 ends this month.
Joe, I’m not forgetting that at all. If the ending of QE3 results in higher rates, then that should be reflected in lower equity valuations, ceteris paribus. So far the market doesn’t believe it will.
I think the major point I’m trying to make is there is a rational case to make for the market being where it is. (I happen to think PMs like Leon Cooperman are rational beings.) It doesn’t mean I agree – I can understand and appreciate John’s disagreement with them for the reasons he’s explained. But there is a logic to their argument that I respect.
I wouldn’t want to take issue with what you say Gary, but I would question a few things. Why do we humans feel we need to “rationally explain” everything?
We are addicted to measuring and pidgeon-holing everything. Give me half an hour in your house with a tape measure and I’ll easily be able to build you an exact replica. But try doing that with something natural or creative, like a hedgerow or beach or cloud or Picaasso or financial market, and it won’t work. By concentrating exclusively on charts, hundreds of indicators, historical analogs etc we are focussing solely on the past and effectively driving in the rear-view mirror. Keep doing that and a trader will be wiped out when something new inevitably comes along.
In anticipating and discounting the future, as you point out above, the markets are doing much the opposite of what most humans love to do – and its no coincidence that a similar proportion of humans lose money in the markets.
Just look at the sheer number of people who calculated with apparent certainty that there are two options for the future of the US stock markets (and two options only):
Option 1 – crash now
Option 2 – crash very soon
Bill McBride on Calculated Risk is an astute commentator regarding things economic. He agrees with you about ending QE not affecting rates:
http://www.calculatedriskblog.com/2014/10/a-few-comments-on-qe.html
Mark, it’s not easy for guys to understand what did you say, but it’s much easier for guys to understand what did John say. People need to know “why”. If they can’t figure it out, they need someone else to tell them “why”.
Actually, the market rising during a decline in earnings is easily explainable, and shows the importance of credit cycle analysis. When earnings are falling the FED starts putting money into the economy to help it recover. Demand is already falling, so where does the money go, financial investments. So bonds rise and so does the stock market. Bernanke even wrote an article about it, The Monetary Accelerator Model. The market falls when earnings are strong because the business demand for money is trumping the financial demand assets. Here at the peak of a huge business cycle (2000 onward), the business demand is relatively low and the the amount of money pumped in could only go to stocks and bonds. Lower commodity prices also fits this scenario. So the discounting theory of the market looks real but it is really the supply/demand of business/financial assets. Usually the FED starts tightening too late, and keeps rates low too long causing some lead and lag times. The only big exception to this model is the deflation of 1930-2. I think the latter is the bear case now.
Mark! Over 80% of Investors Intelligence letter writers are outright bullish or bullish expecting a correction.
John thanks again for such clarity of thought behind the evidence. I’ll admit that this rally has me rattled….scratch that ‘HAD me rattled’ past tense, after I read this piece of yours.
If we do go higher from here then I’m checking myself in as a mental case. Lol.
John,
Thanks again for a great post – very helpful. 🙂 I think it is possible that SPX may have a shot at 1973 ( as the last stop ) JMHO Otherwise its the exit
Another great note from Dr. Steenbarger:
http://traderfeed.blogspot.com/2014/10/what-is-different-about-this-market.html
Mark,
In reference to your comment about why humans need to rationally explain everything, I’ll leave that to the philosophers. What I look for is whether the folks on the opposite side of the trade have a rational explanation for their position. I can’t operate any other way.
Parenthetically, this is also why I commend John’s writings: he does take the time to examine the arguments of those who have opposing views to his and logically breaks those down so one can see/understand where the differences lie. The great majority of market participants, in my opinion, spend too little time performing this valuable exercise.
One final comment and then I’ll finish up this little rant, but inherently embedded in the examination is an evaluation how market participants are positioned. It’s ALWAYS about expectations, and if you have a handle on that, you are far ahead of most others.
OK Gary, what’s the market going to do today then? 🙂
What is more important is what OTHERS think the market is going to do 🙂
Gary, I would largely agree with the points you make.
Bear markets occur with the turning of the business cycle,
the only exception I can think of is ’87.
The FED has the ability to alter business cycles,
it cannot however abolish them.
ZIRP has hugely increased the need for yield,
but at these levels markets also require earnings
to develop about in line.
There are the beginnings of stock de-ratings on the
back of slowing EM and Euro area growth – ULVR, BATS,
RR. are recent UK listed examples.
John’s waterfall declines can still happen in the context of
a bull market, an 18% (John’s Minimum) fall from ATH still qualifies
as a technical correction.
I can see seeds of the next bear market, this is now becoming
easier to envisage with slowing global growth rates, timing
this is very difficult.
Bot TVIX//uVXY at the open. As per the 29 analogue a few days slightly down accelerating downward from mid week. First week of November should be horrendous.
PS Sure glad I didn’t go long AMZN
First move will be fakeout move today
The current solar flux spike is the second largest of cycle 24. Most likely due to the huge spot 2192. Does this explain the v shaped rebound? If so, as it peaks, perhaps so will short term positive sentiment.
http://www.wm7d.net/hamradio/solar/index.shtml
10 year tanking.
yes Nicholas not here he must be nursing heavy losses on hi amazon position. he got way too cocky in his trading, the market will always hammer u when u think its so easy to make money
Don’t knock the guy too much. He’s a good contra-indicator!
That’s it folks. Intraday charts are looking bearish for the rest of today. TVIX/UVXY charts could not have unfolded any more perfectly.
Yesyerdays higher lows on higher SPX highs was exactly what I was hoping for.
http://stockcharts.com/h-sc/ui?s=TVIX&p=D&b=5&g=0&id=p86898740315
I assume you don’t feel we will hit 1980 anymore?
Can’t see it seren.
US median new home prices down 9.7% year on year!!! Deflation in real estate and stocks has finally arrived. Reality sets in.
will be like 2008 with no place to hide for the crowd – house prices, stocks, commodities all falling together – expect commodities to bottom first – $ cash, T bonds, Yen only places to hide. Expect brokerages to fail again as well so at some stage have to watch for counter party risk.
This is one difficult and frustrating market. Got stopped out of my short early this AM and tried again later in the morning only to have the market reverse sharply from its lows within minutes and out again. Monday is supposed to be a negative day next week but the selling should have started yesterday and accelerated instead of rallying back each time so quickly.
Maybe just like the decline from Oct 8 where it did not really offer any significant rally on closing day basis (other than brief intraday on Oct 13), possibly this rally from the Oct 15 bottom will not offer any significant pullback either?
Could it be the tag team of sunspot up tick, mercury retro, and new moon strength? If all of these disappear starting with new moon effect evaporating next Monday, retro leaving 10/24, and sun calming cyclically. Hold the shorts until after the 11/4 mid term elections. Go long the Tuesday before US thanksgiving 11/25 to Tuesday 12/2. Jay Kaeppel of Optionetics who is a wizard of statistical analysis points out in his latest article that the mid term fourth quarter has a 90% success rate of + returns with an average of 7% for the last 20 cycles.
I also got de shorted by an unexpected strength in the QQQ. I was sure the rapidly approaching S. Declination would pull down the markets. I got to give credit to Nicolas for his recent calls. It probably helped that the ECB economic summit happened yesterday and today.
there are various short-mid term cycles pointing to a low next week 28.10 / 30.10 corresponding with a lunar south declination low on the 28.10 and a Nov 10th High corresponding exactly with a lunar north declination top.
Looking back there was +- 16/17 days cycles forming the highs on 03.09/19.09/09.10/23.10 today ??? / 10.11 next possible high if we go lower. The lows came in a +- 13 days cycles recently on 15.09/02.10/15.10/ next possible 28-30.10 when also the FOMC meetings will take place. It’s well possible that just go sideways here and charge new buying power for the next highs in early November around the 10th.
Wish you all a nice weekend and thank you for all your contributions.
Joseph
despite this one massive sun spot which is producing flares and perhaps responsible for this last gasp of mania (Biotech) overall sunspots # are receding
http://www.raben.com/maps/
This raben site is very useful for checking sunspot activity on the far side of the sun, but it tells very little about whether sunspot numbers are receding, increasing or static.
Counting visible sunspots is a somewhat arbitrary exercise anyway, due to arguments about telescope resolution and the emphasis on the number of regions etc. The smoothed sunspot number is even more arbitrary, being purely an artificial way of rounding the volatile monthly numbers.
A more realistic and effective measurement, in my opinion, is to calculate the effect that current sunspot numbers have on us through their effect on earth’s ionosphere. Here’s an attempt to do that: http://www.nwra.com/spawx/ssne-year.html
By that measure, there’s been no let up in SC24 sunspot effect yet.
The eclipse yesterday was beautiful. Yes, this huge sunspot is definitely showing the sun is in play. Charles Nenner on UsaWatchDog youtube has a cogent summary of current geopol and econ conditions. Uber bearish until 2019 esp the years 2018 and 2019. Not to mention he thinks there will be years of deflation. Contrary to Nicolas’ opinion he is buying GLD right now.
I thought SPX 1980 is unimaginable but it looks it will be tested next week.
Closed half of shorts
Steve T & Bunell. I agree and at the same time disagree with your read. My take is that today should be up to complete the impulse wave 2 spike as the divergences are building up. Monday 10/27 is crucial for my cycle count, because the market should/must be decisively down. I will do a recount on Monday is the markets keep chugging higher. My cycle for wave 2 has 10/28 Tuesday as a max cycle.
Not sure about SPX hitting 1980 again. If the 1980 resistance is violated, that would largely jeopardize the crash scenario.
btw, my EW counts would be invalidated if the Dow goes over 17,125 and SPX goes over 1985; or if this corrective rally stretches beyond thursday of next week. we are currently on day 7 of the rally. Cycle count for this phase is between 2-11 days.
Just imho.
Despite this strength I still think we have a lower close. the 60m chart has issues.
On another note, I think miners are in serious trouble. Bull might be sucked in for one last time before the real capitulation phase. Hate to say this since I invested heavily in PMs in the past. But gold/miners counts just don’t look good right now.
At least there is one thing that Nicholas could be right 🙂
New recovery high today invalidates possible 15 min SPX potential H/S top. I became suspicious this AM on dip. Now appears to be forming megaphone with target of 1975-80 by Mon. This is also bottom of violated wedge and may provide “kiss of death” to rally and would complete Calderos B wave rally.
Nice insight! Thank you.
I reviewed the fractal from spring 2014 once again and the analogy is still tracking but only I am not interpreting the day count accurately enough because back in the spring there were 3 low days consecutively whereas in Oct there were only two low days at the correction bottom before reversal. Also the temporary one or two day counter moves did not really occur during the decline.
But I think I nailed down the approximate dates to uncanny accuracy and approximate price targets too. Here it goes for SPX (and NDX will be similar only outperform in the bull moves):
Apr 11/14 bottom = Oct 15/16 bottom
Apr 22 interim top (after 5-day surge) = Oct 23 interim top (after 5-day surge)
Apr 23 inside day = Oct 24 (today) inside day
Apr 24 gap up open & big decline = Oct 27 (form top of 3-week upwards sloping channel/wedge)
Apr 28 bottom & reversal = Oct 29 (price just above Oct 20 low possibly ~1885 to form bottom of upwards sloping channel/wedge)
May 2 top = Nov 4 (price near Oct 8 high at either equivalent or higher than Oct 27 high)
May 7 bottom = Nov 7 (higher low than Oct 29)
May 13 top [big rise] = Nov 13 (higher high than May 2)
May 15 bottom = Nov 17 (final washout low before upside acceleration with price around or slightly below Oct 21 high 1938-1940)
May 20 retest of bottom = Nov 20 (final low around 1970 before blast-off to upside for 2.5 weeks)
Of specific interest:
The low on Oct 29 should offer the best entry price wise to go bullish long. It is likely also the last chance to exit any shorts at the most favourable prices relative to the Oct 15 low if that was missed. Prices will still be stuck in an upward biased trading range, so trading in/out of the channel is the best strategy until mid-Nov.
The upside blastoff from mid-Nov will exceed +5% over 13 consecutive TD’s and be almost a non-stop rise daily. The target approaches 2070 by Dec 10 or +130 SPX points from the Nov 17 projected final washout low.
The mid-Nov low offers the best opportunity to ride a big move without any need to trade in/out because the upwards trend will be uber strong with only minor interim dips well into Jan 2015
The three bottoms forming the bottom of the channel are likely the Oct 29, Nov 7, and Nov 17 lows which are equivalent to Apr 28, May 7, and May 15.
The relative price movements both percentage wise and amount are different than in Oct/Nov because the SPX decline in spring 2014 was relatively mild but more pronounced in techie NDX. Also the correction in Oct 2014 was a bit deeper than in the spring and both SPX and NDX declined to similar levels of -10%. So price projections in late Oct to mid-Nov are based on levels achieved in spring 2014 that were relative to prices of critical prior TD’s. Example is Oct 8 high is important and equivalent to Apr 3/4 high and Oct 15 low is also important and equivalent to Apr 11.
Steve T, thanks very much for the detailed info. This will prove very helpful in knowing whether we are on track or the fractal’s failing.
Nice work.
Good summary of your fractal system. This would mean that the broad upward movement in mid Nov would be riding on the wings of the next Lunar Edge which begins November 9.
excellent!! Many thanks for posting this here. It will be great to watch in real time and see how closely the present market tracks your fractal. (I’m posting all these dates on my calendar. 🙂
How do you find these fractals? What criteria do you use to determine that a fractal is in play and is reliable? And the big one: What criteria do you use to determine that the fractal–which may have been working perfectly–has now stopped working and should no longer be relied on?
for example: If today turns out to not be an inside day, would that be enough to determine the fractal is no longer working? Or what if yesterday turns out to have been the top and we don’t get the gap up on Monday, would that tell us that the fractal has stopped working?
The day to day price movement does not have to be exact but the general direction and major tops and bottoms around specific approximate timelines should still be accurate.
Also, say if Monday did not gap up open then that is fine as long as it began a decline into a Wed low. If instead early to mid next week it takes out the Oct 8 high instead of making a low then I would think there has been a paradigm shift and diverged away from the fractal.
Thanks, Steve, for your answers to these questions!
Steve T, This is superb analysis! Looking forward to see how this unfolds. Keep us updated.
Action and pattern in VIX is problematic for the bears. If it does not spring to the upside this afternoon then its H&S pattern would target 14 (Oct 6th bottom).
This may coincide with SPX 1980.
SandP high not matched with vix low. Fear is creeping in again.
http://www.amazon.com/Astro-Cycles-Speculative-Markets-Jensen/dp/0939093111
From the book.
“In the Jupiter-Saturn Rotational Radix the point of wheat is found by subtracting the position of the Sun (at the conjunction moment) from the position of the conjunction and adding the Ascendant. This is a radix point entered and used in much the same manner as Pars Fortuna is used in a natal chart. In the 1901 figure for London this point fell in the second house in conjunction with the Moon at 12 degrees 36’ Cancer and opposing the point of conjunction at 14 degrees 9’ 0’ 18’’ Capricorn. This figure included the period of the War, when wheat shortages were intense. In the 1921 Conjunction (Jupiter-Saturn) at London the point of wheat is in 10 degrees 43’ Leo in conjunction with Neptune and Venus. The point of barley is found by subtracting the place of the Moon from the place of Jupiter and adding the
Ascendant; sugar by subtracting Mercury from Venus and adding ascendant; rye by subtracting Mercury from Saturn and adding ascendant; cotton by subtracting Mercury from Mars and adding ascendant. These ‘points’ are to use for supplemental purposes, however, for though they work in a unique manner the scientific basis for them is not clear. The basis idea was suggested by Pallicus in an unpublished manuscript now in the British Museum.”
DISCUSSION:
Does anyone here understand what Jensen is saying??? I am able to put up the charts he references with my Sirius program; but I’m pretty much at a loss for understanding how to proceed. And I can’t find any reference to a “Pallicus”. Gann is said to spend time at the British Museum library in London.
Thank you for any feedback.
Eclectic,
Jensen & that book are important. I believe he was one of Gann’s astrologers. Jensen’s methods is difficult for me, but based on what little I know it has value. I really don’t know enough of that approach to be of help, however you will need to do a little research on the Arabian Parts of Fortune. I believe Solar Fire calculates same. It is my very humble belief that the astro capability of the individual that uses that methodology must be very advanced. Of course, I should add that my skill level is such that almost any astro method is advanced – so if you have an interest don’t let me through cold water on it. Anything by Jensen is worth pursuing.
Also, there is another another weather analyst besides S. Maxwell to be aware of. Foster was as accurate as Maxwell (about 90%!), but I believe he was active in the late 1880-1890’s. Same approach, but I think more info on his methodology is available. What is interesting in looking at some of the comments that Maxwell made – he sounds like Gann, and they were both active at same time and may have had some of the same acquaintances. The key is that they believed that heavens impacted not only the tides of water, but also tides of air. I will have more on this later, it’s late in Dallas.
SC
All in short. Gulp.
boy, what’s mistake ! You might as well just give the money to a charity. Ok, I’m ready to short more GDX. I lost a little on AMZN today but my QQQ and IBB have been great performers.
Hows that Amazon purchase going nick??
I maintain that the 75MA is never as respected as the 50 or the 200 MA, but this always has been a good line in the sand for many prices.
My bet is today may end with shorts panicking to cover… then Monday down and final burst to 1980. Then the big question.
The market reaction to the ECB bank stress test will be the key. I am watchin.
At the low last week, $NYLOW hit a hit of 600 which was a 3 plus year high. It would be very unusual to see ithe indices roll over so soon. This rally should have leg amid VIX was told to sit down fast.
While it’s on my mind I wanted to thank everyone who provided feedback on the gravity project; posted previously. You insights and explanations were valuable in helping me understand the gist of the entire concept. I have to believe that there were no new ideas to be developed that had not already been covered by Andre’ and others interested in this topic. Tks again, I appreciate your support.
Corporate buying back shares… That typically takes place on Fridays. Could be one of the reasons why the quiet spike is on-going today.
I think the corrective rally is very close to be complete. Just wait for divergences to form in order to confirm my conclusion.
That is possible. For me it is forming ascending wedge pattern in futures.
ES is at 1960, only ten points from 1970 level that was tested on Oct 6th and 9th.
Still I see one more 10-15 point correction before us (Monday ?) and then attempt at SPX 1970-1980. Algos clearly see 1980 as target of “V” pattern from the bottom.
1980 will be very strong barrier and the market moved too fast to break it “on the march”. I expect long wicked candle to form there as confirmation of reversal.
Afterwards it is anybody’s guess if just deep correction or devastating crash follows.
I agree with you Bunell. That 1980 resistance for SPX is key. The bear case would be hugely weakened if the 1985 resistance is broken imho.
i am 100% short.
if you look at the S&P 500 index from 1820 to 1963 on 90min chart the squiggles look a lot like the 1937 second chance squiggles just on a daily chart – just saying
Trying to put together a synchronized fusion of all market effecting natural effectors: LE (lunar edge), S to N to S declinations, A/P cycle (apogee perigee), seasonality yearly modified by decade cycle. I am seeing each one as having statistical value, combining them often they cancel each other ending up with no clear advantage. Although when they are all clicking on same dates price follows. To further complicate there is technical analysis which is totally separate. Some interesting combos:
Buy at apogee (weakness) , sell at end of LE.
Buy only LEs.
Buy only LE with S to N declinations.
Buy only LE with positive seasonalities.
Buy high beta when LE, A/P, S to N, and seasonals are clicking.
Many ways to interact with this.
Guess this blog is the only one on the web where these kind of questions are appreciated. Thank you for reading and happy trading!
Steve S.,
Refresh my memory, Lunar Edge = buy and sell off of the Lunar Phases?
SC
Lunar Edge, market strength full moon plus 3 days to new moon plus 3 days.
still intrigued by 1937 and 1929 corrections – the gradient of decline and recovery in 2014 is so far more akin to the 1929 comparison than the 1937 – recovery we have seen was about 3x the gradient of decline by time and price. 1929 traced out a similar gradient. Would strongly point to a 1929 scenario coming up here.
I have to wonder about these kinds of comparisons because today’s market is so different from any market prior to the year 2000, or maybe even 2005 or 2010. There was no electronic trading from your PC at home prior to what, the late 1980’s, no algo trading, no HFT. It was completely different world. I wonder whether today’s electronic trading, the algo’s, the HFT’s, all contribute to the sharpness of the decline and the rapidity of the move up from the V bottom.
http://www.kitco.com/ind/nichols/2014-10-15-Special-Report-The-64-Month-Pattern-in-Stocks-and-Gold.html
John, I think you will enjoy reading this. Sometimes a different view, but same conclusion is supportive to the effort you have made.
How many of you are still short? I expected a October crash, but with a few days left, it seems unlikely now…
I have long positions that I’m not willing to close, but I am heavily hedged with IWM puts and VIX calls.
Best of luck!
I’m still short, but time is running out on my 10/31 SPX O-T-M puts. A crash starting Monday would be very helpful.
Thanks for the frank reply. I wish you the best. My honest view right now is to extend the maturity and roll the strikes up, not because I have a strong view on the short term, but just to respect risk management to ensure the best chance of killing this beast.
John Li. I am 100% short, more so than last month. I don’t think there will be an October crash, but imv there will be a major correction in Nov/Dec. If the crash scenario is not playing out in 2014, my next target would be March 2015.
Poor Erick, he still dares to dream. You will have to wait until next year Erick, Mid term presidential cycle low will turn into a Santa rally. This market has much more ‘pork the shorts’ left in it.
You might be eating those words in about two weeks daveg / we shall see
– the market is at major turning point. Up or down is the big question.
Imo market down from here until end of Uranus retrograde on 12/13, or at least net no gain, with a modest Xmas rally.
I called the low to be on the 20 Year cycle point Oct 15, before it happened. Stops in place. We are not at a major point, maybe early next year.
It is not a dream daveg. I’ve done my homework, and I am willing to take my chances here. We all just have to wait and see. I wish you luck with your long positions. It is just NOT for me.
Market may not finish much above its current price. This year had four indicators early that indicated a down year:
First five days were down. When first five days are down bearish.
Xmas Rally failed. There was no Xmas rally last year.
January barometer: January finished down.
December low indicator: Dec 13 low violated during the first quarter of 14.
Adding all of these together according to past performances (80% of time), the market should finish year down, or at best meager gains. The SPY is up 6.36% so far so that is probably all it will provide this year. Of course there will be fake out break outs and break downs. I am sorry if this goes against yours or Nicolas’ current positions, but I would only trade based upon seasonals or moon phases for the rest of the year.
Sunspot 2192 unleashed the sixth strongest solar flare of the current solar cycle, a major X3.1 event peaking at 21:40 UTC on Friday evening. Surprisingly, and disappointingly for some, the event looks to have failed to produce a noteworthy CME.
Does no CME mean no market impact?
I thought CME was the acronym for the Chicago Mercantile Exchange :). Maybe it effected the futures market electronic systems. Though without ejecta a solar flare imo will have less effects on the earths electromagnetic fields which I thought was usually negative. When the earths emf is disturbed there is usually market destabilization. Interesting that the sun is displaying excited state which as I recall is what happened at the end of SC 23 where there were some doozy X flares.
Woke up this morning and was gobsmacked to see that the indices closed higher. The 60min and 15 min charts are loaded with negative divergence.
The MACD on the 60m charts of all major indices has all but flat lined and despite numerous instances where price was in danger of heading lower and possibly breaking the 7 day uptrend throughout the afternoon session, they defied the laws of gravity and became suspended in a tight range.
Come Monday the indices will once again be flirting with the uptrend. With final POMO on Tuesday there is nothing more to keep these indces artificially supported.
Unless of course Belgium’s purchases of US bonds continues to miraculously climb.
Thank John for discussing about moon. It easier to trade or invest not based on Fed whim.From the day one, I believe your FED will be successful to boost the economy based on QE. I feeling the West governments tried to learn and apply some techniques from the East to manage theirs society and economies accordingly. That called social and economic experiments. You don’t need to ask other permission to do things. Your guy Obama born in Hawaii, grown up in Indonesia so I see he does things without bothering to ask you or referring to Congress. Just does what ever he likes. Gun, health care, drone attack and eavesdropping. Blame game is also Asian culture advantage. I see him so much identified with Asian culture where never appreciated nomadic way of life. Unfortunately, the first time I red “Asia Gold” by the author Marc Faber and I instantly believed blindly to so called experts in the West in terms of prediction such as 4000$ for gold or 500 SP. Poor me at that time. Now I free from their ideology. They talk non sense, never stopping just like communist propaganda about a socialism heaven on earth but it never come. This world be like hell when the West importing so bad things from the East (yoga actually is a form of worshiping many gods however the good effect of releasing stress just a minor feature ). In turn, the East learning and copying so many worst things from the West. That is globalization. I want to learn the best things form the West (individualism+ Christianity+ humanity+ freedom and liberty+ Entrepreneurship+ nomadic culture) but the more I learn the vague I get. Instead I see so many things actually based on the East and embed and repeated to the West now. That funny. I really shock when some western thinkers call for applying some social and economic experiments done by Mao and Stalin to Western societies. Is that QE kind of economic experiment ? It will be done continuingly for 10 years ? Crazy.
Faber is highly entertaining, however, just like Peter Schiff he has been wrong so far with his predictions of GLD. I guess if GLD does rise then they were just early. I know Nicolas is sure GDX is going lower, but I am ready to get in when it crosses the 20 day MA.
I’m an American and have come to realize that our system (capitalism is primary, “democracy” is secondary) is destined to become more and more a corporatocracy with a widening gulf between the “haves” and the “have-nots” unless we roll back corporate law to where it was when this country was founded. The American Revolution was as much about rejecting corporate rulership as it was about democracy. The founding fathers were very distrustful of corporations. As a result they made sure corporations had very limited powers. Corporations had to renew their charter every five years and one corporation could not own another corporation. (I’m not sure whether there was a corporate shield then or not.)
Over time, the wealthy have managed to change corporate law to what we have today. IMO we need to get rid of the corporate shield. It’s ridiculous that corporations can get away with breaking the law and no one pays for it. The CEO and other corporate officers should pay the fines and/or do jail time. We need to get rid of corporate personhood and disallow one corporation owning another. Until we do this, I believe we’ll continue to see the corporate elites running our government and looting the Treasury to the detriment of most of the US citizenry.
Alexa, in regards to the “64 month cycle” link, John discussed this a few posts back in comparing-stock-market-peaks. The count has been adjusted recently as originally it was suggested the 64 months would be up in about july:
http://www.safehaven.com/article/33230/the-64-month-bubble-pattern
On a sidenote, if one’s into Chris Carolan’s stuff then the 64 months is really 63 months as in:
sqrt(Fib 19)=srqt(4181)= 64.66 moons= 62.74 months= 5.23 years
A 36 year cycle is also mentioned:
sqrt(Fib 27)=sqrt(196418)= 443.19 moons=35.83 years
Just thinking out loud here. If it wasn’t for this solar cycle topping and QEx ending I’d believe that the October correction was just a regular half yearly cycle low and it’s back into bull mode again.
Let’s see what price has to say…..
Jeff
Tbh I do think the Feds will extend QE at 15 billion per month for another 2 months on the hope and a pray Mario will do more in Jan 2015. IMHO a cold day in hell comes to mind.
But the market will be on quarter rations, maybe enough to stop the rot, but no way enough to exceed ATH.
After the cocaine rush of last week I think the reds ( downers) will be administered next week
I have new short set at 1978, and one below at 1899, no limits.
Minor drop on Mon/Tues then on to new all time highs in a blow off move starting on Wednesday after the Fed extends QE or amends language !
you’re right about a blowoff move occurring if Fed extends QE or even hints that it might continue it or even start a new one, QE4. Odds of this happening seem to be low. What makes you think the Fed will extend QE and/or amend their language to move dovish?
Upward bias until three days before 11/15 apogee. Up again until three days before 11/24 S. Declination. Then up until three days before 12/12 apogee. Up again until three days before 12/21 S. Declination. From numerous years, down moves begin three days before apogee and three days before S. Declination. Does the moon own the stock market, or does the stock market invent the moon?
Steve S I’ve been reading your posts with interest on the effect of the moon on the markets. However what you’ve just said can be ‘translated’ to read the markets only go down for a max period of 3 days before they start going up again.
That clearly is not right. Perhaps I’m misunderstanding what you are saying in which case please explain further. Thx.
My new tack is to use the Lunar Edge (LE), Lunar Declination South (LDS), and Lunar Apogee (LA) Lunar Perigee (LP) only focusing on the sweet spot of each. Observed persistent underperformance 3 trade days before LA, and 3 trade days before LDS. This underperformance is almost every month and a few months a year there is a whopper of a price discount during this pair of 3 trade days (this month it was LA on 10/14). By skipping these 6 days per month the equity curve should benefit.
Steve S, How many years have you included in your analysis?
My study is on the RUT going back to 1999. Have finished about 4 years so far and posted the LE, LA, LP, and LDS on chart. Finding consistent LE advantage, LA weakness beginning 3 days before, LDS weakness starting 3 days before. Apparently, apogee perigee and declination can be used with as much predictable value as the Lunar Edge (Full plus three to New plus three).
Ref the 7 year top cycle. I looked at the charts. 7 years ago, the market was topping in year end 2007, same for year end 2000 (S&P) and remarkablly so on back. Ie you are right. The utility avg was close to exact.
Not much time now, but there is something I need to share with you. My forecast last week didn’t work out. And I now understand why; it was the tidal station.
The good news is that I have found a stunning new station in a place you wouldn’t believe. It gives 2 complete cycles – as measured from low to low – within a 27,5 day period. And the pattern is regular over very long periods of time.
The turns correlate much better with declination timing than with apo-/peri timing.
Every tidal station starts with astrological input. And then all sorts of adjustments are made to accommodate for local circumstances. My guess is that on this station the adjustments are practically zero, so it reflects the astrological input almost perfectly. And this was what I was looking for.
This station gave the low 15/16 and a high 22/23. The next low is Wednesday. I think the Friday high was partly a short squeeze and that is not a gravitatiolan effect. Anyway, you can see the market barely made a high high as the gravitational pull is already getting stronger.
I found another station in the same region that supplies the inversions. Friday saw a low tide inversion, providing a bottom for the markets. Monday sees a high tide inversion that will push the market back in the downtrend for the Wednesday low.
What I am working on now is to integrate these 13 day gravitational cycles into longer term gravitational cycles like the 109 day cycle (4 times 27,5, etc).
But it is remarkable that this station very clearly shows a 27,5 day cycle, the same as the declination cycle and the apogee cycle. Timing of the tides lag the declination table 1 or 2 days, which makes sense as the sun also plays a part in gravity.
Another thing is that short term the moon goes out of bounds, meaning the negative declination of the moon exceeds the negative declination of the sun. Thursday it comes back within the solar limit.
This timing coincides nicely with the tidal inversion on Monday and the low on Wednesday.
Hope I’ll have more time next week and have some more on the connection with multi month cycles.
Cheers,
Andre
Andre once again thanks very much for sharing. Very interesting and hopefully rewarding work here emerging.
Thank you for sharing this information Andre I m very curious what will happen after the Okt 29..
Because In my eyes this rally is pure speculation that the fed will do something on Okt 29..
I also have my eyes on the bradley because the turningpoint Okt 15/16 was spot on again … but the question is will it make an inversion because next turning is November 20/22
Mercurius was retograde till Okt 25 so it is possible that the market will turn this monday…. Europe was all ready lower on friday…
October 20th we started a new 109 day cycle. The first one was down, so the second may be up. The low oct 16th came a few days early, indicating the markets wants to recover. So one scenario certainly is a retracement into next year before the next 109 turns south again. Every 27,5 day cycle within the 109 will mark a turn, but it is impossible to say at this point if is will be a high or a low. But watch these dates like the Bradleys.
Hi Carpediem, indeed Raymon Merriman found out that there is a high influence and primary importance of turning the previous trend when Mercury goes indirect or direct again. Expected short term bounce back of around 4 %.
Interesting stuff Andre. If what you are looking at pan’s out you may have found an explanation for some of the stuff Bressert was working on back in the day.
Thanks Andre
Hang in there Andre….
Sorry Robbie, just ignore me.
For the rest: about the 109 day cycle.
From the 2003 feb low to the juli/aug 2007 high was 15 (3*5) 109 day cycles
From the 2007 high to the 2009 low was 6 (2*3) 109 day cycles.
From the 2009 low to the august 2014 high was 15 109 day cycles.
From the juli 2014 top to the 16 oct low was 105 days (= almost 109).
15+6=21. 3 times 21 109 day cycles =18,8 year (= 18,65). 3 times 18.8 year is the 56 year cycle. So the 9 year cycle isn’t a real cycle; it’s just the midpoint of the 18,8 year cycle. Counting 109’s makes much more sense. And 109 is 4 times 27,5; a cycle we see everywhere.
The tidal cycles are fully synchronous with this 109 day cycle structure.
So what’s next? If the market moves in a 15/6 structure (15 with the trend and 6 against), we have started a 6 cycle period down; starting early july 2014 and heading for an april 17th 2016 low, implying the 18,8 year cycle is still up.
If we have started a new15 cycle period (implying the overall 18,8 year cycle has turned), we are heading for a low on December 24th 2018.
This all looks to good to be true. But only when I started analyzing with the 109 day cycle, I found this 15/6 structure. Since 2003 it worked great.
Whatever you think, you can’t deny the amazing harmonic structure I presented.
Cheers.
P.s. Last post this day; in respect of Robbie 😉
Just thought of this. Hurst said cycle distance is 1:2 or 1:3. 6:15=1:2,5. So I think Hurst saw the 1:2,5 ratio but didn’t know it. He looked for round numbers so sometimes the 2,5 became 2 and sometimes 3.
Andre’,
The 18.8 year cycle is interesting. I’m not in a place where I can confirm, but I believe that the Jupiter-Saturn synodic cycle is 18.8 years. Gann viewed the ~20 year cycle as key, your comments on the Metonic cycle reinforce that. Below the surface of your other work I believe that you have been looking for a tie in to longer term astro cycles. Ju-Sa may be a step in that direction, being one of the outer wheels, complimented by your work on inner wheels.
Also, 109 days certainly aligns some of the short term lunar cycles, but not lunar phases.
SC
Steve,
I’m convinced 109 day cycles are the building blocks of the market and it always seems to go in steps of 3. So 3 times 109 must be a cycle. So the question is : is it always 15/6 or could it be 9/12 as well? Looking into that now. But mathematically it is impossible to get such a crisp timing over time periods of 10 years or longer, with some 40 subcycles if the 109 day was off by half a day. The timing is stunning, so 109 day must be the cycle. And my new tides are also 100% synchronous.
To day realized the danger of analyzing only the moon. Gravity is moon and sun. Declination timing is off by 3 or 4 days; that must be the sun.
Cheers,
André
Thanks Andre’, your posts are the wind beneath my wings.
Too kind….
Keep up the good work I like it
Could you give a glimpse what happenss in your tidal vission after okt 29
I have a short one day rally and after that down.. into the Nov 6 and later Nov 20
Carpediem,
My tides say a high nov 5th, then a low nov 12th and a high again nov 19th. The overall trend I have to work on this week. The 109 day market structure is new. I just know this is a major step in analyzing the market. But I need to do some study on it.
But it is very clear the ’15 cycle’ ended in August. And now it’s 6 or 15 109d cycles down, if this structure is reliable. My gut feeling is that the 6/15 ratio is extreme and maybe only seen in steep bullmarkets. the 21 structure seems firm and ties into the 18.8 year/56year cycle structure. But maybe 9/12 is an alternative for the market, or even 10/11. Periods longer than 15 are hard to imagine. So 6 could be the minimum for a cycle. And that will bring us down into april 2016 as explained before. This fits nicely with everything John has posted. Big question : 6 or 15. From this we can deduct what the 56 year cycle is doing.
Thanks Andre that is a lot…I m looking forward how thinks will develop
So I will keep my shorts till okt 29 and watch the fed-rally
But the way I read your forcast the waterfall decline will not be in the cards?
A waterfall decline? The declination inversion suggests October was an important month for a low. This fits into the scenario the short term trend is up until end of January 2015. The longer term apo-/peri cycles are also still up into December.
I don’t say new ath’s, but up. A more serious decline would then come early 2015.
But I really need to think about how this 6*109 day cycle works. So no definite expectations yet. I hope next week – if Robbie and Phil allow- I can shed some more light on this.
Looks like we have the proverbial irresistible force meeting the immovable object.
We have read John’s many analyses and illustrations which eloquent state the bear case. Another arrow in the quiver for the bears is the Dow Theory; as someone pointed out in an earlier commentary.
Click to access 101914-Dow-Theory-Update.pdf
Or, will the Feds continue to be successful in manipulating and levitating the market upwards in bubble fashion? That bullish case is shown in the following link by PUG; which was also posted in an earlier commentary.
http://pugsma.wordpress.com/
A lot is at stake around current market levels.
andre, just give it a rest, or start your own blog
Andre’,
Don’t give it a rest. You always provide actionable information. Fortunately others are unable to see.
SC
Actionable information that is invariably incorrect,
then every week there is some “new” discovery
which will suddenly explain everything from now on.
It’s utterly risible.
I agree, start your own blog, instead of insulting
peoples intelligence.
Oh my, touched your nerve I see! I have found actionable information that I find profitable. As an extra bonus, bits and pieces are being put together in a nice model. Too bad you can’t see, but that is good for those that can. Actually, I think that pimaCanyon, and Eddie, below has a very good suggestion that you might find useful. However, it is touching to know that you are concerned that others might read information that is not sufficiently valuable as you see it. (This is too easy).
Thank you John!!! This is an excellent blog.
Geez… what’s up with all these bitchin’?
A lot of people here give their forcasts/predictions.
and as you know, they are never “correct”. But it’s good
to know what other people think. Also, I can get different
scenarios. That’s even better.
Ask yourselves why you are here. Did you think you can
get free lunch here? You don’t like what people are saying?
Then do your own research and connect the dots.
OR if you don’t like what you read then MOVE ON!
A beaver cuts down a tree by a million bites around the tree, each one insignificant, but combined decisive. Esoteric stock market knowledge is like wiping off a clouded mirror, the more passes across the surface the better the reflection. Each of the systems presented makes the image more clear.
The problem is many are using an oily rag.
Oil is the plumber’s secret. It dissolves almost anything.
This isn’t a home maintenance website but I used oil to clean anything that is especially recalcitrant (stains, scum on tile or ceramic, etc.). Plumbers use cooking oil to remove clogs just pour cooking oil down the drain, wait an hour, and voila the clog is dissolved.
I happen to love not only reading about André’s discoveries, but also love his enthusiasm! So keep those posts coming André.
For those who don’t, the solution is simple: At the top of every post just to the left of the text, there is the NAME of the person making the post. So those of you who don’t like Andre’s post, when you see “André” to the left of the text, THAT’S A SIGNAL FOR YOU. That’s your SIGNAL to SKIP THAT POST. Yes, skip it, don’t read it, just go down to the next post and continue reading there. So let’s review: André to the left of the text is YOUR SIGNAL to SKIP THAT POST. It’s a very simple system, right? Even a child could do it, right? So just follow those signals and you’ll do fine.
And that’s one signal that works 100% of the time. It’s a SURE THING!! Lol.
🙂
Andre’,
I would like to your comments on factors/multiples of 3 by pointing out that phi=3.141592…., which obviously holds an esteemed position in Sacred Geometry. I think you will find that your work begins to take you to some of those directions, and I will post a few research materials that might be helpful when I can get to my books in about a week.
SC
And that 1,000 days * 3.1415…= 3,14..6 days & / by 365.25 days = 8.6 years. hum
Steve, appreciated. From a fractal dimension point of view PI is certainly interesting. But you know how it works; first the big steps and then the fine tuning.
Thanks for your support; 2 heads always know more than one 😉
“I would like to your comments on factors/multiples of 3 by pointing out that phi=3.141592….,”
SJC – actually…
Phi (Greek letter Φ, expresses the value of the golden ratio) = 1.618…
On the other hand, Pi (Greek letter π, is the ratio of a circle’s circumference to its diameter) = 3.14159…
William Wiser,
You are 100% correct, of course. When I was writing that, I suspected that I got it switched. It is one of those things that I have never been able to keep straight. Phi, pi, pho, phum,… 🙂
SC
Thank guys for enlighten me about moon, Pi, solar…May I introduce you an alternative way of trading. It not tell you short or long but you should trade for this day. Every 7th day of month usually a bottom or top swings for Sp500.So July 7 often the best entry for the whole year. 7 is sacred number from Christianity or Judaism. It might relate to NFPs. According to some research, you just long after 1 week releasing NFP, not regarding the number being good or not, you would a get good return
and of course the 7- year cycle of Joseph. Combined with your moon and solar, it could reveal something ?
Last but not least, Linda Raschke Bradford found out that if close prices above or below 5SMA for 7 consecutive days, the market would be very bullish or bearish.Just long or short accordingly
Last time, Sp down much but just closed bellow 5SMA for 6 days consecutively. That why SP500 have rallied much. Now in turn, it has got 6 days above 5SMA. If Monday the close price above 5SMA as well, likely we have a new up swing. I afraid we have ATH soon
Le,
Sorry NO more NEW highs right now!
LHL,
I believe you are defiantly on a good path, with some great points. It is clear that There are some (Gann,…) who are/were very successful utilizing a combination of astro(including Lunar) + Law of Vibration. Or even LOV separately. The bible (especially Old Testament) is very heavy (and coded) on that. If you continue down that path, you would want to begin to become knowledgable about music note relationships (do, re, me,…) and also the enneagram. It is my understanding that this is difficult to learn, but once it is, it is easier and quicker to apply. Everything vibrates.
SC
Thank Steve, I will try it out
LHL, You could take a different route by teaching yourself the skills to test any ideas you might have properly. That way you don’t have to take anyone’s word about what works or doesn’t. Being able to code is a must:
http://www.coursera.org/course/pythonlearn
See also: http://pandas.pydata.org/ 🙂
I’ve been receiving some free research samples from Charles Nenner, S&P 500 forecast is somewhat in line with John’s. You can sign up here:
http://charlesnenner.com/contact/
I’ve no affiliation .
“One year ago today(March 4, 2013), Charles Nenner (of the Charles Nenner Research Center) went on TV. His specialty is Cycle Research (whatever that is). He made a very bold call, forecasting a drop to 5,000 in the Dow.
It was not merely that the 50% drop did not come pass. What happened was the opposite, a 32% rally. And so, one year later, we have to recall this prognostication as one of the very worst of the year. The calls on Apple and Intel and Semis were nearly as bad. ”
http://www.ritholtz.com/blog/2014/03/dow-5000-in-2013/
What a waste of your time and money to follow the guru. Most of them are broken clocks…….Trust yourself (your own independent thinking) instead. How else you going to have conviction?
He predicts Dow will go to 5000 in 2017 or 2018, not 2013.
Funny how people jump to conclusion without reading/listening to the whole thing.
Nenner has never been wrong, that’s what he said on CNBC, anyway.
J.M. Hurst a leading light in cycles said 75% of price movement is due to fundamentals.
Nenner actually said that? Wow, some serious denial going on there. Huge ego too.
http://www.hussmanfunds.com/wmc/wmc141027.htm
you really want to listen to a man with a growth fund track record of -9.73% (3 years); -5.60%(5 year); -1.54%(10 year) and a since inception of 3.36%? You may want to listen to Warren Buffett to balance Hussman’s typical bearish view (being obviously wrong for the past 10 years) instead…..or better yet listen to no one or listen to him for entertainment purposes.
Click to access hsgperf.pdf
A lot of bullishness returned. I would suggest that we begin down slowly initially and gain momentum as we make ever more lower lows, even if only slightly lower lows at first. Complacency at first followed by denial, then disbelief, followed by fear when we take out 1800 SPX TSHF!
We had the divergence in VIX last week. The DAX now flirting with 8900 level MAJOR support again.
Take that out and we’re on our way.
There goes 8900 DAX. If it closes underneath and can’t regain in the next two sessions it,s all over.
What strikes me at present is the number of writers that are bearish from November onwards, but expecting a test of the Sept highs in the next week.
Is that a death sentence for the markets?
8875 on the DAX now. Sounds like you want to see two closes below it, right? Good luck!
two closes below 8900.
looks like DAX is going to squeak by with a close just above 8900.
1929 analog calls for 2 small down days first before larger downs later in the week
Mark Cook agrees with you, Allan:
http://www.marketwatch.com/story/3-reasons-why-you-should-expect-a-30-market-meltdown-2014-10-27
Gary I can’t believe the market gained amd closed higher on Friday’s mid-session levels given what I was seeing.
The intraday charts were literally suspended in mid air. Things are beginning to look down again to me, although they’ve managed to jack the DAX again before the close.
one last injection of free money today. usually drags all boats up.
Do you really think QE will end?
i think it will up to the time when the market starts screaming (read, plunging) for more coolaid:)
let’s start an office pool for guessing how many months (weeks?) will go by before QE4. My guess is 2 months.
i am not sure but agree with the thesis in the article and that this free money for all boondoggle should be stopped and the markets allowed to find an equilibrium over some expanded time horizon:
http://www.zerohedge.com/news/2014-10-27/fed-must-stop-pandering-markets-or-face-unintended-consequences
Yes. All things must pass!
Chris Kimble is presenting the days with the five largest VIX declines within 5 days since 1990. 01/07/2013 is special, because it was caused by a big one day gap up of the stock indices. The other three occurencies were all followed by a template similar to 08-09/2011. So we can expect a backing and filling over 4-8 weeks and perhaps a slight undermining of the october low during the last move down before a longer term uptrend. A waterfall decline is by no means in sight. It wouldn`t fit to the current NAAIM numbers.
The bullish seasonal bias of the five days following october 27 is advocating a continuing uptrend before a new legg down within the expected range.
My expectation now is for rather brutal retracement that may last one-two weeks and get S&P to 1860-1870, running protective sell stops in process. But afterwards weakening bull trend should continue until January and reach 2030-2040 area.
The major concern for the bulls small/mid cap. They may not reach new highs.
biotech looks complete on lt ew waves nearing fibonacci ratios. Also ending diagonal with overshoot – back inside below 2975 NBI. Classic example of a bubble. $/Y is making some positive noises this am being the ultimate arbiter of reason in this market.
I think speculation about the market’s direction right now is rather fruitless as we’ve been operating under a QE environment for so long. And surprisingly (at least to me) there seems to be a sizable contingent of market players who believe QE will be extended. So I hesitate to hazard any sort of guess on the market until we see if QE continues or not.
That said, I assume Dr. Yellen won’t be extending QE and the decision will prove – at least temporarily – unsettling to markets…and maybe more.
The Japanese tried an open ended QE from 2001 to 2006. A little over year after it ended, unemployment began to rise and deflation reemerged. Another QE is unlikely until a recession hits causing deflation and rising unemployment. Since unemployment is a lagging indicator, the data should not show up for a long time. Do we have a year of carry over momentum from QE? I think deflation has already started (oil and other commodities), but the mkt hasn’t figured it out yet. It is really hard for a huge bureaucracy like the FED to change it’s mind on a dime, shows weakness. Its mind now is to stop QE as they have been announcing for months.
If you’re a bull there are a couple of very disturbing things about this chart. Andit isn’t isolated to the SPX either.
http://stockcharts.com/h-sc/ui?s=$SPX&p=W&b=5&g=0&id=p85413930904
namely?
Hi Allan ! Yes, what’s disturbing is that I’m not long enough on IBB and QQQ. I should buy more but I’m pretty much maxed out on my line of credit.
By the way, I see that GDX and GDXJ are down again today. Some people are laughing but who’s been right so far ?
just went short IBB @ $290 🙂 GL
primaC, testing the underside of long term support which it broke two weeks ago, BUT, nearing week two into this rebound and the MACD is still pointing lower and unable to turn up despite a very large price surge higher the last week.
Yes that can be resolved if price continues higher, however, it will take a decent surge to do so and in the mean time this shows categorically that momentum is waning.
thanks. the TL did not show up on the chart that I brought up with your link, but I’ve seen that TL on other charts. There’s a similar TL on the SPX chart that looks like it’s being backtested as we speak. The TL is drawn off the April and August lows.
I hope it works out for you like that Amazon trade Nicko.
Wow. Mon to early Wed this week are supposed to be “negative” days for the stock market and yet the intraday lows on each subsequent day are still higher than the previous day! It is now forming a bullish consolidation flag on the chart and downside appears quite limited and range bound to within only a 20 or 25 SPX move from its high intraday. Maybe 1945 (or even higher) is max downside?
If so then after FOMC Wed announcement it could propel stocks to even further heights in a very short time frame from already overextended levels. Bears might not even get a chance to cover at anything reasonable now …
seems likely to me that the market would just mark time today and tomorrow, waiting for fedSpeak on Wednesday. It’s like a little child who’s been spoiled on too much candy. If the Fed does nothing other than stay the course–QE3 is done at end of October, no interest increase till next year, no QE4–then the market will throw a tantrum, maybe until the Fed relents and starts handing out candy again. (This has already happened once when the Fed announced the start of the taper. That tantrum was referred to as the taper tantrum.) I think it would take a serious tantrum to get the Fed to relent any time soon.
‘course I could be completely wrong, the Fed does nothing new, and the market takes off like a rocket to the upside. But IMO that’s a lower probability outcome.
Refering to the selling climax graph in John’s article above, it can be ruled out, that we are in a 2008 environment (see http://www.ciovaccocapital.com/wordpress/ ). Apart from that bear market it happened only once, namely in spring 2009, that a selling climax was not followed by a double or tripple bottom. Should the indices explode nevertheless after the FOMC announcement, then maybe SPX 2150 in January, but that is not my primary scenario.
There will be NO extension to QE announced on Wednesday. I don’t know how anyone can even concieve that thete will be an extension.
The Fed would lose complete credibility if they extended QE beyond what is already earmarked.
Nick seems to thing the FED will continue QE but then again he bought Amazon before the Amazon plunge -not a good track record.
OK, yes the AMZN trade was a mistake. But, I made tons of money with my IBB, QQQ and my shorts on GDX and GDXJ. The FED will officially end QE but we all know they will keep buying secretly. I expect them to buy stocks if the markets go down.
Cramer was pitching high flyers like TSLA, TWTR, GPRO, NFLX just in Sept. They all are a complete disaster today. Brings back good ole memories of 2001 🙂 first highflyers, indices next.
Forget about QE. The market is a discounting machine so Wall St will try to spin and goose this rally high….with the support of the FED.
Smart gurus are telling us that the stock market would peak to be followed by the commodities……Well, looking at the significant weakness of the commodity complex, the alphabets of DBA, DBB, DBC, DBP(PMs) are telling me that the stock market may not have topped yet or commodities will have to go parabolic to catch up.
Twitter longs getting well a truly smashed. But I understand result are not due till USA close. Leaked info?
must be the most narrow of secondary tops with only biotech, fb and appl making new highs
European banks leading to the downside or the weakest link as we saw in September
Thanks everyone. New post is out.