
Earnings season continues. So far from those who have reported, EPS growth in Q3 is 5%. I remind you that the projection for this quarter was 12% at the start of the year, down to 9% by mid-year and most recently cut to around 5%. To justify equity valuations, earnings growth needs to come in at over 10% each quarter. Q1 came in at 2.2% and Q2 at 7.7%. If we stay at around 5% this quarter, then average earnings growth this year is less than half that required. In fact, this has been the theme for 2.5 years: price front-running a return to solid earnings that has not materialised. Consequently, valuations are at the historic extreme, and the pending repair in price I believe is now underway. When this occurred in 1937, the repair took 8 weeks post-solar-maximum and dropped equities by 38%. Up the stairs, down the elevator, both ways assisted by the sun’s influence.
The sentiment drags continue. 1. We are (very likely) in the post-solar-maximum hangover, 2. October is the geomagnetic seasonal low, and 3. There is a period of actual geomagnetic disturbance predicted right ahead:

Source: NOAA
It is the new moon on Thursday 23rd. After that we add the 4th pull on sentiment into the mix: the lunar negative fortnight into the full moon. I remind you that 6 of the 10 biggest Dow down days in history occurred in the window now and right ahead:
19 Oct 1987
26 Oct 1987
28&29 Oct 1929
6 Nov 1929
15 Oct 2008
In addition to our positioning in that worst window for sentiment, the other conditions for such a repeat crash are in place:
1. Extreme high valuations
2. A long period of price mania: levitation with no meaningful correction
3. Extreme leverage that historically unwinds in a disorderly manner
4. Very lopsided bullishness and allocations
5. A technical price break
In the last couple of weeks we saw the technical price breaks: the Russell 2000 breaking down from its 2014 range and the SP500 making a lower low beneath its 200MA. However, by mid-last-week we saw some washout in indicators from which a relief rally in price erupted into Friday’s close. However, I believe this will be short-lived.
Rob Hannah’s capitulative breadth hit a dizzy 19 but dropped to 4 by the end of the week. Sub 3 is neutralised, so we have a potential set-up for this to occur at the beginning of this coming week. I refer you back to last week’s posts as to why the correction into last Wednesday is unlikely to be a v-bounce and we should at least re-test the lows on positive divergences in the most bullish scenario. Further supporting this idea, we see selling climaxes spiked last week, but as per 2011, this ought to be just the first spike as the market builds out a bottom:
 Source: Schaeffers
New highs-new lows turned negative, other historic instances shown below. Another price low ahead is the most likely.
 Source: Andrew Kassen
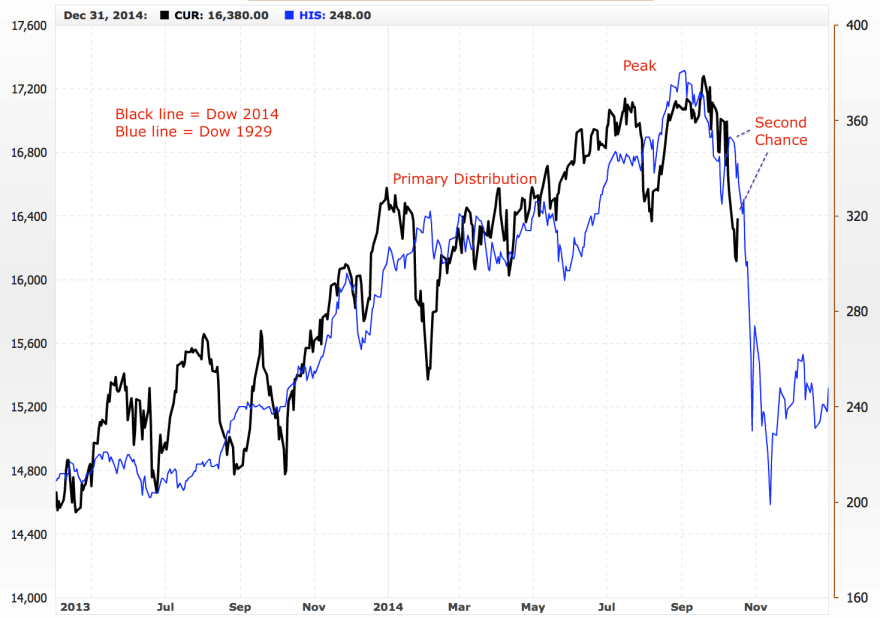
The 1929 analog not only won’t die but looks at its most potent here, as not only the topping pattern but the dates match up very well (the crash coming at the seasonal sentiment weak spot):
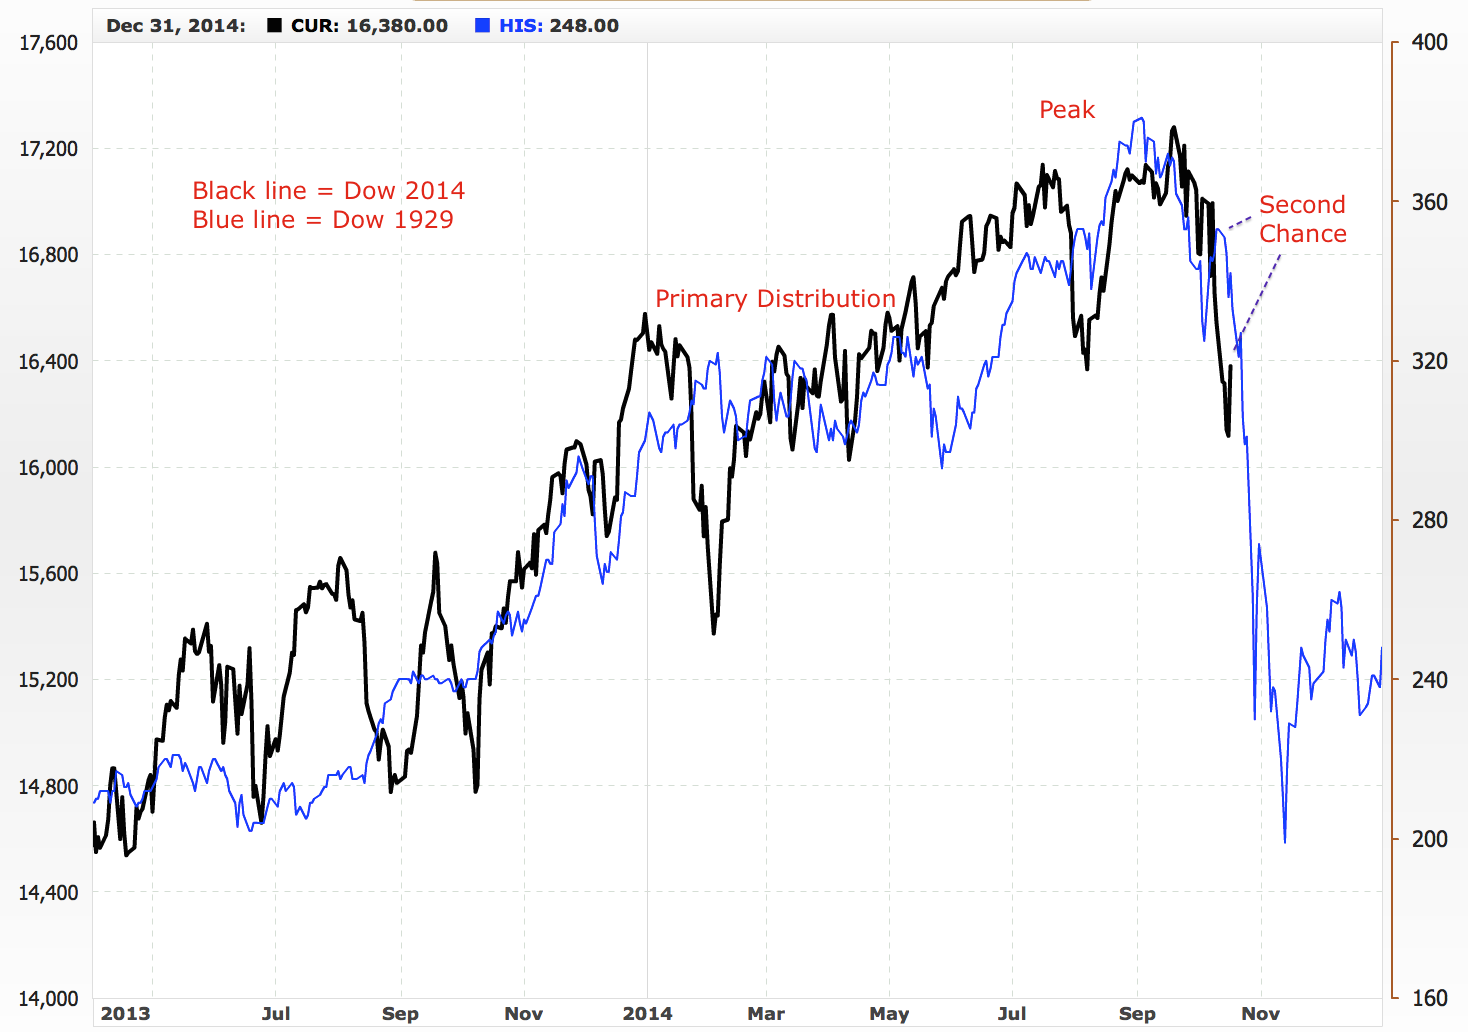
Source: MRCI / My annotations
If we zoom in on the second chance we can see it amounted to just several days of relief rally.
 Source: Ritholz
This is just a guide as to how the waves could play out, given the similar conditions of valuations, leverage, seasonal and technical breaks, but it’s not unreasonable for it to play out that way forward too:
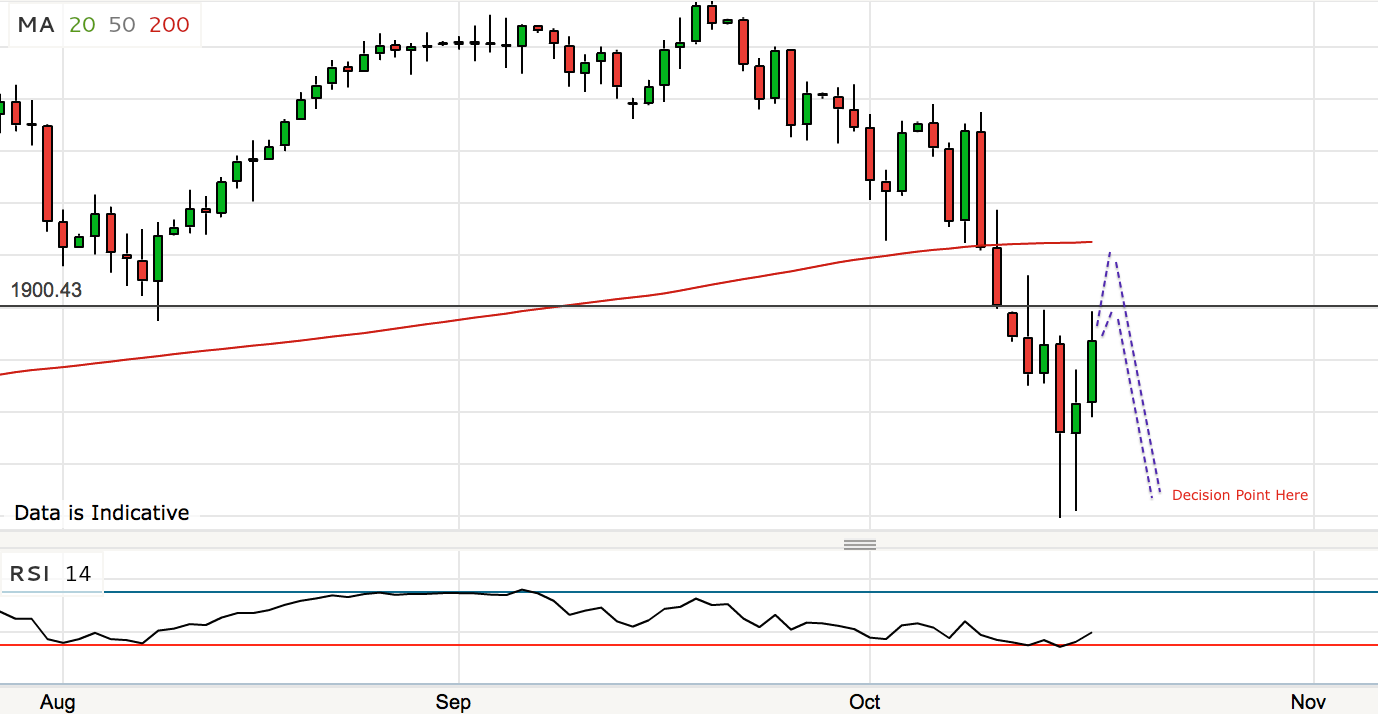
What I suggest could occur is a little more upside at the start of this coming week (CBI neutralisation), followed by a move back down towards the lows of last Wednesday (which can be slightly higher or lower), aided by the forecast geomagnetism and in line with typical stabilisation basing patterns (10% corrections are typically not v-bounces, and typically involve Trin spikes and positive divergences before rallying – both missing so far). If a true low is to form there, then we should see positive divergences in indicators and more evidence of washout or capitulation. That would then provide a firm base for a rally. However, if we see no positive divergences or capitulation evidence then we should break lower, and that removal-of-doubt in buy-the-dip potential ought to be the catalyst for the panic selling.
SP500
The period at the end of October into the full moon of November 6th would be the most appropriate window for this to occur: negative lunar fortnight, geomagnetic seasonal low, post-actual-geomagnetism, and of course post-solar-maximum. After that we have a window into year-end in which seasonal geomagnetism provides tailwinds for the market.
So I am suggesting that either the market stabilises at the decision point shown above and rallies back towards the September highs into year end, or the market collapses at the decision point and crashes before a relief rally erupts into year-end from a much lower level. The weight of evidence supports the latter, but indicator readings at the decision point, should we get there, will provide further clues.
I remind you that certain indicators have a long way to go before we could argue for capitulation and washout. Indicators such as Investors Intelligence, asset allocations, valuation measures and leverage measures. A large magnitude drop would be necessary to correct these imbalances. I also remind you that we are now (very probably) in the period post-solar-maximum whereby the preceding mania turns into the resulting crash (Nasdaq in 2000, Nikkei in 1990, gold in 1980). A crash was the norm in the last 3 solar cycles, not the exception. It may be index-specific, but so far no index has crashed.
The most likely candidate for the heaviest falls remains the Russell 2000, I believe. A 14 year outperformance versus large caps, climbing to a mania into the 2014 solar maximum to its most expensive ever valuation and a p/e of over 100.
 Source: Stockcharts
It has broken down from a likely topping formation and is now attempting a backtest of the breakdown. A repel here should cement the new bear market, and generate the major sell-off. Invalidation of my case would be a break back up into the 2014 price range.

Hi John, great stuff as always. Special thanks to pointing out the fundamentals. I noticed that most bulls anywhere I look stress only technical analysis as the reason for higher prices – capitulation signs, Elliot waves and blah blah all that good stuff. We are waaay stretched, folks!! Why would you want to pay 40 years of earnings for a mature midsized company? 100 years for a relatively established biotech? Personally I think its all pure madness:))
Thanks Slim
Thanks John. You continue amazing me with your in depth analysis and insightful forecast.
From your post above, does it mean that you are ruling out the possibility of an organized sell-off between now and September 2015? The imminent crash is the most likely scenario?
Thanks,
Thanks. I stick to my most probable scenario: a short period of panic selling that cuts deep, a 3-4 month partial retrace of that, then a slow long bear market. However, I can’t rule out other scenarios, have to be prepared for lower probabilities as I see them.
This is exactly what I said yesterday; either the high was September with a pull back into January 2015 or one more leg up. Nice to see we are converging!
As always : thanks for your contributions John.
And now a little detour for the lunatics. I found something weird that I don’t comprehend just yet. It’s this. The solar declination is limited to 23,45 degr; either way. The lunar declination has a wider range and can be within these limits or outside of them.
When the lunar declination is greater than 23,45 degr we call that an out of bound (OOB) moon. I found this on the web.
What I found is that de roc extremes in de lunar declination match exactly with the crossing of the 23.45 boundary. This is remarkable. Apparently lunar declination reacts to the solar declination boundaries! Isn’t the universe magical? Anyway, never heard of such a thing before. But it sets me on a path to include solar declination in my analysis.
It’s Sunday, so one more thing. Looking hard at the declination table I discovered inversions in the lunar declination table. Maybe I should say hidden inversions as it requires a special calculation. Looking back, 2007 showed such an inversion which gave the high. This year February showed such an inversion which gave the low.
Inversion table this year :
jan 27 – feb 9
may 16- july 23
oct 28 – dec 7
jan 18 – jan 31 2015.
Not sure what to make of this yet. But it shows there is still a lot to discover about our solunar configuration. I love it.
Cheers,
André
Adjustment : y=the first inversion started dec 31 and ended feb 9; giving both the dec/jan high and the feb low.
typo; y=the = the
Yes, PimaCanyon. The Lunar Edge (Full + 4 to New = 4) is powerful. However, the North to South Declination is slightly more useful for predicting monthly lows. Since South happens on Oct. 28, and we are approaching the US mid term elections in the 4th year of the decade (+5 on Jay Kaeppel’s Known Trend Index) and we are in the October to November transition bullish end of month, I would expect a bounce until at least the fourth trading day of Nov..
By the way we hit max S declination on October 28, which should be IMHO the nadir of price this monthly cycle. Rise into early, mid November and US elections, then major sell off mid November.
so you’re expecting the 28th to be the low even though the negative lunar fortnight will be just starting at that time? It runs from October 27 thru November 7.
Nice Pattern.
Cheers
Thanks for this research, Andre’. Lunar N to S declinations on a monthly basis have become my most useful indicator for monthly price reductions in the DJIA,
SPY, QQQ, and even GDX. Works like clockwork. Every month at the far N declination there is a top and it either drops a lot into the S or at least meanders lower into the S. I appreciate your pointing the way on this. Just one question, how long does the OOB moon last? It seems like it can go on for a year or more.
Also where does one find data on solar declination and could you define it. How can the sun have declination when it is what the earth rotates around. The moon rotates around the earth and we measure its declination compared to the earth. The sun has no body that it rotates around to compare its declination to? Or is its declination relative to background star markers, the Galactic Center?
Steve S.,
Solar declination is defined relative to earth. As we live on earth it is relevant. In the link I included you see an example of a table, not sure what year. Just google solar declination and you’ll find all the information you want. The OOB moon is a new analysis but I assume it has to do with the gravitational interaction between sun and moon.
What I am researching now is if the combined analysis gives more insights. For instance, every 2 or 3 weeks the declination of moon and sun are equal. What does this mean? And when the lunar declination climbs up from negative to positive while the solar declination is growing more negative, what does that mean?
http://www.reuk.co.uk/Solar-Declination.htm
Lunar nodes is also something I’m looking into. Already noticed that the lunar node midpoints correlate perfectly with the declination extremes. Also seen correlation between node midpoints and my inversions, like the inversions are pushing the turns towards the midpoints. So much to research and so little time.
I know that Gann wrote in his private notes he was very into heliocentric transits, midpoints, declinations and nodes.
p.s.
If you divide the solar declination cycle from – 23,X to +23,X into 30 degree steps you get points in time that serve as solar change in trend.
Cheers,
André
Andre’, one wonders what the solar declination relative to earth might be calculated if one a distant planet like pluto? Isn’t it the earth moving up and down relative to the sun that makes the sun appear to move north and south relative to the earth? I guess as residents of this planet we observe movements of the sun from our perspective which makes it appear to move up and down, when actually it is the planet we are one that is doing the moving.
Also, an interesting factoid that I have noticed is that the Indian Stock Market exhibits an inverse correlation to the DJIA et al’s tendency to fall from Lunar North to Lunar South. Could it be that the moon in Lunar South energizes their markets just as it does DJIA on the way up to Lunar North? I may check other S. hemisphere stock exchanges like Singapore to see if similar effect.
Steve,
I only look at European and American markets. About solar declinations I can only say they seem to work even if we’ve known since Aristarchus the that earth moves around the sun.
isn’t solar declination caused by the tilt of the earth on its axis? The plane of the earth’s orbit around the sun is always the same, but we view the sun traveling north for 6 months out of the year due to earth’s axis tilt.
The other planets all orbit the sun in roughly the same plane that the earth does. However, they do go slightly out of that plane at times. But most of the planetary declination movement is, I believe, also caused by the earth’s axis being tilted.
The moon is a different animal. It’s orbit around the earth is tilted relative to the earth/sun plane. The lunar nodes tell us when the moon crosses the earth/sun plane. The nodes are actually the two points where the moon’s orbit intersects the plane of the earth’s orbit around the sun. So when the moon passes thru the south node, it is heading south of the earth/sun plane, and when it passes thru the north node, it’s heading north of that plane. The only time the moon is in the same plane as earth/sun is when it’s conjunct one of the nodes. That’s why we get eclipses only when the nodes are in alignment with the earth and sun, because that month when the moon conjoins the nodes, it will cast a shadow on the earth (new moon) and be in the earth’s shadow (full moon).
About the periods:
Moon within the boundaries = 6 to 7 years and outside for 10 years.
André
What I observed the moon’s declination boundaries move slowly in both directions on a multi year cycle. Thanks for this.
Declinations are almost symmetrical. I also calculate declination amplitude. Still, inversions can be calculated. If you send me the excel file I’ll send you my indicator for finding the declination inversions.
Cheers,
André
Steve,
It works on a yearly table and there you can almost see the 8/11 year cycle structure. But during a year the sun makes 4 cycles from + to – and back. The moon does this twice a month. So during the year you have many instances where the moon crosses solar boundaries. And then not the theoretical limit of 23,45 , but the actual boundary that slowly cycles through the year.
My thinking is that if this works on a multi year level, it must work on a multi week level. So I put it on my to-do list to research this.
André
p.s.
On the 26th the moon crosses the boundary outwards. This coincides exactly with the tides giving a market low that same weekend and the solar CIT calculated as explained.
Steve,
Seems the north south analysis includes inversions? Sept 30th I had a south value extreme (- 18,53). This was the beginning of the slide down. Or am I slow now 😉
André
Andre’,
I can send you Lunar declinations, as an Excel spreadsheet, for as far back as you need (well maybe not that far ;-). Just tell me how far back, and tell me an email address. FWIW, you are at a serious enough level that you should consider a soft
ware program. There are many, I use Solar Fire (this is not an advertisement) but it is almost too good – intimidating in how much it can do.
Also, not sure I understand comment: “de roc extremes in de lunar declination match exactly with the crossing of the 23.45 boundary. ” I guess that de=the & roc=rate of change. The 23.45 = max Sun Declination which occurs at summer/winter solstice. Maximum Lunar can be up to 28.?, so by definition it has to cross. But I think you are making another point, and I am a little slow.
Steve,
You are not slow, this is very innovative. OOB moon is just defined as the lunar declination outside (either way) the +/- 23.45 degr solar boundary.
When I marked these periods in my declination table I noticed the start and end of these periods correlate with the rate of change extremes I see in the lunar declination. ROC in my system is just the change from period to period, or V – V[1].
This must mean there is a gravitational impact of crossing the boundaries, like the moon racing to these boundaries like it is a magnet. Very weird and I have never read something about this.
So the real question is : what is the impact of an OOB moon? Is this more volatile ? is above 23.45 an uptrend and below -23.45 a downtrend? Questions like thise are in my head and I hope I can find some answers soon.
Yes, I would appreciate a spreadsheet with declinations in the 20th century. Let me set up an anonymous email address And I will give it to you. If this all makes sense I will surely look into buying a software program.
And thanks for your continued interest in these matters.
Steve,
Please send to : lunaticdreamer2345@gmail.com
Thanks in advance
André
I have seen roc or roc extreme in several posts. What does it mean? Thanks.
Roc stands for rate of change and is momentum in a movement. Just calculate V-V[1]. This gives new numbers that show local highs and lows; these I call extremes. Can be done on any time scale.
Cheers,
André
not to mention that the P window starts Oct 23- Nov 4
Please enlighten me; what is a p-window?
Puetz, I am curious. Dose it matter that it is not a total solar elipse?
Six days before and three days after the first full moon after a solar eclipse?
right, that’s what I have too. Because we are past the 3 day window after the full moon/lunar eclipse, I thought that we’re no longer in the “crash window”. The full definition that I have used is that the full moon must be the first full moon to follow the solar eclipse (i.e. two weeks later) and that full moon also needs to be a lunar eclipse. If you use the 6 week window, then it could include the first AND second full moons after the solar eclipse, but the second full moon would not be a lunar eclipse. And the first might not be as well, which is what we have this time.
Eclipses always occur back to back, new moon (solar), followed 2 weeks later by full moon (lunar), or vice versa, the first eclipse could be lunar, and the second, solar. That’s what we had this time. Occasionally you get 3 in a row, a lunar, then solar, then another lunar, or first is solar, then lunar, then another solar.
Andre, P window. Many crashes are associated with the the eclipse pairs that occur about twice a year. Per Puetz’s newsletter, “the general rule is that the panic phase tends to begin at the time of a full-moon within 2 weeks of a solar eclipse.” The panic phase is the crash after the 2nd chance top. Puetz called it the partial recovery. The solar eclipse is more than 2 weeks (1 day) from the lunar eclipse so I thought there technically wasn’t one, but he may have refined it. Also, there seems to be some relationship with the solar eclipse ocurring before the lunar. In the current pair, the solar eclipse is after the lunar. Also he said a lot of crashes begin within 7 days of the lunar eclipse. The lunar eclipse was Oct 8th, so that would be over. Again, Puetz may have refined?
A frequent pattern is a top begins on a new moon and has an initial decline to the next new moon. Then, you get a partial recovery (2nd chance) to the full moon and the crash begins in earnest. The current top was 3 days before the new moon? Hope this helps.
Kent,
Surely does help! Thanks a lot.
Wow, are you the Puetz of Universal cycles, Puetz crash window, etc?
Puetz,
Thanks a lot. Understand a bit more about the eclipse oriented window. Still, wonderful how this shows confluence with the declinational inversions. Could this increase the chance for a crash?
Never too old to learn 😉
André
Thanks John, amazing analysis yet again. You are extremely generous to give this out for free but I believe that such generosity is always rewarded.
Much appreciated Allan
An Outstanding Report deserves 5-Stars. Thank you John. 🙂
Thank you!
I would take this opportunity to clarify my position here. At no point in the last few days have I advocated going long. I am still of the belief that we have begun a horrendous decline.
I however also believe that the nature of markets are to trap as many investors on the wrong side before pulling the trap door shut.
It is for that reason tha I feel that what we are witnessing now and likely for the next few days or week, is nothing more than a very cunning bull trap that will set the stage for John’s “second chance peak and waterfall decline”. Too many became too bearish way too quickly.
One reason I was vocal about the rebound was because another poster asked me last week to keep them informed on my TVIX/UVXY trades which I agreed, so I felt obligated to advise them at laest, when I had sold both these and why I had sold.
Both these instruments are prone to extremely wild swings and except for very rare occasions are not a buy and hold play.
As such I sold both into strength on Wednesday as I began to see signs of market reversals and also negative divergence in both. I believe that both will continue to delcine in the days ahead and may even by as much as 50% or more from their highs, but will, at some point offer a tremendous opportunity to go long VIX just before the huge decline.
Finally I would say to those that may have doubts toward John’s analysis that in over 30 years of trading I have never seen such a comprehensive and decisive collection of articles that IMO sums up the overall situation. We are blessed to have found him. The man is pure genius, don’t underestimate his analysis.
Cheers
Couldn’t agree more, Allan, inc your comments about John.
Thank you Allan for your update. I asked you a question regarding the VIX vehicles, and have followed your posts very closely with very high level of interest. Not sure if I agree that VIX could retrace as much to as much as 50%, but I agree that it would continue retracing earlier in the week before shooting back up again.
Roger u on your opinion of John. His work is genius and second to none. We on this board are so lucky to have found a gem. Thanks both John and Allan.
John I love that 1929 candle chart showing with your annotation showing where we possibly were on Wednesday. I believe that is spot on!
Loud and clear John thanks.
What I can ad is the bradley siderograph
The last turn okt 15/16 was spot on
The way I read the graphic for now…. we are in progress for the second chance top and the market will fall flat on it’s face Okt 28-Nov 4
Or the other scenario Okt 15/16 was the inversion and we go way up until end of year..
If you blow up the graphic you can see things speeding up end of oktober/november
Daily sunspots decling markedly.
http://raben.com/maps/
Thanks John, great post!
This underlines John’s case and outlook:
“If panic selling occurs there (junk debt), stocks could break down sharply, and no amount of central bank intervention may be able to do anything about it.”
http://www.minyanville.com/business-news/markets/articles/michael-gayed-junk-bonds-interest-rates/10/16/2014/id/55799
Just a reminder, when using DOW, S+P and R2K indices…the COMPONENTS are way different…case in point, the S+P 500 from 2002 to today, has about 350 of the SAME STOCKS included…thing is, the price charts on that universe, still DOES support your perspectives…this is where folks in the timing business tend to mis step… John A. Hollosy, C.E.P. JOHN’S DIRECT DIAL–508-528-6051
Securities offered through Investors Capital Corporation, 230 Broadway, Lynnfield, MA 01940, (800) 949-1422, Member FINRA/SIPC This email, including attachments, may include confidential and/or proprietary information, and may be used only by the person or entity to which it is addressed. If the reader of this email is not the intended recipient or his or her authorized agent, the reader is hereby notified that any dissemination, distribution or copying of this email is prohibited. If you have received this email in error, please notify the sender by replying to this message and delete this email immediately The opinions expressed are those of John Hollosy as of today’s date and are subject to change based on market and other conditions. The above is a discussion and does not represent, nor is it intended to provide specific, accounting/legal or tax advice as it pertains to your investments
________________________________
THANK you John, great…
Allen, you made an excellent call last week, well done.
Thanks Phil. I think opportunities abound in the days ahead. This is exactly what bears needed to see.
Longs will be dragged into this market in the coming days suspecting that the lows are in and when it turns back down, slowly initially, as buyers lulled into a false sense of security, will step in to buy the initial dips, then suddenly they will become overwhelmed by the selling. There will be a stampede when last weeks lows are taken out.
Many longs will unfortunately be trapped.
John:
New to your work and just as pleased and impressed as everybody else. One minor thing. I viewed a Trin spike above 2.50 on 10/15 1:30PM at the bottom this week, yet you say none appeared. Am I missing something? Or are we looking at 2 different things. Thanks and keep up the excellent work.
Steve B NYC
I’m referring to closing Trin
John, another great!
Would you cover your shorts completely if we do get a sell-off through November? It does seem like a dangerous time to be short through the New Year, eg 1929 etc. Might you even advocate going long?
Yes my plan would be to exit all shorts in anticipation of a 3-4 month rally leg back up. I’m not keen to be long, but we’ll see how it looks.
I am deciding the same conclusion, except perhaps an unlevered long position.
Ref the Metastock chart of the 1929 stock market. It shows 24 trading days from the top on Sep 23, 1929 to the Oct 4, 1929 (last Wed equivalent low). Well it was actually 28 trading days since the NYSE traded on Saturdays until Sep 29th, 1952. Does it make a difference?
I think US exchanges have implmentyed market breaks so that a 1987 black monday type event will not happen again
Most likely a prolonged down move with many lower highs and higher lows all the way to a fibonacci retracement of 40% to 60%. As in some aquatic creatures the markets seem to me like it needs to keep moving one way or the other to maintain its oxygen levels.
Thank John, your way of analysis and the author of sentimentrader.com very similar but free and even better with solar and moon. Statically, the 4th week of Oct down and the last week up for SP500. There is a problem. For gold very bullish seasonally. Small speculators in COT report stay out of the market, that is good for gold as well. Bond also possibly up. Anyway, it can not happen for Gold, Bond and Sp500 go up AT THE SAME TIME. Still don’t figure out which must go down ?Could be SP500, small speculator buying deep too soon last week
Seasonals are weak and easily overwhelmed. A good example is in the stk mkt, sell in May and go away, didn’t work this year for selling. Small speculators are virtually irrelevant per Briese, author of COT Bible. During this 3 year plus bear market, gold bulls have been trumpeting how short large speculators have been and how bullish that was. Well, the large speculators have been right and the PM bulls have been wrong. Briese say the time to buy is when the LAST large speculator shorts, which can be years. The last large Speculator bought gold in 2010-11. Briese says ignore sell signals in bull markets and ignore buy signals in bear markets. Of course, buy signals in bull mkts are to be followed as well as sellsl in bear mkts.
Agreed,this is a bear market for gold. Just for up swing. You can wait to short when up swing exhausted
Watch for gold and miners to resurge sometime before the
year 2525 CE or within five hundred and eleven years.
Humor? I got squashed last year by the PMs and only
want to trade them when they are way above the 20 day
moving avg.. That said they may have a seasonal rally
in December to February and then fall back.
I thoroughly disagree…
I defer to one wiser than I.
To which statement do you disagree? I assume it is to the Dec to Feb rally. I admit this could be totally incorrect. It was a guess.
Yes, days of trading of the month (TDOM) is a part of my day trading. I combined Taylor and Toby Crable methods with TDOM and Delta.
If you print seasonality chart and stick to trading seasonally strong days of each month you can do much better than B&H. I back tested this to 1995 with SPY
buy during seasonally strong times (e.g. tax day to 5/2, txsgiving tues to 12/2,
12/18 to 12/31, etc.) and short seasonally weak times (e.g. pre tax day,
early june, parts of august and september, mid week october and november) you end up with a genuine better return. Combine this with the Lunar Edge (Full + 4
to New +4), and a bit of Declination Trading (S. to N. up, N. to S. down)…should be able to beat B&H by double or more each and every year. I have tested these simple methods and let’s see if I have the discipline to trade them.
Yelp, they will work so long as I don’t put money on it.
If gold rallies more than 50$ from the last swing it can bullish for a while
Agree but the best rally for gold is from August to Nov
Adding to geomagnetism seasonality mentioned by John is huge sunspot AR2192 http://www.spaceweather.com/ which has already unleashed an X-class flare and will be directly facing earth by the upcoming new moon.
Andre’,
The email I sent to the address has NOT been kicked back (yet), so please check and confirm that received.
SC
Steve;
Everything received in perfect order. In my reply the formula for calculating the hidden declinational inversions.
Thanks a lot.
André
If the polar vortex 2.0 comes to be realized, Europe and NE USA economies will have further excuse to give up. Could be revealed in next few weeks. http://www.zerohedge.com/news/2014-10-19/prepare-gdp-downgrades-eurasian-snow-flashes-polar-vortex-20-warning
Does anyone have a link to a site that explains how the Bradley Siderograph is calculated?
John, try this site:
http://bradleysiderograph.com/
Thanks
I was trying to think of a way to test the efficacy of Bradley turning points – of which I’m not very familiar.
A rough sketch of an approach could be something along the lines of this:
1) Define turning point – maybe an x% rise (fall) in price preceded by an x% fall (rise)
or something more detailed such as:
i.imgur.com/5smUmrz.jpg
i.imgur.com/8ey5Fn5.jpg
Perng et al., 2000
2) Decide on values for the time interval T and % change in price P that seem reasonable when the resulting turning points are viewed on a price chart.
3) With market of choice apply Bradley projected turning points and record % correct hits within +-4 days (Bradley TPs are often said to be accurate within +-4 days).
4) Apply Romano bootstrap to price series 10000 times and record Bradley % correct hit rate (to generate null distribution of hit rates that assumes no forecasting ability).
Compare results of step 3 to distribution in step 4 to get an idea as to whether Bradley forecasted turning points have any value. As an alternative one could bootstrap the bradley TP forecast series instead and apply to original price series multiple times.
John (ntj),
Look at difference between Helio and geo Bradley. Also, Bradley does not give direction, only pivot points. Use change in trend (up to down, or down to up), crossings of the 0 Line, and even consider when the rate of directional is changed (not increasing or decreasing as fast). I believe it to be a very good summary of astro forces. Heavy reliance on declination. But should be used with other method. Good luck.
SC
Nikkei up 3% Monday. Gains occured during morning low tide, now flat. Wonder if DJIA will follow suit. This is a new moon week which is the best week of the month for lunar influences, tho’ worst week for declination. This week is positive for seasonality, and mid terms are coming up. I am only going to short this week at high tides. No clear direction.
I go to short SP500 from this Wenzdy
Hi Steve, firstly my compliments to you as well to deliver such highly valid inputs within this blog. Which webpage are you consulting to decide on high and low tides ? You also mentioned in a different post that this week was a negative planetary combination that historically was showing great result. Which astro software are you using for that ?
Again congrats for your handy investment approach as well.
Cheers,
Joseph
Joseph, thank you for the encouragement. If you google “tide calendar battery park” for the DJIA or “tide calendar tokyo” for the Nikkei this will give you the hi lo tides for the financial center you are interested in trading. I have found price tends to rise 2 hrs before low tide and crest at low tide, and fall from the high tide for about 2 hrs. This is a temporary effect, yet is obvious and consistent enough to be of benefit.
As far as planetary effects, I primarily refer to John’s “Lunar Edge” which is strength Full Moon plus 4 trading days to New Moon plus 4 trading days, and weakness the other days. Also, Andre’ has gotten me interested in declinations of the moon and this matches up with Olga Morales’ work on her excellent website:
http://www.astrologyforganntraders.com.au/main.html as well as youtube videos.
She matches the moon and its move thru the 12 houses with monthly stock performance. Amazingly to me her system has a monthly down move from Leo to Sag, and this corresponds directly to the North to South declination cycle of the moon each month. The market is especially weak during Scorpio which is this Friday with some really deep discounts. This day each month is about 4 days before the farthest South declination.
Right now, we are in the Lunar Edge positive time around the new moon. We are also in the Declination or Zodiac most negative time dropping into the Southern Declination. Combined with our present Mercury Retrograde status which occurs 3 to 4 times per year and acts as an accelerant of markets either up or down.
You may also want to check out:
http://time-price-research-astrofin.blogspot.com/
which has hundreds of articles on astromarketology.
And Danny at Lunatic Trader.com is a student of moon effects and interestingly enough Chinese Zodiac effects on markets by industry and different time frames.
Hope this helps, and lastly Equity Clock.com has a lot of charts for each industry group and country showing historical seasonality trends that are great facsimiles of future market behavior. Thanks again and happy astrolunar trading!
John, thanks for this another convincing set of arguments. It emboldened me to significantly increase my shorts at the European open this morning. I believe the time is now. Short term pattern in futures points to end of correction after retracing 38.2% of losses.
So if that is going to be ‘wave C’ style of event and ‘wave A’ was roughly 200 points (from 2020 to 1820) in S&P then we may not find support before 1570-1580 zone (C = 1,618 x A). It would be logical place for this market to find support at 2000 and 2007 tops.
In the slightly worse case for bears we first rally to retrace 50% losses which would mean S&P finds resistance at 1918 (ES 1914) which is exactly the level of previous support for the market (on 2nd and 8t of Oct market furiously rallied from that level).
Re: 1937 as referenced by John and others:
http://www.marketanthropology.com/
Forgive me in advance John if I missed any reply to SJC on this reposted topic?
And wern’t SC’s 10 – 14 – and 16 also in the running at one time?
Cheers
“John,
I believe you have convincingly argued that the current market is mostly comparable to 1937 (Solar Cycle 17?). However, I am curious how you feel about this Solar Cycle 24 and SC 23 in comparison to Solar Cycle 5, 6 (late 1780’s?) which I believe was the beginning of the Dalton Minimum. Of course, different absolute levels, but in your opinion, are there any comparison structures that apply to current Solar Cycle. Thanks in advance, and sorry if you have analyzed this in past, maybe you could just give link,”
Sorry I missed answering that. I’ve seen the 5-6 comparison, and I covered the general impacts of an anticipated minimum like the dalton:
https://solarcycles.net/2014/09/29/population-gdp-debt-war-and-solar-variation/
Interesting thesis:
http://www.businessinsider.com/goldman-on-buybacks-and-market-volatility-2014-10
Speaking of earnings, John. Look at the big “exceptions” on earnings SAP, GOOG, NCR, NFLX, EBAY, and now IBM. Druckenmiller said IBM is like Kodak and Xerox. They have ignored new technologies (cloud) and borrowed money to buy back stock. Chart looks like a major breakdown. If the bear case is valid I think deflation started in earnest last month. It will a while before the official data shows it and even longer to realize what it means. Next 3 days should be exciting.
Gold wants to go higher so SP would decline. The first hour of US opening up, likely down later on the day. Yesterday also breakout so today highly reverses to the mean. If stopped out , short again tomorrow
If you want to make sure shorting SP500 , just look 2 indicators : oil and copper prices
I thought you said short on Wednesday?
Yes, still wait for Wenzdy, just a small short today.
I got stopped out. Today is green. Additionally, there is Inversed HS in a 4 hour chart. However low volume so not quite convincing. Usually, green Monday will make the whole week up. That worries me.. Try to short again tomorrow and Wednesday. If having stopped out again, I done with SP.Actually I long gold today so my focus switch from SP to gold
Everyone pays attention to Ebola but Greece …..
The highly probability trade now is shorting EUR/GBP.I just found out US regulators ACTUALLY hate forex. They don’t want their citizens trading this market at all. Pretty weird
Tim Wood has an article on gold-eagle and safehaven that says Dow Theory says the primary trend is now bearish. So ignore buy signals and sell sell signals.
I find that interesting
Tim has been waiting a long time to say that
Dovetails very nicely with John H’s fine work
SJC (or anyone?) could you point me to a site for Uranus-Saturn speed? tia
Peggy,
You will need an ephemeris. For geo, Subtract the longitude of one from other. You will notice that once a year something interesting happens. It is the difference from one day to the next that is important, not the reading on a specific day (like 180*, or 90*). In 2014, around very early February the difference between the 2 does something important, and then became normal around the middle of July. What were the markets doing then? Also, look at the speed (change in longitudinal difference) between those dates (early Feb and mid July, and again between mid July and mid Feb 2015). When that speed reaches an extream, what is going on in market of choice? What about the change in the speed (speed difference from one day to next)? This may be one of the wheels within wheels, lunar might fine tune.
SC
thanks. do you evaluate both saturn and uranus speed separately or do you add them together?
or am rereading and seeing that you suggest subtracting one from the other…
Peggy,
Subtract one longitude from another. (SA long-UR long). Then look at that differential longitude from one day to next. Next level of analysis is to look at the difference of the difference (var of var.).
Trust this helps,
SC
Peggy,
I hit ‘post’ a little to quickly. I intended to add another layer. Look at that date in mid July where Sa-Ur speed ceases retrograde. Now Go back, June, May, April, until you find interesting pivots in your market. What is the longitude difference? Now go forward (August, sept,…) from that date mid July date to an equivalent point in longitudinal time. Doesn’t always work, but often enough to be aware.
Have fun,
SC
thank you! one more question – by difference of the difference you mean the difference is either getting smaller or larger?
Peggy,
If I understand your question, yes. e.g. #’s 2,4,6,9,12,15. 1st order Difference is 2,2, 3,3,3. 2nd order difference is 0,1,0,0. Obviously example only.
SC
SJC, John’s chart on his link (expanded) which shows the solar cycle boxed
(2012-2034) surely look like SC 5 and 6. The two peaks–the second lower than the second (highlighted by the orange dots) also look alike. So, is this the best comparison; or is it 1937?
As an aside; this happens to coincide with the period when the ‘Continental Currency’ ceased to be recognized; (May 31, 1781)
http://americanvision.org/3619/john-witherspoon-end-the-fed/
It may well be the best comparison, but on the markets side we can only look reliably to those from the last 120 years or so. So I’d qualify it as 1937 is the best fit from that period.
John, please may I ask whether today’s action gives you confidence in your ‘positions’ or dread?
The pre-market action today had me thinking of the ‘waterfall’ scenario. However it would appear that the marke has ‘stabilised’ and that therefore means the action could go either way?
Your thoughts please. Thanks in advance.
Fine so far. What would invalidate my confidence is if the R2K breaks back up into its 2014 range, or the SP500 back above the 200MA, or this rally lasts more than just a few days. If I’m correct this should arch over into this week’s new moon and under the geomagnetic pressure, falling short of those levels, for a retest of the lows, as a minimum.
John,
any changes in your exit plan based on todays move.
Raymond Merriman published in his Ulitmate book about short-term trading reversals with Solar and Lunar correlations that whenever Sun & Moon & Venus enter in Libra there was historically a very high probability >75 % that a greater 4 % reversal is due within 3 days. This Thursday 23rd October we have this combination. If going into that date we are higher, means we turn lower.
And the sun and moon enter scorpio the next day, ouch!
Good insight; thank you for the info.
People here who advocate ridiculously low prices regarding gold and silver are:
either complicit in the phony electronic futures markets that supply far more [PAPER] contracts which are just claims than the real [PHYSICAL] thing,
or willfully ignorant of this [PAPER] scam that violates the basic law of [PHYSICAL] demand & supply. e.g. In 2013, the physical demand of silver was over 10% more than the physical supply, this is public data at the Silver Institute.
gold is going to 800 and silver to 8
believe it or suffer holding through it
Elvis, could you direct me to where you posted our reasoning for this call. I am fairly new to this great site (thanks to John Hampton:s incredible work and the great bloggers it has attracted).
You may be correct, but yesterday I went to McDonalds and bought an egg mcmuffin, no coffee, no hash browns. The total including tax was over $4. A few years ago this same breakfast sandwich was $1.29. There is definite consumer inflation in food prices, and with the exception of energy most other items as well. Cost of gold production is way above $1000 all in sustaining costs and this should increase with the rise in inflation in the economy. Logically this would cause all the gold miners to move into another industry because they would get bored losing money quarter after quarter.
From another site:
The market had a strong day today on a price basis. The COMPQ closed slightly above it’s 200dma while the SPY finished just below this critical moving average. The problem was volume. It was down considerably across the board, which shows that large institutional players are not heavy buyers.
Back in the day I was an enthusiastic reader of his first ‘gold’ book and studied it with great expectations. Now, I’m rather underwhelmed with the assertions claimed in the book. I only say this because he posted this bit of information on the Uranus/Pluto square.
http://www.mmacycles.com/articles/articles/uranus-square-pluto%3A-2012%112015/
Peter, (et al) isn’t a four (4) year time range rather large? (:-) I think we are looking for something a little more precise.
Jazzman, you might be interested in “The Big Reset” by Middelkoop. .
I apologize folks. It wasn’t my intent to mislead. Spending way too much time on the computer; looking at too many numbers.
https://en.wikipedia.org/wiki/Solar_cycle_3
Going perfectly as far as I am concerned. Getting ready to laod up on TVIX/UVXY when the time is right and gold beginning to diverge.
Bulls (quite impressively although internals sucked) took it to 200 DMA in S&P (ES contract closed at 1904) so baton has to immediately pass into bear’s hand if they do not want to see 50% retrace.
European open shows weakness so maybe a U.S gap at the open which is left unfilled and selling just mounts ?
Gold’s solid advance past 1240 means that bigger correction ins underway but I still think triple digit gold is ahead.
Gold will see $5k way before it sees triple digits.
I always try to keep things in perspective. This chart is a huge red flag to all bears and I will be remaining in cash until such time as I am convinced we are turning back down.
http://stockcharts.com/h-sc/ui?s=$SPX&p=W&b=5&g=0&id=p30171524178
OK Allan, let us know when you go short then. Thanks
Although I don’t have the stats in front of me, I read the market was led yesterday by the defensive sectors (consumer staples, healthcare, etc.) $NYMO is now at a level where it’s reversed in the past. Put-call ratios are showing less fear and the CBI is now back to neutral. All in all, I’d say we’re nearing an optimum reversal point.
Daily DeMark TDST risk level is 1928, according to TradeTrekker.
The fly in the ointment right now are credit markets – HYG, CDX, et al have rebounded strongly.
It turns out that the gap will be to the upside and 50% retrace easily surpassed. Recognition point for the bulls. Indexes should go to the new highs in November. I closed all shorts. But November highs should be final top for this bull.
SPX has a lot of overhead at the 50%, including the 1×1 from the Feb low. I’d consider it the first real test for this rally.
I agree with this, thanks.
Peggy,
If you have been constructing a model based on what I posted yesterday, you may have run into a little construction problem that I intentionally forgot to tell you about. You will find that occasionally the longitudinal difference takes a large jump forward or backward. That is not right, it should be a smooth sequential flow of numbers. The fix is easy, and I do it by manual inspection because the required adjustment doesn’t occurred that often, although I have also made the correction with ‘if,then’ function if the series is ridiculously long. Remember, a cycle is a circle in time. However, a cycle, unlike a circle, doesn’t start over from the same physical point in time, it’s just that the measurement units start over.
thanks Steve
1929 around 6 days back up then a couple of doji candles, 1987 around 8 days back up then a couple of doji candles, both before the waterfall declines. Something like that today/tomorrow/Thursday as we reach the new moon. At the time of writing the R2K is back to the 1100 retest, and the SP500 just above the 200MA. I am expecting the repel there today, no break upwards. If we get the dojis today/tomorrow I will add to the shorts again.
Yeah John I am thinking 2-3 more days ought to do it. The SPX will break its 200 and suck in late comers so we may get a big day tomorrow or Thursday.
And this is one of the reasons the market will plunge when it breaks the 1800 level.
This gentleman and those of his ilk are going to c%#p themselves when we slice through 1800 and gain momentum.
http://finance.yahoo.com/news/a-mega-bull-s-playbook-for-market-selloffs-200342979.html
Hey John,
I also follow 1987 and 1929 but the only thing that troubles my mind is the FED and ECB every time things turn black they start talking and so they manipulate the market right up again…So what will be the trigger that this time arround this came won’t work anymore?
I just don’t see that any verbal support will work. When the stock market is much lower they will get to work again on some new policies, then we’ll see what they come up with.
Thanks I agree …we will have to wait and see if they will take action before or after the markets fall down.
I think thursday or friday we will see te markets decline..
Although bradley was correct calling the turn on 15/16 (from a higher point in the graphic) it will have to make an inversion again..
Love to follow your updates…
John.
FWIW the webots (clif high) called for two october monday crashes this year seperated by two weeks. If 10/13 counts as a little crash then 10/27 should be even bigger
Specie ,
could you post that link?
thanks in advance
John.
Sure FWIW
Ack! Black Mondays in October
Now we (probably) know what the forecast [black mondays] in October are all about…. ebola and ebola fears. Remember that these mondays are separated by 2/weeks and provide both temporal echoing as well as foreshadowing for conditions to be [encountered] in [March 2015 and beyond]. (10/3/2014)
http://www.halfpasthuman.com/
Before US open,SP500 already up and down beyond its average daily range. Try to short but better I off the market
The S&P hasn’t closed below it’s 30 wk MA since June 2012, till now. Currently that would be about 1935.42. A close above this would likely continue the bull market, as unbelievable as that is. Armstrong has backed off his Phase Transition cycle until after 2016, suggesting now we correct into next Fall 2015. He does acknowledge a trend change, as Hedge Funds blow up because of lack of cyclical skills. LOL. They need to discover John.
Alexa could you post link to Armstrong ty
Link to Armstrong. Read him with a dose of salt.
http://armstrongeconomics.com/armstrong_economics_blog/
TY
Bad news good news again. Ouch.
10 year still resisting, and has been acting as the leading indicator.
all my buy signals are tentative this morning EXCEPT THIS ONE – this one is pretty loud and bullish for a few days
http://stockcharts.com/h-sc/ui?s=$NYDEC&p=D&st=2014-02-23&en=2014-10-21&id=p95368616073&a=368972370&r=1413901578831&cmd=print
the chart that NEVER lies is equivocating or cowering or something. It is getting up the courage to TELL THE TRUTH! lol
bbe please would you give us an updated peek at the ‘chart that never lies’. Ta.
Why is Dow so much undeperforming vs S&P and Naz ?
Hmmm glad someone else noticed it too. No ideas though….sorry.
“IBM” “MCD”
If these 2 stalwarts can’t make it what makes the buyers of the other 500 think they can?….but hope springs eternal.
Dow is only 30 stocks, so if a couple or three of the Dow stock are tanking, the Dow index reflects that. But if most other stocks are heading higher, the SPX will outperform the Dow as long as those 2 or 3 stocks continue to lag.
Martin Armstrong will be one of principle sprookers responsible for sending investors fleeing from gold right at the bottom of the cyclical bear market.
I shall take great care to rub his arrogant nose in it!
Allan, do you use EW? Very simple big picture look at gold chart (weekly) has gold sporting a triangle, flat bottom, descending top. An obvious EW count would be that gold is in the process of putting in 5 waves down from the 2011 top, and that it’s currently nearing the end of a 4th wave triangle. If that count is correct, it’s short term bullish as gold should head back up one more time and tag the upper TL of the triangle (although the last leg in a triangle does not always make it back to the TL). After that, it should head south again in wave 5 which would take it below 1000, maybe well below 1000. The test will be when gold hits that descending TL. If it breaks thru to the upside, then this EW count is wrong. If it heads south from there, then I would either be short gold or stand aside until that 5th wave down looks complete.
http://stockcharts.com/h-sc/ui?s=$NAHL:$NATOT&p=D&st=2014-01-20&en=2014-10-20&id=t57737861331&a=369189956&r=1413905989513&cmd=print
4 purvez
Ooooh!! YES bbe. I do see what you mean about it plucking up courage to tell the truth. UGH!!
Thanks very much for the updated link. Very much appreciated.
love your charts, BBE. Keep ’em coming. And good trading to you!
I see this advance as last wave of major advance from October 2011.
In first wave of that bull ES contract made 220 points from 1069 on Oct 4, 2011 to 1289 on Oct 27, 2011. This was in just 3 weeks.
Now ES made a low of 1814 on Oct 15th, 2014.
If first wave = last wave then we land in 2030-2040 area next month (first week of November ?).
So you and the Greedometer guy seem to be in alignment.
It does make you wonder how high this can go in this Appleconomy when they post a stellar quarter and get a 2% rise. Is today’s rise above the MAs in a big part from the Apple effect on the averages? Will see and perhaps the Fed throws water on this rally soon. Dips are still being bought and instead of panic selling it seems we are getting the panic buying and fear of being left out…so much for the margin calls leading the decline…
a close above 1925 means that the buy signals are legit and will run through the end of the week at least – no new highs but a good and playable bear market rally
I know imminent crashes or waterfall declines sound sexy to readers of this blog but this is not what occurred in the prior spring fractal. Extrapolating NDX to the present time the bearish trend bottomed out in mid-Oct and then stages an impressive rally exceeding 5% in one week. It then reclaims the 20-day moving average and then trades sideways for another three weeks bouncing both above and below the 20D-MA. Then it rallies hard again over two weeks for another +5% from just below the 20D-MA to retest the 52-week high. It flag consolidates briefly for about one week trading very near the 52-week high before breaking out to new ATH and it continues well into Jan 2015.
We have now witnessing the strong one week rally exceeding 5% from the bearish bottom. So look for the next big move upwards in mid-Nov after three weeks of more volatility coming up soon. If there is to be a new bear market or pending crash in 2014 then the last chance for that to occur is likely by the first week of Nov at the latest. The spring correction in NDX amounted to -8.8% and this recent correction was slightly deeper around -10%.
A few things needs to be in place for that scenario to play out.
– Policy response from FED in delaying the end of QE
– Implementation of european version of QE by ECB by end of this year.
– Greece is kept under control
– Performance of Nikkei and Yen
This correction is partly due to overvaluation, partly due to expectation that QE will end by end of this month. Seasonality have also play a part in this correction. First thing is to wait to see if the rally can repair some of the technical damage done the indexes.
oh this IS a bear market…
http://stockcharts.com/h-sc/ui?s=$INDU&p=M&yr=20&mn=0&dy=0&id=p69494817865&a=367908471&r=1413909735604&cmd=print
or you have to think that this is where secular bull markets start?
sure its clear that price is being defended but why does a market need to be defended and how long can distortions persist without consequence especially at the top of clearly defined cycles? hmmm?
bbe much as I’m in AWE of our host’s detailed analysis and prognosis of what’s to come, I do relish your ‘one liners’ (almost)…viz ‘oh this IS a bear market’ and then you go on to show why.
Thanks for your insight and of course John’s.
BBE, many chartists have drawn that upper trendline to connect 2000 and 2007 tops as early as the May-Aug 2013 top, only to have that resistance get violated after it stalled briefly. Even on your chart your upper trendline has required to be redrawn twice now and it still broke above it.
Have you ever considered that 2009-2012 could possibly be equivalent to late 1990-1994 and potentially, just maybe, we could be on the cusp of a 1996-2000 style bubble manic melt up surge?
Guaranteed that it is almost a foregone conclusion that you will rejig the upper trend line by a few degrees steeper to capture the 2000, 2007, and (2015) tops in order to justify what you perceive and want to visualize …
I think 1994 is the best comparison as it was the fourth year of the decade which is important for seasonality, decade cycles, mid term years, etc.. We had a sell off in the North to South lunar declination with a significant discount in stock prices. A rally ensued until the end of October. Market sold off the beginning of November, with a significant discount in stock prices close to Thanksgiving during the North to South lunar declination. The market bounced across the calendar divide and bottomed the second week of December. Then it was off to the races for the next 13 months. The difference this time is that I don’t think next year is going to be that great.
bond market isnt buying the rally and unless bonds sell off the rally IS TOAST
There is still small chance for the bears but they need to make strong reversal by the end of today’s session. Which means now.
DAX is just levitating below 8900-resistance. As long as this is the case, we have an important negative divergence of one of the former market frontrunners. Oex-option traders are extremely carefull in these days, so I agree, John’s scenario may still have a chance.
i think anybody that has been paying attention expected a bounce starting late last week and ending late this week
it has been stronger than most expected but a bounce none the less
i suspect by late this week the bounce will end and monday will be interesting
I have the same respect for John’s work as I do for the work at the following link… they are in direct conflict…. they can not both be correct.
http://pugsma.wordpress.com/
Have I read it right that his P3 lasted 3 years and his P4 just 1 month?
In classic elliot 4th’s are often triangles…. that is also shown on chart… and would take months to complete…..it seems illogical in the face of your monumental work/
but if months pass and price follows the triangle then I would give it some credence..a simple solution would be for price to break the recent low in a crash move as outlined in your work….
the elder net line system is giving a buy with the dow just barely qualifying…
XRT and RTH are confirming
if nothing changes into the close I will be FORCED to scale in on some long positions…FORCED AGAINST MY WILL
were gonna get high high high with the music on!
http://stockcharts.com/h-sc/ui?s=$SPX:$VXO&p=D&st=2013-12-14&en=today&id=t20365194476&a=367751425&r=1413913244127&cmd=print
the pattern on the spx in relation to VXO is a concern and the short term VXZ:VXX
is looking like it is exhausted
so the question is does the spx have another 35 to 45 points of rally left this week and is it safely tradable?
I think you if the SPX has another 350 to 450 to go before the next correction. My answer is absolutely YES. Is it safe ? Absolutely, no risk .
you be stupid from too much WCCG!
http://stockcharts.com/h-sc/ui?s=$NAHL:$NATOT&p=D&st=2014-01-20&en=2014-10-21&id=t05209421740&a=369189956&r=1413914237892&cmd=print
update on the update! lol
4 purvez
it’s looking 50/50 right now
John have you taken profits on any shorts yet or still waiting?
Is that for me? Staying short, same targets as outlined several times, looking to add short when we see this rally arching over.
Thanks..I think biggest mistake is not taking profit around 1820/30 and later we could reload. Did you take any profit at all. You know crashes are highly unlikely outcomes.
Yeh it was. Nice conviction. I am looking to Short too in the near future. Like you am waiting for this rally to start tipping back down.
bbe this is definitely looking 50:50 here. I don’t want to overstep our host’s guidance but this ‘power shoot’ has got me worried. I’m hoping its a ‘blow off top’ but it doesn’t look like one.
What’s your reading on this?
Feels like the entire world is gonna flip from long to short at the same instant. Perhaps DAX 9000 resistance, coupled with some death blow news.
in retro should have bought this chart Friday with some speculative longs HOWEVER the WLSH has broken out but has little room to run and the spx is still in it pattern…
http://stockcharts.com/h-sc/ui?s=$WLSH&p=120&st=2014-08-01&en=2014-10-21&id=p51008124558&a=368755255&r=1413916917327&cmd=print
http://stockcharts.com/h-sc/ui?s=$TYX&p=W&st=2010-02-25&en=today&id=p58064360342&a=367751244&r=1413917248561&cmd=print
very bearish from a “next week” perspective
http://stockcharts.com/h-sc/ui?s=$VXV:$VIX&p=60&yr=0&mn=0&dy=10&id=t87058220571&a=372440609&r=1413916594315&cmd=print
somewhat bearish from an hourly perspective
lol
16600 is exactly the 3 bar net line confirm
http://stockcharts.com/h-sc/ui?s=$INDU&p=D&st=2014-07-26&en=today&id=p85137467303&a=372443964&r=1413917774060&cmd=print
the adx is screaming buy but so much of this chart is saying SHORT! lol
cash is good on days like today
I’m not familiar with candlestick formations, but someone who is, calls for 4040 as the target of the Island Reversal, which the NDX has completed last week. Probability should be at least 70% and I think, the target will be matched easily with the current momentum.
Same person derives from history the probability, that SPX will then retest upper limit of 15 years sideways range ( 1575) before targeting 4300. That is ca. three times the decade long sideways range.
http://www.stockstreet.de/de/stockstreet-news/steffens-daily-newsletter/11107549-Achtung-Der-Kursexplosion-folgt-ein-massiver-Crash
The text is German but the graphs are almost self explaining.
Wunderbar, just when I was planning on going short the next four years.
Much apprecciate your mockery-just encouraging!
The article seems to vibe with the Super Boom concept of Jeffrey Hirsch of the Stock Almanac who projects a 500% move in the dow between 2017 to 2026. The sun may not cooperate in the short term however long term I could see much higher prices.
bill u complete numpty, im amazed at your last comment
61.8% retracement in ES contract very close
we also in rising wedge on dow 16612 is top
short dow 16611
The position of Saturn relative to the moon tells me the market is going to all time highs soon. Also, don’t forget Venus which is very hot right now.
I think you are right. It seems the entire solar system is more energetic since the 1990’s. Could it be that we are entering the Age of Aquarius? Since Aquarius governs industries in aviation, maybe Boeing (BA) would be a good investment.
That really helps, thank you!
Uranus retrograde ends 12/13. I have observed a negative correlation between Uranus and the gold mining industry. Possibly GDX will move higher.
Nicolas,
I find your comments on the angle of Saturn and Moon interesting. Can you amplify? Thanks in advance,
SC
ES contract finished exactly at 61.8% retracement, showing no mercy for the bears..
spot on – all initial EW counts go busted today. Upside is there is clarity now on the 1929 and 1937 analog as having completed the 2nd chance today or tomorrow. Both had 67 and 80% retracements before a brutal wave 3 which as analog to 2014 will bust through the megaphone line at 1600 and land at 1435 before the selling subsides. Final wave 5 targets the 2011 highs around 1350.
Caldaro’s EW count is still spot on. major A bottomed at the recent low, we’re now in major B which is itself unfolding as an abc. Intermediate a is in progress, maybe topped today, maybe a little more tomorrow. Then we go down in intermediate b, retracing half or so of int a. then one more push up in int c to complete major B. After major B tops, major C will take the SPX to new lows, maybe to the 1700’s, maybe lower, maybe only a double bottom with last week’s low. As always, this EW count is subject to revision and possible change as market conditions warrant. Your mileage may vary.
The ECB has already bought covered bonds, and is considering buying corporate bonds, or even Junk bonds. Oh boy! Bears are beaten hard.
If the markets would decline like waterfall as John put it, it’s not a surprise that centre banks would be purchasing stocks directly.
Did anybody here feel scared? To fight such big guys as the Fed, the ECB, the BOJ , the BOE, and the PBOC, is nothing but… and hopeless.
ECB is just jawboning, whatever bullshit ECB spews, the market eat it up, even though ECB has not done squat in 3 years.
yeah, it’s amazing the market just doesn’t yawn and go “whatever” whenever Draghi speaks, because as we all know by now, that guy is a Draghi!
USDJPY was participating 1:1 with stocks for first few days of the rally but today it was notably underperforming. It is a slight hint that not all is perfect underneath. But another strong day for the bulls will do unrepairable damage to bear’s case
1929 and 1937 analogs confirm a vicious wave 2 or second chance rally – today was the minimum achieved for wave 3 to begin – finally.
Agree $/Y and E/Y were not cooperating with bullish case for most of the day
Great call Pegasus. My EW count is very much in line with your range. The strong rally today, while painful, at least confirms that wave 2 is done, or very close to be done. I believe that tomorrow will be a pullback, before the next shallow rally next week. Then it will be all set for a waterfall selling scenario as John is predicting.
On another note, UVXY looks very attractive now, as VIX drops below the 18 norm. Any thoughts on this Allan et al???
There is perhaps a case for this being the second chance on the SPX in my view. Although we have rallied strongly, it just doesn’t feel right to me along with some momentum indicators not really looking convincing to my eyes at least…..
I am neither long or short SPX right now, a little short CAC though….
Time, as always, will tell us…:D
J
banned by elvis,
I see what you are saying about 1935, but if you zoomout a little – anything below 2019 or so on SPX is still bear territory arguably.,…
J
(waiting and watching)
The imminent crash is brewing…
Never, in the history of VIX – the so-called ‘fear-index’ – has this ever happened before…
The last 3 days have seen VIX drop 12.74%, 15.55%, and 13.4% today… VIX has NEVER dropped more than 10% for 3 days in a row ever
http://www.zerohedge.com/news/2014-10-21/vix-has-never-done-ever
Vix back testing multi year wedge break out around 15 which is very bullish for vol. Also back on uptrend support. 1929 and 1937 wave 3 targets around 1440 ought to be seriously considered here.
I fully agree with your VIX observations
VIX expiration date will be tomorrow 10/22. I think the crooks are trying to accumulate VIX options knowing the crash is imminent. Last month they brought VIX down as well prior to the VIX expiration date on 09/17. Then the markets topped on 09/19 and collapsed shortly after. Same dirty game by the MMs.
oh please give it break erick
erick, it is what it is mate, don’t read too much into it. Thie signs were there and I said over the weekend to expect huge declines in the VIX.
I don’t think it is finished yet either.
I was tempted to go long XIV last week @ 26.90. One of the worst dceisions I have ever NOT followed through on given what I was seeing…..oh well at least I got out of my VIX longs so not all bad.
Interesting read…..
http://www.marketwatch.com/story/despite-recent-strength-sp-500-is-still-in-a-downtrend-2014-10-21
Bulls might want to ponder the open gaps below…
BTFD seems still intact. The buying is just too violent and strong across the board, looks like the crash has to be delayed again till next year.
this has been around for a while, someone on another forum posted it tonight, I watched it again and it’s still funny.
I went short again this morning in Europe. Things may collapse in short order as per John’s analogs or the market will simply correct as last 3 days were one buying (short covering) orgy. I am watching USDJPY closely
Sell em all 🙂
New post out, thanks all