
No panic selling follow-through from Friday in the Asia and Europe sessions yesterday but weakness hit late in the US, producing the third consecutive >1% down day, taking the SP500 7% down from its peak, and strengthening the steepening down trend. It keeps us on track for tipping into the panic selling, per the analogs, unless the bulls can stop the rot and generate a relief rally, so let’s see how the indicators stand.
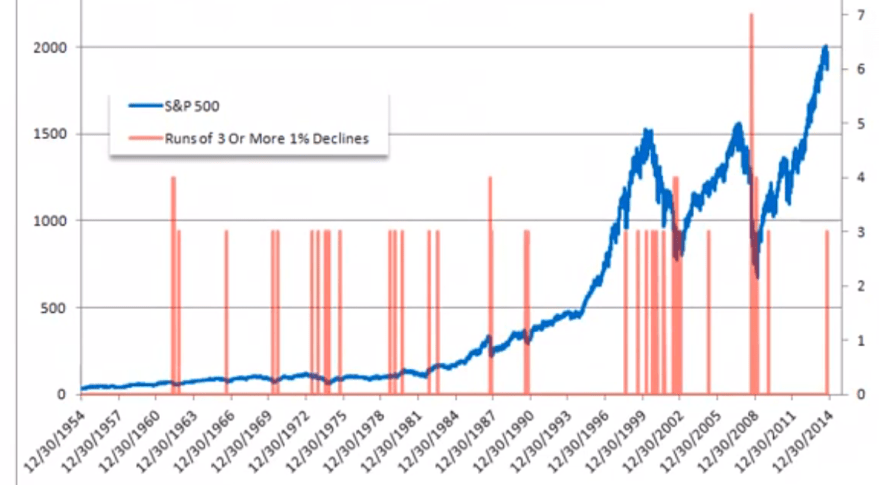
It has been a long time since three consecutive >1% down days, last seen in 2010, and mainly associated with bear market action:
 Source: John Kicklighter
The SP500 sliced through the 200MA with little resistance. The positive divergence on the RSI has been negated with yesterday’s move.
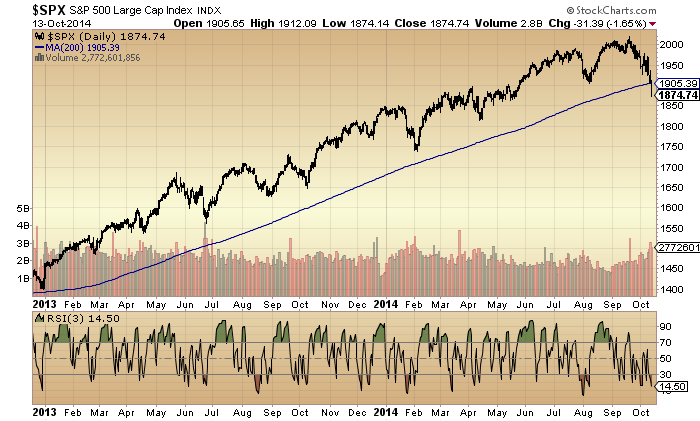
Source: Stockcharts
CPC put call ratio hit the 4th highest in its history. Other such instances shown below and they weren’t great markers of lows:
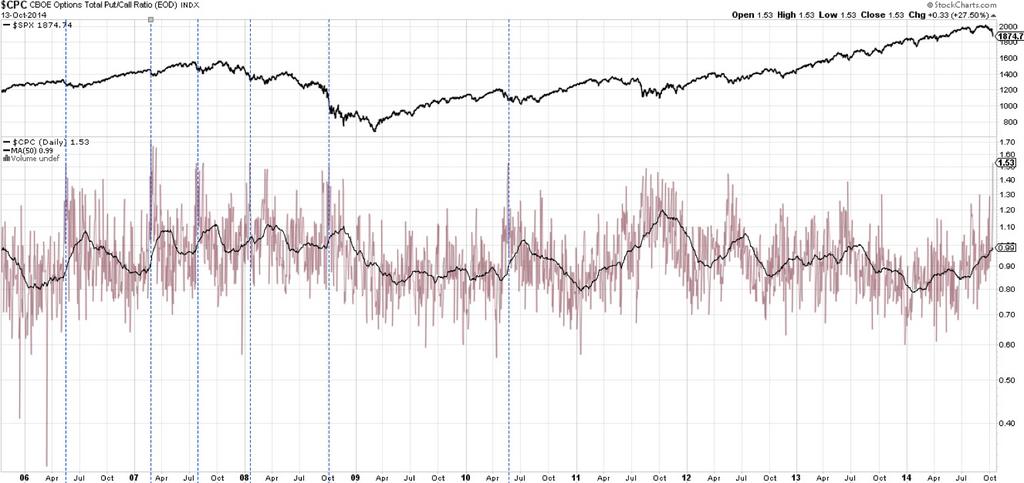 Source: U Karlewitz
In fact they were generally associated with negative returns on all timescales:
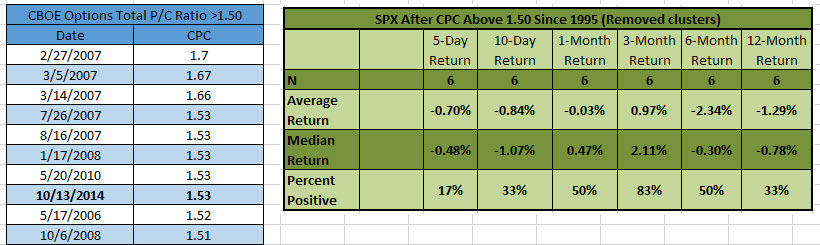 Source: Ryan Detrick
However, capitulative breadth hit 12, which is a washout level. Historical returns shown below:
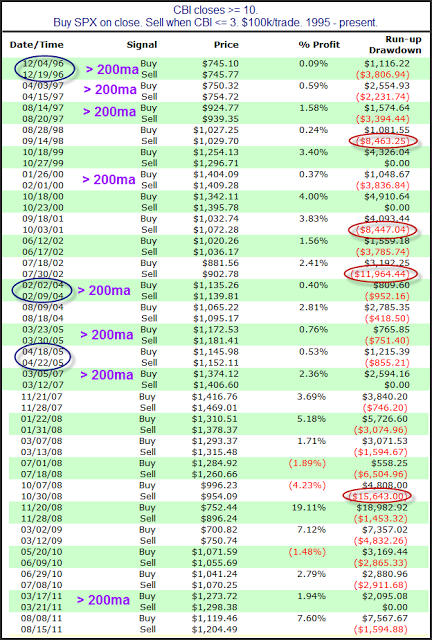 Source: Rob Hannah
A drawdown was fairly common, sometimes large, before mainly positive results.
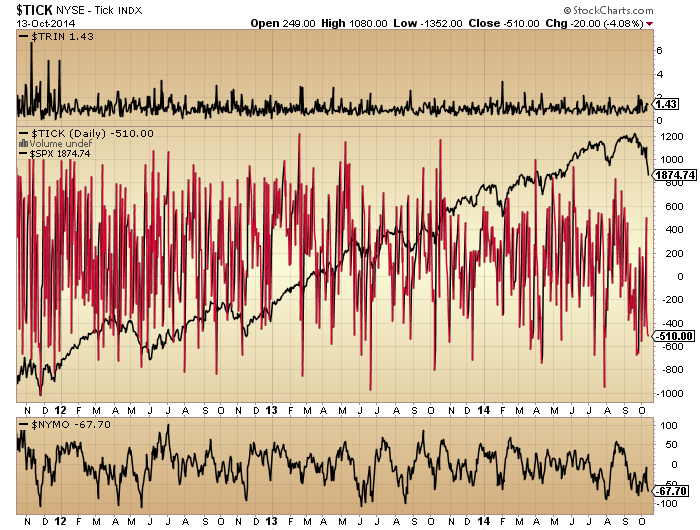
Trin, Nymo and Tick did not make extremes yesterday:
Year to date sector performance looks like this after yesterday:
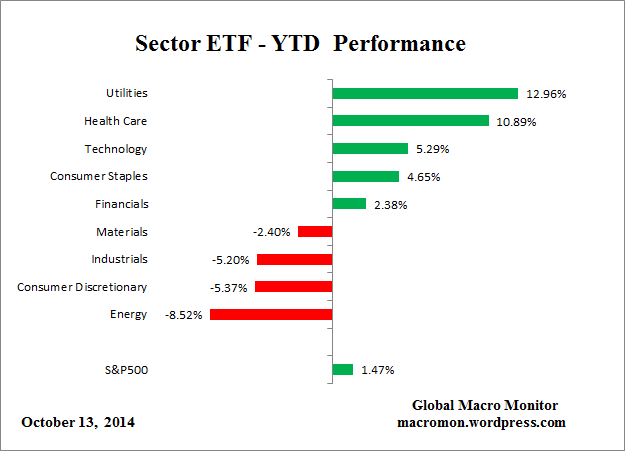
Source: Macromon
All year the top two sectors that are associated with post-market-peak outperformance have been signalling a top, but now their relative performance is much clearer to see.
In summary, the arching-over formation and the increasing bear pressure on the stock indices looks very similar to the waterfall decline analogs (see last post) pre-collapse. With all the major indices now having broken through their key support levels, the bulls need to step in fast to prevent a crash. The CBI washout is on their side, but there may well be further selling (drawdown) before the bounce, if it works again. Other indicators are not at this point showing obvious exhaustion. Therefore, some more selling, to align indicators at contrarian bullish readings, seems the most likely, and a voluminous major distribution day, perhaps that ends as a hammer candle (intraday reversal), would further increase the odds of a bottom, if it is to come.
The question is whether some further selling here can be fairly measured and contained, or whether it would quickly spiral out of control to become a major crash day (or days), given the large imbalances in the market (leverage, bullishness, complacency, etc). Either way, I think the situation is looking fairly black and white now. Either we are cascading into panic-selling, per the historical analogs, and, having broken the key supports, that should now happen very quickly (this week if a collapse, or more sustained selling over several weeks if more like 1937). Or, the bulls can yet generate a relief rally to a second-chance peak (springboarding off that CBI) which should last a couple of weeks or so (drawing on the analogs again), before the market tips over in earnest. Right now the first option has the upper hand (closed at lows, sliced through supports, steepening down trend, a lack of alignment in indicators for exhaustion), so the onus is on the bulls to deliver something today or tomorrow.

John, many thanks for you continued insights.
Agreed John. Your final paragraph is exactly the situation. Bulls either make a stand here or we are going much lower immediately.
Aside from Japan today, Asia again today took yesterdays US action in its stride and Europe also appears to be holding its own today as well.
Over the intermediate term I think that augers poorly for markets as it shows a lack of fear, but what about short term?
I think if we get another sell off in US markets today then that will trigger Asia tomorrow amd then the panic begins.
With all intraday charts and the daily heavily oversold I can’t help but think we get at least an initial rally today that perhaps loses steam again late in the session.
I will be keeping a very close watch on intraday charts for signs of either a sustained retracement or more selling.
I don’t know why but I keep leaning toward the thought that we are not yet second chance rally.
thank you, John. personally I have been very interested in Vix behavior during stress times and have built a simple model that has been fairly reliable. Today it shows that the vix move to the upside is not yet complete and should make it to the 28-30 level at least (so it stll leaves room for at least 2-3% downside), with the next stop (should 29-30 be breached) being 42. After that, all hell will be broken lose- if Vix breaches 42. Interesting that today RUT sits at a major support line dating back to 2009 low (Rut did not fall as much as S&P yesterday), if RUT breaks yesterdays low, it will be a collosal damage. What bugs me a bit is that we are falling without major news, but same thing was happening in 2008 and retrospectively the market said that the downfall was due to a recession which the market did not see (in the news).
btw, HY fell much more than S&P yesterday, usually credit leads equity.
@John, what do you think about possible range of correction if it happens?
Min 18%, average 30%, 2-8 weeks
Well, i meant bullish correction after last falls.
You wrote:
Or, the bulls can yet generate a relief rally to a second-chance peak (springboarding off that CBI) which should last a couple of weeks or so (drawing on the analogs again), before the market tips over in earnest.
Today, there were worse readouts in UE an Germany but nothing spectacular has not happend. I decided to turn to Long positions. Do you have any idea of range of this bull correction? My view is around 1909 (+/-3pts) on SP500 and around 1919 (+/-4pts) on SP500 futures.
I don’t know on that, because I rather favour that we decline more and don’t correct back upwards yet
http://www.safehaven.com/article/35456/special-report-the-64-month-pattern-in-stocks-and-gold
According to shown patterns – after October 2014 we will have almost two months to set up Short position. And in December/January crush will start.
John, for your waterfall prediction to be correct, at what point will you be measuring this % decline. will you measure it from the ATH or from when the real selling starts. thanks
From the ATH
Hi John,
Fantastic site & analysis, things appear obey unfolding nicely.
I am short Dow from 17076 and FTSE from the day of the referendum result @6830(6900-6950 always a long term problem for FTSE in my opinion) . I’ve no intention of chopping and changing, I am short and sitting tight. “IF” scenario 2 plays out and we have a re-trace back up, typically how strong would it be in your opinion.
I have never seen such precise analysis presented in such an orderly and convincing fashion
Well done!!!!!!!!!
AL
Thanks AL. See the last post – there are several examples in there of second chance peaks. The average would be something around 2 weeks back up and retracing half the falls. But I reiterate the evidence doesn’t really support a rally back up, the second chance peak should already be in.
Thank you John…n
John, even those (myself included) who may
have doubted your timing call, never doubted
the quality of your research, together with the
huge amount of work and effort you put in to solarcycles.
Precise timing of markets is hugely difficult, and
I think anyone reading also appreciates that.
Cheers Phil
Turning data into information is a very rare talent …… and you’ve got it in spades!! Thanks for the clarity and generosity.
I am still expecting an intraday low followed by a reversal and then a ramp up to atleast a 50% retrace but probably more. This is based on a particular Expanding Leading Diagonal pattern in EW.
Thanks Purvez
FYI sub of Cobra “Cobra presented two more historical charts last night showing yet again why a new low below 1874 is highly probable:
Since the year 2007:
1) If SPY closes 3 straight days under its BB, then 15 in 17 (88%) cases the SPX makes a new low in the coming few days to a week.
2) If VIX closes above its BB for 3 straight days, then 13 in 15 (86%) cases the SPX makes a new low in the next few days to a week.
In both cases there can sometimes be a few day bounce which gets sold.”
http://stockcharts.com/c-sc/sc?s=%24SPX&p=D&b=5&g=0&id=p94733973974&a=231132339&r=756
possible bounce signal on cpc – short term play
any bounce that doesnt take out 1893 is bearish
fade this booger ! death to the oligarchs! WCCG on the highway to hell!
I hope to see a bungeejump day that would confirm the bradley with a high tomorow and and today is super tuesday…….lets rock and roll..
Bradley is Thursday?
I have okt 15… helio/geo
Do you have a source or do you calculate it yourself? I am very interested in Bradley, but I don’t know how to calculate it myself.
10/16 on this site.
http://forbestadvice.com/Money/Gurus/DonaldBradley/BradleyTurnDates2014.html
http://time-price-research-astrofin.blogspot.nl/2013/12/geocentric-and-heliocentric-bradley.html
This is looking worse for the bulls by the hour. Intraday charts worked off oversold levels early and need to break 1890 now resistance but are in danger of turning back lower, whilst AAPL is going to break soon out of its consolidation.
I suggest which ever way it breaks so goes the broader market.
http://stockcharts.com/h-sc/ui?s=AAPL&p=D&b=5&g=0&id=p46281249521
the internals will be the omens here – they finally matter what with the end of open tab and empty bottles all over the place
http://stockcharts.com/h-sc/ui?s=$NAHL:$NATOT&p=D&st=2014-03-14&en=today&id=p28258456349&a=369189956&r=1413295386217&cmd=print
10/19 – 10/28 extreme planetary A forecast – last time this happened was the end of September. http://www.swpc.noaa.gov/ftpdir/weekly/27DO.txt
Thanks John. The charts have experienced a lot of damage. The 2022 spx high may not be visited again for a very long time.
The sell off in SPX is a 3 legger pattern whereas C is now very near equal to A. This is the area a person might expect a bounce.
A 3 legger pattern suggest a wave 4 pull back or an E wave down may be at work. An “E” wave down of an expanding triangle will typically take out the last low ( 666 in 2009) by a notable amount. The wave 4 possibility suggest a sell off of maybe 38 to 50%, then a fight higher. With most indicators at red line ( near 1929, 2000, & 2007 levels) we should lean toward the “E” wave sell off. This abcde triangle ( also called a megaphone) can be seen clearly on the DOW by making trend lines across the highs and trend lines across the low from the 2000 high.
Bounces should be sold, but with the down trend taking on a 3 legger design, predicting the strength of the bounces will be far more difficult than the bounces found in a 5 legger down.
Thanks again John.
Short SPX1885 … was too impatient closing my shorts yesterday. Expecting more downside. Probably another repeat of yesterday. Gains will be lost by EOD. GLA
so far Duncan you are a good contra account from what I have seen here
This comment is not necessary… Duncan has made some good calls, and yes, covering yesterday didn’t work out, but I assure you, we’ve ~all~ been there…
Duncan, thank you for being so open about your trading…
I always appreciate traders thoughts when they are backing it up with real money….
Comment from rscott is completely uncalled for and amateurish. Always with these things, it says far more about the poster than the person being addressed.
a couple of weeks ago I said that the Volume OsC charts guaranteed that price would break the Keltner bands – these charts are looking sick
http://stockcharts.com/h-sc/ui?s=$NYUD&p=D&yr=0&mn=7&dy=11&id=p68897809979&a=367854604&r=1413299310620&cmd=print
there is no rising bottom pattern on the VO (nyud macd) and so even if there is a rally it will be a bear one that falls off like an ABC bounce
http://stockcharts.com/h-sc/ui?s=$TYX&p=W&st=2010-02-25&en=today&id=p58064360342&a=367751244&r=1413299679692&cmd=print
pretty much assures more downside in quick fashion
xrt is putting in a pretty bearish inside candle
http://stockcharts.com/h-sc/ui?s=XRT&p=D&yr=1&mn=0&dy=0&id=t50797508416&a=370502282&r=1413300188155&cmd=print
XRT can bust out and trigger a 3 bar net line trade to the upside
no joy for bulls yet
Russel higher high higher low. Went neutral.
IWM is close to giving a buy VERY SHORT TERM buy signal
2hour UI is indicating that the bottom here might be a short term trade
http://stockcharts.com/h-sc/ui?s=$WLSH&p=120&st=2014-08-01&en=2014-10-14&id=p51008124558&a=368755255&r=1413300925488&cmd=print
We should get correction back to S&P 1910-1920 area which will offer another good short entry. Downtrend should resume on Thursday or Friday (Opex day).
normally this sort of setup on vix with an inside candle on the index means we still have a couple more down days coming before a short term long is smart
http://stockcharts.com/h-sc/ui?s=$VIX&p=D&yr=0&mn=10&dy=0&id=p45777503033&a=368924046&r=1413301479502&cmd=print
http://stockcharts.com/h-sc/ui?s=$INDU&p=M&yr=20&mn=0&dy=0&id=p69494817865&a=367908471&r=1413302707386&cmd=print
so many long term charts like this are rolling over into a bear market
massive fail if a break down below 1893
let the rape of the retail rubes resume! roflmao
This could become a boaring game: Rallies in the morning, sell off in the evening and playing catch-up with the 1946-Dow-chart, that is reaching the analogue low of about 15000-15200 in 1-3 weeks.
maybe theo but this ED is one of IF NOT THE biggest in history and it is broken and indicating quick and swift surrender to your target….
http://stockcharts.com/h-sc/ui?s=$INDU&p=D&yr=0&mn=11&dy=0&id=t57247061794&a=368645081&r=1413307618028&cmd=print
moment of truth – 03 bounce or and 08 death
BBE you may be right, the indices are starting to exhibit the same patterns that lead to the dsiastrous late sell offs the last three sessions.
the internals are just too nasty and not confirming the bottom – some signals are trying to bounce but they are few and unconvincing at this point
death to the money monopoly!
Even Lazlo Birinyi, the “axe” of this bull market is growing cautious:
http://blogs.marketwatch.com/thetell/2014/10/14/birinyi-not-even-sure-whats-going-on-with-stocks/
Balancing on a razor’s edge…
I am paying particular attention to the Transports. With oil cratering, this index should be flying higher (as it is today). If it can’t gain traction, then something is wrong and would be a very bad sign for the bulls imo.
Treasuries are tanking, folks, broke major support over the past couple of days, yet equities are up today. Its a bad sign, the bonds are telling us deflation is on the way, some is imported from Europe via strong dollar, so Europeans aren’t bringing anything but trouble to the US stock market imo.
check this out (we are way past the support on that chart):
tlt 121.65 breakout will lead to a zoom up past 125 as rates tank
Another short term possibility is that triangle is beginning to form in major indexes. That could mean short flush down at the end of this week and rally next week
i meant yields are tanking, of course,10Y down 4% over past couple of days
ahhhhh soooo
We are going to lower lows folks. The 60/15 min charts are looking down down down.
space weather suggests next week begins the worst part of the decline.
godallmighty, look at oil, down 5% today, whatever that means))) global slowdown, anyone?
Could this be a temporary deflation that will end when Draghi and the ECB ride to the rescue with continental QE.
The panic is beginning to build…
Hello John, at this moment (3:30 pm), do you still see more chance of decline this week?
I still favour that, based on the evidence.
Is that the plunge protection team providing support in the last hour? I see a few pt. rally in the spy.
I just think that’s the schizoid reactionary reality coming in at THE TOP
As opined before.. when the Fed is focusing on the lower than expected inflation data, the markets pays attention more closely to economic indicators…
Today’s 0.8 point drop in the September NFIB to 95.3 (from the previous month’s 96.1) is an ominous signal for Q3 growth… I believe it is why today’s (expected) relief bounce quickly gave way after the data release.
At 95.3, the September NFIB is a mere 5 points below its pre-recesson average… and at a level just two months before the last recession…
it was 87 2 years ago, folks didn’t seem to mind. It dipped from 94-92 in the beginning of the year. This stock market hasn’t been based on indicators for quite awhile…just greed.
I decided not to take the opposing trade in the foreseeable future. I opened several short and will add more on the bounce.
When one says opposing trade, that usually means short, given the market is net long…
opposing trade to most of the voices out here. So, it means long
Several minor turn dates on Bradley after October. Interesting thing is 2015 is void of them until March 7th, 2015.
As I am not a day trader and took some losses between end of September and now. I’m out for now. Just sticking to the money markets. No equities. Think this thing is going to keep falling a little while longer.
On the Bradley, as you point out, it is quite until March (I have 4), but there are some consider Bradley crossing 0 (zero) as important. I have those dates as Feb 16 (geo), and Feb. 11 (Helio). I mention this because there are some astro events that are important (e.g. Saturn- Uranus retro).
The fall you you refer to in 2010 was simply, just like we are seeing now, the mid term presidential cycle low. The chances of a crash are negligible IMHO, we are at the wrong stage of the bigger cycles. We had the crash just 6 years ago, not time yet for another.
Look at the 4 Year cycles from 1974, every 4 years like clockwork, usually, but not always,y in October, we get a sell off low. This will be no different. Gann’s 20 Year cycle is right on time.
Bullish sentiment is under 10% and the bears are frothing at the mouth…perfect!
John,
I think one reason why so many money managers are confused as to what is happening is your theory that the post second chance has ALREADY occurred. Most technicians are somewhat calm, as they are sure a snap back will come, giving them a chance to get in(short) and provide that second chance technically.
In the history of US markets, have we ever had a decline that does not give us a visible lower high before a fall? (on SPX & INDU)?
Thank you.
I don’t know if that has happened before, but I just look at the evidence behind the scenes that says we should be post second chance. We either print such an anomaly in price, or we print anomalies in various indicators.
Per Puetz, no visible 2nd chance of 1637 Tulipmania, US Crash of May 7, 1835, and Jan 14, 2000. 2000 is a stretch, it was the DOW which just fell a little over 10% and most indices topped in Mar.
Daveg,
You may very well be right. I also advocated a bottom in october. The potential for a sell off remains though, as so many cycles came in at the right time, even the lesser known (for instance feb 11, 1948 low + 9732 calendar days= october 4, 1974 bottom + 9727 calendar days= may 22, 2001 top + half of that, say 4864 calendar days produced the september 2014 top. There are some nasty cycles right in front of us, we are not out of the woods. Charts are clearly broken and BB Elvis’ Never-Lie-Chart does not signal a bottom. Yet.
Steve T presented a fractal analog of 2014, with a shift of 2 TD. In the way the charts unfolded lately I was surprised how much the 901 TD cycle acted in the same way as before. The resemblance in the charts in 2007/2011 and now, 2014.
August 16, 2007, the bottom before the run up to october 11, 2007 + 901 TD gave the march 16, 2011 bottom, followed by a run up to the the top may 2, 2011 + 901 TD= october 14, 2014. Will this run up happen again, as Daveg suggests?
Soon thereafter the regular 178 TD wil hit, on october 20, 2014 (with a lot in between, dates already presented by other contributors).
The 178 TD:
april 6, 2011 H + 177 TD=
dec 19, 2011 low + 178 TD=
september 4, 2012 low + 178 TD=
may 22, 2013 top + 178 TD=
february 5, 2014 low.
Also, march 6, 2009 bottom-june 4, 2012 bottom= 1186 calendar days (almost 170 weeks) x 1.732=2054; march 6 + 2054 calendar days= october 20.
And 2 x 2054 calendar days backwards from october 20 = december 4, 1997; december 5 was a high, followed by sell off.
Again 2 x 2054 calendar days backwards= september 7, 1986 with september 5 a high, followed by by a short sell off.
The daily chart of AAPL doesn’t look good. Increasing divergence in just about every indicator, MACD looks horrendous and the symmetrical triangle due to break. If it breaks lower I can see the down side for the markets gaining momentum.
It looks like AAPL topped on iPhone 6 and the plethora bullish calls.
http://stockcharts.com/h-sc/ui?s=AAPL&p=D&b=5&g=0&id=p84347607814
daveg, interesting to consider differing views.
Joanathan recently made a detailed case with a bullish outcome.
My own view has been similar to yours, however increasing I have to consider that may be invalidated.
The SPX and UKX are already below levels where I
would have expected a bounce.
One big down day, around 2% plus,
will strongly tip the balance in favour of the bears as
buy the dips may begin to lose faith in a rapid rebound.
I remain 100% in cash.
Hold your nerve Phil, darkest just before dawn, always looks its worst at low etc etc
Alt: http://www.despair.com/despair.html
🙂 Nice site!!
Phil…
“One big down day, around 2% plus,will strongly tip the balance in favour of the bears”
Mate, playing devils advocate bit here. You do realise you said exactly that before Thursday,Friday, Mondays large moves down?
Mate you might be siting on the fence a bit too much. And that is not criticismas everyones level of risk tolerance is different.
Cheers
Hi John H.
The two links below show the influence of the gas giants on the Solar System Barycenter, and subsequently on the Solar Cycles.
Some interesting graphs on predicted SC min/max.
http://www.landscheidt.info/?q=node/4
http://www.scirp.org/journal/PaperInformation.aspx?paperID=36513&#reference
It is interesting that a number of the cycle values that have been shared on this board, also show up in other cycles within the solar system.
I recently came across a paper written by Russian scientist in 2007 predicting a lower SC max now. They were correlating volcanic activity with SC’s,. Something that is now, fairly common knowledge. However, they differentiated the types of volcanic activity into subduction plate zones, and separation zones (Iceland). They showed that volcanic activity occurred “after” the SC max began to transition to the minimum, not at the top or bottoms. The timely, but early arrival of volcanic activity suggest that the transition has begun, and that the SC peak has gone past. That should put to rest whether this is “it”.
I have been researching available data in an effort to determine if we really are going into a Dalton Minimum. The “camp” was divided into 75% moderate, with 25% full on.
After looking at the available ice core data with emphasis on isotopic profile and distribution (solar vs. cosmic), plus volcanic ash distribution, and then lagging dust (Sahara, Gobi, Central Plains) accumulation, add in the La Nina recharge rate, I am now in the 25% full Dalton Minimum camp.
If you look at the El Nino/La Nina cycle, it has been “flat lining”. The extreme swings have diminished. The “mean” may represent the type of fixed climate that destroyed the various South American empires.
It is going to get colder. It would not be a good thing to have natural gas and oil prices stay down for a long enough period, that production gets shut in.
As stated by so many on this board, thank you for sharing. I am also continuously impressed by the knowledge and quality of the posters you have brought together.
Thanks for the solar minimun information. So, are we gonna going to cool, and by how much?
Thanks E
daveg, SPX/DOW can fall significantly from here
and still be nowhere near a bear market.
It won’t tho 😉
how about a different prospective that the genie of fundamentals is out of the bottle? i am hoping giving the recent vol and given that the earnings season is upon us people will start focusing at what really matters and not technicals. And the fundamentals are waaaaay stretched by any historical measure. I think this is exactly what John is trying to say with a twist that the solar activity change brings us this new perspectives paradigm. This madness of money printing and skewed incentives to hand out free money to anything that moves needs to be stopped!
The earnings season is what might engender a crash. If reports come in lower than expected, there is little for the market to hang its hat on with QE being wound up here in the States and any QE program in Europe pushed out until 2015.
i agree with Michael here, he is usually very sharp:
http://seekingalpha.com/article/2562485-what-is-happening-now-is-profound
The gist of it is- this is not a simple correction we are entering, but a tectonic shift in paradigm i am referring to: the world is in trouble and the CBs of the world are out of bullets to do much. this rhymes perfectly with Johns work.
November is best month to buy every year. Soon there =). Shorts gonna get killed =).
rumors are out that a mid size hedge fund is liquidating its positions. how did late 2007 top was crusted? two Bear Stearns mid size hedge funds flopped.
Leveraged ALL IN LONG!
This is beginning to look like the start of
real validation for John’s outlook.
omg, 10Y TSY yeild is down 8% this am. global wreckovery?
Allen, just to clarify the earlier comment,
yesterday there were still many buy the dips
comments on the various stock boards I read,
posters fully expecting a swift rebound.
Some of those comment yesterday on here also,
all be it many thought any rebound would
be temporary.
Now, following Europe sharply lower sentiment
has fallen off a cliff.
This is the first time during this sell off that I sense
(and read) signs of some panic beginning to creep in.
The S&P has reached the Expanded Leading Diagonal bottom trend line and provided you are willing to suffer another 10 point or so drawdown then it’s time to take a long position.
The 61.8% retracement would be around 1957 and the 76.4% retracement would be 1980.
Nice Risk/Reward here.
purvez, 10Y TSY is down almost 15% this am, its telling us something is not right.
Yes Slim, no guarantees. Bail out point is this morning’s lows.
what time do they deliver margin calls? anyone, lol?:)
Where’s that jonathan dollar guy. I told him that overseas money would be pumped into T bills and not equities. They have been hedging with both since the beginning of the year, now they have show their cards when sh*t hits the fan. dollar and treasuries are still the cleanest dirty shirt, and it’s better than investing in yen, euro, or Netflix…lol
Beware bears – risk of an upside bounce is growing. All about the forced selling that may ensue.
Quantifiable Edges
If mkt closed right now, our CBI indicator http://stks.co/b17Ui would be 26-a level only exceeded at 98, 01, 02, 08 panic lows.
And keep an eye out on those Trannies…
tlt exploded as promised yesterday! lol – I almost added 15% more short positions yesterday but instead added 20% rydex 1.2x gov.
that works! WCCG on the way to HELL!
Adding all the longs I can
?????????????????????????????????????????????????????????????????????????????????????????????????????????????????????????????????
LOL!
Margin call clerks finish up their business 2 p.m. EDT. Let’s see if the market can lift subsequent…
elvis, are your views similar to John in terms
of % declines?, or do you look at this day to day
day to day for me, BUT theo had an appropriate wave 1 target yesterday for the dow
the ED on the dow is probably the biggest in market history and it measures down initially to 15200 so lets see if we get there and how before anything else…
one thing is sure true – ALL THE LONGER TERM CHARTS I USE HAVE ROLLED OVER TO CONFIRMED BEAR MARKETS
for the skeptics: THE CHART THAT NEVER LIES!!!!!!!!!!!!!!!! lol
http://stockcharts.com/h-sc/ui?s=$NAHL:$NATOT&p=D&st=2014-04-12&en=2014-10-15&id=p99223387912&a=369189956&r=1413385431413&cmd=print
Big warning folks. Don’t get too cute with this market. The way I see it currently there are bearish flags everywhere again just like the other day.
We may yet take out the morning lows.
Have a first bounce target at 104.3 in $/yen. This is where the big down-trend line hits connecting 1998 and 2007 highs. Nice attck on the carry trade this morning though.
LMAO!!………they are kidding surely?
Capitulation talk already…….I love it………remember buy when there is despair, just like there was in gold stocks. Not even close to despair, we are still in the denial stage.
http://finance.yahoo.com/news/weak-us-data-spur-fears-133955646.html
Watching 1795 to 1815 area in spy as first big support which tallies with the yen view.
we are down, what 6-7% from the central bankers of the world induced all time high and they are calling it a capitulation?? hahaha! it is hilarious.
http://stockcharts.com/h-sc/ui?s=$INDU&p=D&yr=1&mn=4&dy=0&id=t97736112505&a=368645081&r=1413385478403&cmd=print
you will despair if you buy this before its done
I agree, Allan. And all this talk about the R2K outperforming over the past two days being a sign the market is beginning to stabilize. It’s two days for gosh sake!!
John H, quick question if I may.
I noted you expect a very minimum of an 18%
fall (likely more) – are you using the RUT as a measure
of this, or do you also consider this % can equally
applied to the SPX?.
My view has been invalidated by today’s price action, decisively.
Well done and not quite sure how you held your nerve,
way beyond my capabilities.
I don’t short but did go in to cash 100%,
so I owe you a very big thanks, as it was
largely based on what I read here – and yes I
appreciate its never investment advice.
Thanks. It’s based on large caps. I expect the RUT to fall more.
USE THE TRIGGERS i’ve been posing for a month or more now – there are no buy signals on any chart I use OR using the KISS 3 bar net line trading system.
I posted the info many times.
also the VOLUME OsC that I’ve posted many times predicted the break of the Keltner bands and is still rolling over. THE NYAD has broken all suport and shows no sign of repair. DESPAIR IS INDEED ON TAP…roflmao
http://stockcharts.com/h-sc/ui?s=$NYUD&p=D&yr=0&mn=7&dy=11&id=t61970935679&a=367854604&r=1413386577634&cmd=print
i will go back the month for you triggers tyvm
A reality check for those thinking about going long. Look at the following chart. Look at far we have fallen and where there is any degree of support. i am not saying we go down in one straight line but there is virtually ZERO support until the 200 wma and even that looks flimsy in relation to price.
What happens when a market or security becomes way over extended? The way back down is usually a fraction of the time that it took to go up.
http://stockcharts.com/h-sc/ui?s=$SPX&p=W&b=5&g=0&id=p06660339561
John,
Would like to get your updated thoughts. CBI is very high, please share your thoughts.
Bill not speaking for John but I think you find that his stance has not altered. He is expecting minimum 20-30% declines amd won’t be considering closing his shorts until he sees evidence of a bottom in those targets.
Cheers
http://stockcharts.com/h-sc/ui?s=$TYX&p=W&st=2010-02-25&en=today&id=t99650523164&a=367751244&r=1413387514526&cmd=print
possibility of another 2% down close that continues to open up holes in support
http://stockcharts.com/h-sc/ui?s=$NYA&p=M&yr=1&mn=0&dy=0&id=t38376531214&a=370147489&r=1413388460903&cmd=print
Who cares about the stock market going down 1.5%, we just had treasuries rates collapse in minutes what took usually took years, how is that not insane? I found that just as unbelievable as the great stock market crashes.
yup –
but that is why I posted the tyx chart – IT PREDICTS A WATERFALL DECLINE as rates collapse
look at it carefully
totally agree. an almost 15% drop in a benchmark yield this morning, what the hell is going on? and its not like we are at 20% rate, it is barely 2% to start with for crying out loud, lol…)
we are going to sub 1% on the 30 because there is no demand for loans only refi and cash
yep, i agree we drop way further down. First, Europe exports their deflation- look at bunds, for example. Second, the Fed mopped up a lot of the good stuff, whats there a good insurance company or a pension fund to do- they HAVE to hold lots of treasuries. But still, these drops in yields over past few days are creepy.
Elvis. I hear ya. The hourly charts of the DOW and SPX are all pointing to much lower lows. It looks like we take out the morning lows possibly today.
if we do and close there, lots of long term technical support will be breached- and i will be adding for the shorts.
And what do we have?…..USD down, gold and gold stocks up. And that is just the beginning.
tlt hit 125 as I predicted yesterday…
now the question is how to lock in what is made!
tlt hit 125 as I predicted yesterday…
now the question is how to lock in what is made!
AND THE DOW TANKS TO MINUS 2%! the trap door is open to HELL, bloody HELL! lol
I’m never doubting a Hindenburg omen again. May give false positives in noisy markets, but once again it nailed the top.
F the Hindenburg –
all you need is a cycles system like this
http://stockcharts.com/h-sc/ui?s=$INDU&p=M&yr=20&mn=0&dy=0&id=p69494817865&a=367908471&r=1413390822203&cmd=print
the law of matched time works just as all the other tools I post do
Sept 19th was THE day to go short. Other data and indicators added confidence but not quite as pin-pointy.
Elvis -are you seeing 6,000 on the DOW per your chart?
Allan et al: Question: Any thoughts on the VIX vehicles, TVIX, UVXY.. No backwardation yet, so lots more room to grow from here?
erick, I am keeping a close eye on things but there is much more room for them to run.
I have said all along that at some point those two would be skies the limit. When the real panic begins they can easily be 20-30 baggers and I am talking from higher levels than even now.
Cheers
ok, so now it looks like we are really in flash crash territory.
there is a REAL possibility of a 500 point (or more) down move on the dow right now
I suspect they will try to put in a intraday double bottom. An obvious level. Let’s see how it behaves.
machines will get very worried and they will shred their algorithms at noon
lol
may happen before noon if spx vigorously breaks 1834
Thanks Allan. Appreciated it.
15700 on dow
1774 spx
around 100 IWM
3500 or lower NDX
elvis, is that your short term bottom, what is your long term bottom before a real relief rally?
I post some ideas after a while – spx needs to break down past 1834 or recover mad here
hey allan, looks like apple finally abandoned ship…..bout freakin time. shocker that creating the exact same phone but 1 inch bigger is not considered steve jobs cutting edge innovative 🙂
LNB, mate same technology different package. One wonders how much longer they can keep their fan base loyal?
A friend bought an iPhone 6 and was…… well, questioning himself why in hell he bought it afterwards, especially considering he already owned a 5. I said to him “simple buddy, a fool and his money are easily parted”
looks like first 2pm margin calls are kicking in
Okay, FWIW to anyone, just went FLAT in all trading accounts….
Went from 160% net short from Sept, to coming into this week 63% net short, and am now flat @ 1838-ish….
My trading system is still 100% short, but between the relative strength in the RUT, and this Tweet just a few minutes ago, it triggered my action…
Jason Goepfert @sentimentrader 14 minutes ago
If we close were we are now, our Stock/Bond Ratio would hit -4.5.
Since 1962, exceeded only by 10/19/87, 10/20/87 and 8/8/11.
I am hoping we get a huge bounce out of here to re-short at higher levels, but if we crash lower from here, I’ve already had a pretty good year in the last 6 weeks, so so-be-it…. GL to all, and of course, TY all for all your comments….
This could be a once in a century epic financial system collapse, when comparing indicators to the selloffs in the 80’s may not capture the big picture. Are you going to be satisfied if you take profits now? There is no economy that is not completely full of crap and existing on debt. This is a big deal.
Could be…. And yes, I’d be disappointed…
Perhaps I’ve seen too many scorch-up rallies in the last few years to think 100% objective 100% of the time, but again…I’ve had a pretty good YEAR, just in the last 4 weeks, so I’m good… 🙂
There’s always the next signal, and who knows, like I said, if we see a bounce somewhere I’m looking forward to putting shorts back on….
Just a tactical step-aside for a bit…
When almost all the news is negative I thought I would inject some hopeful information. In the current issue of Science magazine there are two interesting articles about demographic trends and their economic implications. The first article points out that demographic growth is not all positive from an economic viewpoint. They analyze the economic outcome in 40 countries for current demographic trends. The major determinant is the cost of capital. A take-away quote: “The United States is exceptional with a TFR [total fertility rate] close to the level best for public finances.” The outlook gets better as capital costs increase.
yes margin calls are going to be a factor now that we are below 1834
the machines and investment banker drones are not going to know what to do since they havent had to cover longs in a very long while. FUMBLE FINGERS COMING
JOHN why is RUT not tanking with the rest especially as its the more risky, no yield etc
Here is the exact reason……http://www.zerohedge.com/news/2014-10-15/margin-calls-come-most-shorted-stocks-are-doing-just-fine
1812 overture about to start! this is going to get nasty
Catching up to 1926. Day after labor day 1926, Sept 7 to Oct 19, DJIA fell 12%, flat-lined for a week then took off after election to recover 80% of loss by the week before Xmas. Low equivalent today about 15000.
Supports my thesis that the next BIG event will be Republicans taking over Congress then Presidency with massive corp tax cuts to provide coup de whiskey for blow-off rally.
thanks boner
im shocked at the guy from greedometer who has been calling for a crash like john for last 10 months but as soon as we get one he goes LONG at 1905 and 1832, what a complete …… he now says we get to 2000 in next 2-3 weeks
didn’t I call him on it a few days back?
Yeah, ~THAT’S~ a little nuts…. Although if we get there, you can be sure he’ll be picking up a LOT of big-bucks subscribers…
High risk – High reward call, to be sure….
what about the big buck subscribers he lost the past few years…didn’t he call DOW 5000 a few years ago…lol. Pretty sure he called SPX 1500 right now back in February. He will eventually be right, but you have to be patience or you end up go back and forth which he is doing right now…the term is called “chasing”.
Good point!! I hope he’s right, but yeah, if I was a subscriber I’m sure I’d be both confused and annoyed….
oh, ive been on holiday so not been on this blog
There is no economic boom on the horizon, even for China, and the like. PE ratios have barely moved down on the stocks I follow from historically high values. Companies will begin to get defensive and earnings should start decreasing. Fickle investors and executives will protect themselves immediately by selling. A downward spiral is in the works for many years,
There may not be a second chance this time.
Regarding your earlier comment about the oversold condition of 1987, the note referenced days in 1987 AND 2011, so it’s not just the 80’s, and I know what happened right after after those dates….
You do ~not~ want to be short….
And not saying it ~has~ to work out, but the risk/reward of hoping for further downside moves just stopped making sense to me as of this morning….
And there’s ALWAYS another trade around the corner….. 🙂
http://stockcharts.com/h-sc/ui?s=$SPX&p=1&b=5&g=0&id=t36318947590&a=371650351&r=1413397634402&cmd=print
$0.95 – $1.15 billion pomo fires off
ok back to cash 100%
have to wait for todays numbers and eod indicators
Wal Mart lower guidance.
ok – we bounce tomorrow so I take on 25% longs and rest cash
reload bonds and shorts later
canceled the long trade and stayed 100% cash
to weird and the short term charts are jumping up to resistance
could be a great place to reshort or an ambush! lol
http://stockcharts.com/h-sc/ui?s=$INDU&p=120&yr=0&mn=3&dy=0&id=p03242657149&a=368958338&r=1413402071603&cmd=print
Haha I closed out my ftse longs at a fairly large loss when the Dow was 400 down. Since then it’s rocketed which is pretty typical after I have closed lol. I still think further downside is ahead but if the market does rally strongly as it is likely based on my previous experience I apologize to all the shorters here!
made plenty of money with my shorts and bonds no need to try to get every move so cash is grand
we didnt break where we needed to to avoid the bounce – but that is no guarantee it is coming as THE CHART THAT NEVER LIES is still severely broken!
http://stockcharts.com/h-sc/ui?s=$NAHL:$NATOT&p=D&st=2014-01-06&en=today&id=p26435950788&a=369189956&r=1413403197472&cmd=print
Well played, Sir…. Well played…. 🙂
And thank you for the interesting chart, BTW…
I’ve added it to my Daily Markets website folder…
it never lies
like me
but that doesnt mean I am always accurate! lol
Memory refresh regarding insiders: “…That’s because those corporate insiders who historically have exhibited the greatest insight into their companies’ prospects have recently become more bearish than they have been in more than 30 years..” Nov 2013. http://online.barrons.com/news/articles/SB50001424053111904253404579208490897321318
I sold my VIX longs just before the start of the final hour. It looks like we bounce here and possibly hard. I would not be surprised tosee a testing of 200 dma’s at least in the next few days.
If the DAX doesn’t bounce tomorrow, I don’t think other markets will.
NFLX down 25% AH already. TVIX/UVXY up 12%. Another bloodbath tomorrow it seems like.
On the other hand, hard to see the rally continuing if THIS is going be the new “normal”….
http://finance.yahoo.com/q?s=nflx&ql=1
Down over 20% after-hours, ATM…. Wow….
things are getting very strange but it is really best to remember (for me a hard lesson in 2011) that CASH IS A POSITION and that you do not have to trade every day
Growth may be done for NFLX in which case eps peaks at ~$4. Making it a ~$40 stock. Widely held, and thus widely dumped.
fast market – 103 $/Y and 1775 in SPY are now s-t targets looking at a standard EW. Also focused on Eur/Yen as the risk barometer. While staying under 136 risk off seems to be in control.
Anyone else notice CNBC switched to an ominous, end of days theme jingle?
All in long. LEVERAGED
In all sincerity, I hope you make a small fortune on this….
And then you let us know when you reverse short…. 🙂
After hour spy -1.40
Big down tomorrow
Nadeem Walayat, the most astute market forcaster I have read over the years is regarding DOW 18350 as the most reasonable target, but doesn’t expect it to be met before mid November.
http://www.marketoracle.co.uk/Article47715.html
So according to him plenty of time for a retest of the break down level and a cooling down of the bearish mood. Let’s consult the oex-call-put-ratio-oracle, whether it supports a break or even a premature bottom at 16000.
Dow 15350 it must be.
“The market does not know if you are long or short and could not care less. You are the only one emotionally involved with your position. The market is just reacting to supply and demand and if you are cheering it one way, there is always somebody else cheering it just as hard that it will go the other way” – Marty Schwartz, Pit Bull
The move today was flush down from minor triangle formation that was best seen in ES and NQ charts. I closed my shorts. Although crash is possible it is not very probable now. In my view stocks may rally now, maybe after making higher low tomorrow. I would not exclude one more high for S&P in Jan – Mar. Only if S&P 1800 is broken major bear to S&P 500 is confirmed.
1887 and then reshort? let bonds (tlt) consolidate and then watch them launch to 132
a lot of the internals actual worsened as the tick and buy interest improved…
http://stockcharts.com/h-sc/ui?s=$BPNYA&p=D&yr=0&mn=11&dy=0&id=p88394053313&a=367906801&r=1413407086356&cmd=print
TY
If the after hours serve as any indicators, tomorrow promises to be another bloodbath day, a REAL capitulation. On another note, I haven’t seen the divergences yet on hourlies or daily charts and that virtually always happens in every major impulsive move before a real reversal.
From Friday the 24th of October until Friday the 7th of November imo here will be a mid term election rally. 85% of mid term elections have up move during this window (mid term election minus 5 trading days, to plus 3 trading days).
Tomorrow moon in Leo which sets up the 8 worst calendar days of the month according to the moon zodiac cycle. Would expect weakness until at least next Friday.
http://www.moontracks.com/cgi-bin/astrology-calendar.pl?month=7&style=Grid&year=2014&month=10
But tomorrow opens with Low Tide (price positive) as does Friday so I expect relative strength to mid morning then lower starting at 11:30AM.
http://tides.mobilegeographics.com/calendar/year/752.html?y=2014&m=9&d=21
http://www.dowtheoryinvestment.com/2014/10/dow-theory-update-for-october-15-stocks.html
Dow:
October 30, 1946 L +17 years minus 1 CD=oct 29, 1963 H.
2 x 17 years later from october 29, 1963 = october 30, 1997 minus 2 days, bottom crashpanic.
October 30, 1997 + 17 years= oct 30, 2014 minus 3 CD? = october 27, 2014. Or will it turn out to be 2 x 17 or even 3 x 17 years before..?
This is an exciting time. Volatility is opportunity. Definitely a day trader’s playground. If VIX makes new high tomorrow, due to expect some 2011 or 2008-ish actions.
Andre’s work yesterday on declinations was fascinating and well worth research. I did a declination study for a random year 2001. When moon crosses the ecliptic to the south it seems to have a different effect on the markets than when crossing to the north. Will continue to research this.
Steve S.,
I have looked for Andre’s work on declinations that you reference, but can’t find it. Looked at the 14 th (and 13). It maybe handing in plane view . Could you tell me the general area. I know it’s kind of a pain to locate , but I appreciate. Thanks in advance,
SC
Steve the way to find it is to go to the relevant blog page and hit Ctrl+F. That should allow you to enter Andre’s name in a box and it will find each occurence in turn. However since Andre manages to put an ‘acute’ over the ‘e’ which most keybards don’t have as standard I would suggest searching for ‘Andr’.
Hope that helps
I moved to cash yesterday an hour before the close as the 60 min charts were showing reversals.
I do not know(obviously), if was the correct decision however the trannies and Q’s closed back above their 200 dma and the trannies with a higher close.
60min charts everywhere are sporting double bottoms and inverse head and shoulders.
You gotta go with what you see but another collapse would not surprise me.
Everyone is thinking this is 2007…10% correction, then double top, then there she blows. this looks like more like 2011, especially with the VIX…..but one difference…no QE bullets.
Looks more like 2008 to me…
Nikkei opened 2% lower Thursday.
Thanks all. New post is out. Hopefully it answers the questions posed above. If not let me know.