
I recently gathered 40 indicators showing why the stock market is a major shorting opportunity, and now we have increased evidence as to why the speculation peak may be behind us, with the solar peak likely Dec 2013 – Feb 2014, and margin debt thus far having topped out in February.
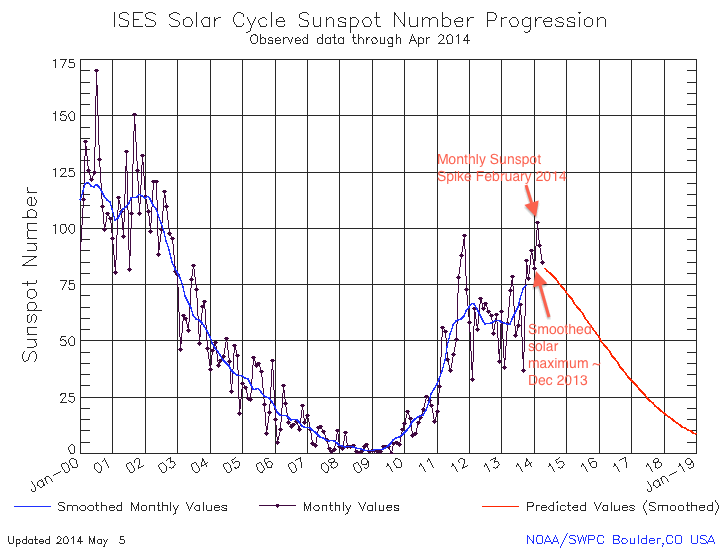
Source: NOAA
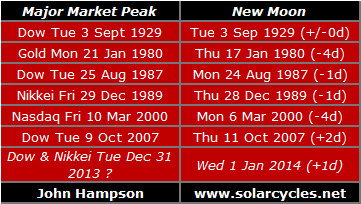
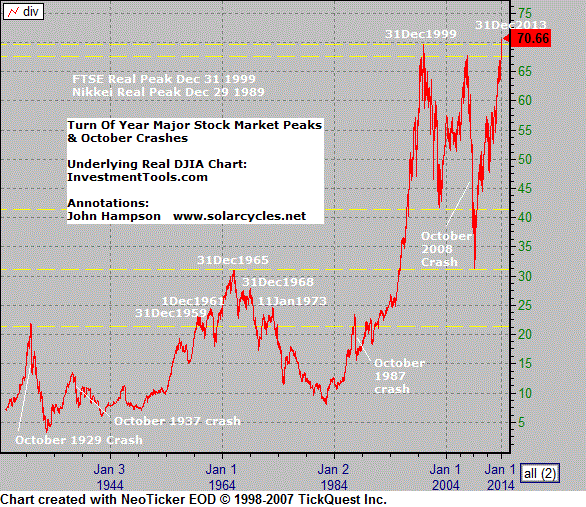
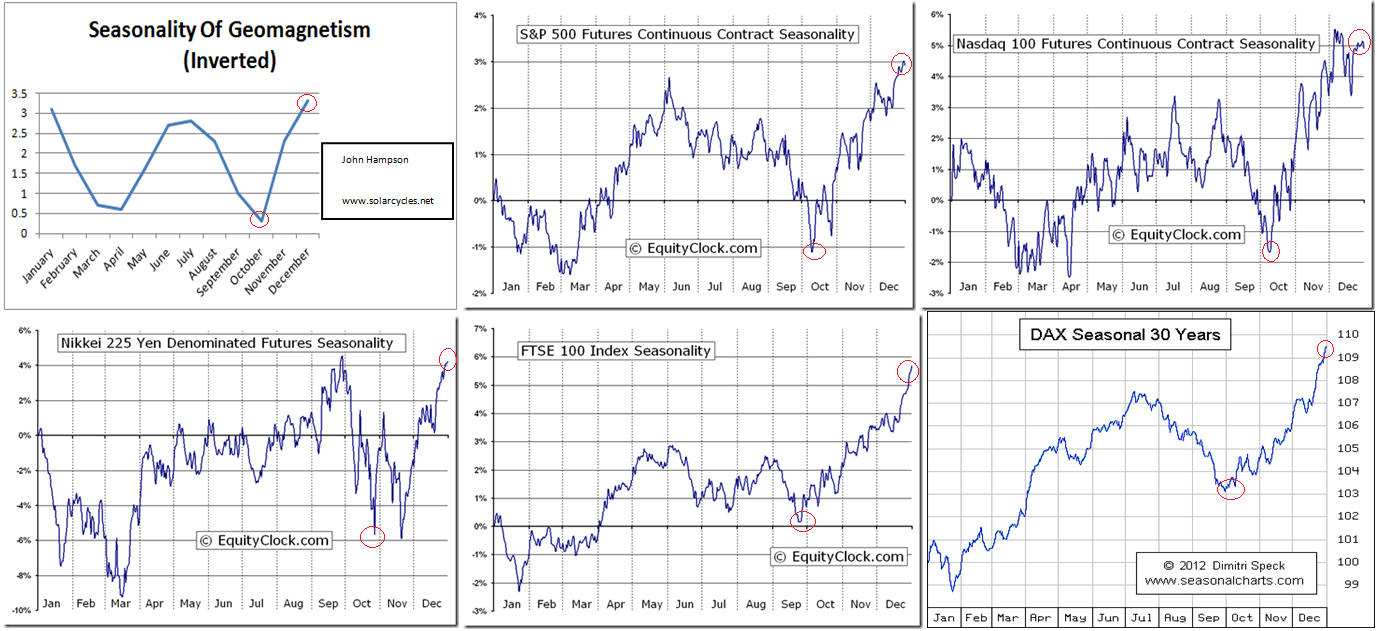
The Bitcoin speculative peak was December. The real Dow and real Nikkei peaks were thus far 31 December 2013, joining the club of historic peaks falling at the inverted seasonal geomagnetic peak (second and third charts):

Source: Dshort
Also, the 31 Dec peak was 1 day from the new moon, which fits the pattern of historic peaks typically occurring at the peak optimism of the new moon. The Russell 2000, Nasdaq and Biotech peaks also look to have fallen at the new moon of March 1st:

Source: Stockcharts
The SP500 has flat-topped between December and May. Chances are slim that this is consolidation before further upside due to the congregation of indicators at historic extremes and the likely waning from here of the solar maximum. Recall: super peaks need a solar maximum, a leverage peak (same buyers more debt) and a demographic tailwind (new buyers). The latter is absent and the leverage is at all-time extreme already.
The solar maximum generates maximum human excitement, so as well as speculation peaking in the markets, we typically see growthflation in the economy into the solar peak. I therefore expect markets and economy to decline as one from here.
A historic opportunity:


Thank you John for your analysis. I imagine that the time spend collating and updating your proprietary indicators on top of maintaining this polished site is considerable.
Certainly from my perspective i can see weakness towards the latter half of May with a crucial window for a top between 8-13 May. However, June would appear to be a pivotal month with the next major high scheduled for December https://www.tradingview.com/x/CMaari9N/
Thank you for the great charts!
They say that we are going into a “Golden Age”. Maybe that also literally means gold and gold prices will reign king (real money) to go along with the higher consciousness I hope that comes with this time of change.
Exceptional again John. Of course no matter how much evidence one puts forward to support a case there will always be non-believers, but that is what makes markets and opportunities I guess.
It is interesting to note that the USD is now within a hare’s breath of breaking crucial long term support. Weakness in the dollar yesterday came with a weaker stock market.
I have just had a very interesting conversation regarding a potential USD collapse in conjunction with a US stock market collapse.
It appears to be the case that the US debt situation may be about to reach a crucial turning point whch sees a sell off of US treasuries and stocks resulting in a USD crisis.
I find also interesting that last qtr US GDP came in at just .01 putting it at the lowest of all major industrialised nations by a country mile.
The ducks appear to be lining up for the stock markets, US treasuries and USD.
Is the world about to wake up to the crisis that confronts the US in terms of debt and unfunded liabilities?
Something IMO is definitely about to give. There are way too many patterns and set ups emerging in the charts of many crucial markets from currencies to commodities.
Gold still looks bullish to me and would be the big benefactor from a USD collapse. And given foreign capital flow into US markets the last 2 years a US dollar collapse combined with any broader stock market weakness would exacerbate the selling from those outside the US.
Cheers
Yes, to say that it is strange is an understatement as USDX has been weakening since the Fed announced the ‘tapering’. One would think ‘tapering’ would strengthen the USD, but somehow the opposite is happening.
Moreover, if one watches the USDX intraday, one would see very volatile movements (e.g. pump up and smash down in few hours) which have been going on for at least a month. This is something I have not seen in recent years.
I would add this longer term chart of John’s largest short… from the 09 low,
the upper line was the target…. once there, at the very minimum, price
should struggle for a long time and in line with John’s amalgamation, should mark a longer term top in this index..
http://stockcharts.com/h-sc/ui?s=$RUT&p=M&st=2002-1-1&en=(today)&id=p40012891676&a=224691875&r=1399456564783&cmd=print
Beautiful chart. If that is not bearish, we are in a new era where the FED does not “allow” bear markets. Jim Grant’s comments on Yellen’s comments were priceless.He said she based her comments on 3 discredited underlying assumptions. 1, the Phillips curve 2, mkt manipulation by the FED, 3. And price fixing by the FED.
I guess that is why we call it a market. I for one will be looking for a long trade close to 50-day MA this morning, my target is all time highs in SPX by Friday or Monday next week. But what I think shouldn’t matter to you, I strongly advise you all to be open to all possibilities and have a plan in advance. My plan is stay bullish as long as we are above last Monday’s low 1850.
Looking at the decline from 5/2 high, I see 3 legs so far. That is what we call an ABC, which is a counter-trend corrective pattern. Note that A would be equal to C at 1861. While that is below the 50-day MA at 1866, that is OK because intraday penetrations are entirely acceptable to my bullish scenario. I will be looking for prices to stabilize between 1861-1866 today in the first 2 hours of trading. That would set up a bottom then rally to all time highs by Friday or Monday. That is my trading plan and I’m sticking to it. Going below 1850 would put me back in cash.
In regards the dollar, from a DeMark perspective:
Currently the US Dollar Index (DXY) has recorded a perfected TD Buy Setup just under the TDST Support at 79.154, providing a technical inflection point for the DXY. Two consecutive closes under the TDST Support will provide confidence the DXY will continue the downtrend via a “13’ count TD Buy Countdown.
So we have a nice set up to buy the dollar with a clear risk level.
The Hubert Nasdaq Sentiment Index has fallen to 6%. Do you really think all these Nasdaq bears are going to get paid? I don’t think so. Sentiment is very bearish now so do the opposite of the mass retail investors.
http://www.marketwatch.com/story/investors-get-bearish-suggesting-stocks-will-rise-2014-05-07?dist=beforebell
The $ clearly broke down this week. Such breakdowns have become buys signals as often as not over the years. Think how many sell stops by what few bulls there are were triggered.
Bears are correct in bear markets, and get rewarded. Bulls are right in bull markets and get rewarded as the last 4 years have shown. The sentiment has been correctly extremely bullish for severaly months now. I use investors intelligence, currently at a very bearish 54.7% bullish and a long string of very low % of bears, also very bearish.
Futures are ripping higher this morning. I am still in cash but at least I am not short. Seriously, we could not break Monday’s low and people are talking crashes again.
Alex define your idea of crash?
Most here are talking of a sustained decline after finalising this topping process. Like I said previously, major tops don’t take a day or two. Look at past major tops. It is natural that the SPX would find support around the 50dma.
I have heard the same arguments directed toward bears, from every bull, at every major top in the last 30 years.
Once again all one can say is that history is the teacher and every indicator says major top. Why is it different his time?
Price does not agree with your proposal of sustained decline. We are going to all time highs on S&P by Friday or Monday. If I am wrong, I lose nothing, stop at breakeven now.
I realize RUT and Nasdaq is weak but remember RUT makes up less than 10% of total market capitalization of US equities. The vast majority of hedge fund, pension, and retail money is in the S&P500 and chart is telling you that stocks have a firm bid and well supported by market breadth. I doubt we will see much downside at all as long as all my bullish setups work fine. Did we even break Monday’s low? Nope, where is the power of the bear? 1850 remains a level I watch carefully, and risk/rward is taking long trades and aiming for all time highs by Friday/Monday.
Wow thank you for this!
Something I have noticed is that people justifying current valuation levels mostly are comparing levels to 2000, the most ridiculous of valuation levels. No lessons learned.
Yes, 2000 was once in a lifetime type overvaluation. Most tops have moderate valuations as the real economies demand for credit is pressuring financial asset valuation.
A mate just sent me this article. It’s not often I read anything on CNBC, I find them too biased, but this is a great article.
I do believe that Ben Bernanke will go down eventually as the chief architect of the global collapse. QE is IMO going to destroy international trade and currency and debt markets.
http://www.cnbc.com/id/101649411
How (un)surprising would it be for the S&P to make new highs from here while Nasdaq, Russell, breadth, etc. diverge similar to other classic topping processes?
We hit 1860 as expected. Now long, 4 point stop that I will move to breakeven as soon as possible.
Remember wave C = wave A. Very bullish 3 legs ABC pattern. Target is all time highs and higher.
Moving stop to entry. +4 in the green on this long.
Markets bottomed at 10:15 AM today right within the window specified. Prices hit exact target. If you stay short, I hope you have a plan for what comes next.
SPX -0.16%. Seriously Crash calls?
I expect all indices to be green by end of day today.
Banks never even went negative today. That was my tell right there.
once again…Will’s words
https://solarcycles.net/2014/05/01/peak-speculation-and-russell-2000/#comments
http://www.thereformedbroker.com/2014/05/07/russell-breaks-down-negative-divergence-in-nyse-new-highs/
Longs now +15. It is just my sincere hope that those of you who are short have a plan for what is coming. It seems like bullish talk is not welcome here, so I will not post any more. Good luck.
Alex I think its been good to have a different viewpoint and have appreciated some of your trading views. Great for discussion.
I’ve been looking forward to Jon’s posts everyday since i found this blog and have learned a few things along the way. So massive thanks to Jon 🙂
From what I figure you are day trading, Jon is longer term so your views aren’t mutually exclusive to each other.
Of those who believe this is a long term peak of which I am one, has anyone discovered a more overvalued sector than biotech? I am not sure if it is safe to short, since an ageing population is more dependent on healthcare. All opinions welcome. I won’t be offended.
WT, the problem with Biotech stocks such as Monsanto et al is that genetically engineered foods (GMOs) are dangerous to our health. They have been shown to cause cancer, allergies, immune dysfunction, intestinal dysbiosis and all sorts of other health problems because they are NOT real foods – they are fake foods, patented by Biotech Companies for profit and not for the health or well being of the people. They have been getting away with not getting them labeled in the U.S. But once the labeling momentum increases, as it has been doing, these Biotech Companies are toast as more and more people figure out that their wares are fraudulent and they are benefiting at the expense of people’s health. (just wanted to share this info with you folks here). 🙂
Mae, I had and still do have huge concerns regarding the health effects of GM foods.
Luckily in Australia all foods sold containing GM ingredients must be labelled, but “THEY” are pushing hard to have the laws changed, because they know that there is massive public opposition toward GM and by and large people don’t want GM products.
One only has to research online to find dozens of credible reports from scientists and researchers that have shared their concerns on the long term effects of GM foods, yet mst of those reports get discounted as bad research and lacking credibe evidence.
Through their massive lobbying in the US companies like Monsanto are able to have laws introduced that take away the rights of individuals to be able to choose for themselves.
It is IMO just one more factor in the total corruption that has infiltrated society at the highest levels in sake of the almighty dollar, but I won’t go down that path again since I think I ruffled a few feathers last week.
Cheers
I moved my stop up to +5 to guarantee a profit. Here is what I am seeing. The turn back down from SPX 1877 weakens the bullish case. It is basically a backtest of the support line that failed yesterday.
Chart: http://i.imgur.com/yXa0VC1.png
Now, wave structure is quite clean. If we call that high as a ‘B’ then the real ‘C’ wave would represent a low risk long trade at around 1840 SPX. After which you are going to that get all time high I mentioned.
Having said that wave count should not give bears comfort as it does not have to unfold that way. I still think possibly today is THE bottom for the launch to all time highs. But keeping stop in case I am wrong, always another trade. It is not true that I am day trading this. I am trying to get a low risk entry for eventually rally to all time highs. So it seems like I am day trading. But if it works, I will hold this long position from SPX for that outcome. IF it works. If it fails, I take home +5 points.
Chart: http://i.imgur.com/WOuq4AT.png
Orange path shows the ABC. Target for C would be SPX 1851, so another 10 points lower than today. Just one possibility or today’s low could be bottom because as you know, 50-day MA test…
Alex Red day trading posts is seriously hijacking to its detriment a great blog and articles by John. Really, no one cares about your minute by minute trading thoughts. If you have more substance to contribute for a larger move in the mid-term to long term then by all means go for it and post.
But a day trading thought post every 20 or 30 minutes is relatively useless and in fact is negatively impacting this blog due to overcrowding the contributions of many others here.
Steve T, thanks for pointing that out. Alex Red should create his own blog for tooting his horn on. The blow by blow on someone else’s blog is extremely annoying. We do not come to this blog (long term solar cycles) to hear about someone else’s minute by minute day trading.
Craig and Steve; I couldn’t agree more. There is a story of the old bull and the young bull walking together on a hill; and they come upon a herd of heifers. The young bull says: “Let’s run down there and breed us a heifer”! The old bull responds by saing: “Let’s just walk down and breed the lot”. Different strokes (no pun intended) for different folks. Me 2-cents is that Livermore was right when he said that:
1. The big money is made by holding for the long term moves, and 2. Most positions in any market should only be initiated maybe 3 or 4 times a year.
Like I said previously, Alex you are making Allen’s case. (:-)
An old bull.
If that is the difference between making ‘good money’ and ‘money’. J. Livermore started by daytrading in bucket shops, and went back to daytrading when lost money, so this is not a big sin, when we look at his rules. Meanwhile, there are mortal sins : 1. Bucking the trend (bull is not over) 2. Trying to catch the first move (we still wait for that first leg down) 3. Being short = no to all contrary opinion (“Don’t trust your own opinion and back your judgment until the action of the market itself confirms your opinion”) and so on. Jesse often tested the market to see where lies the line of least resistance. Maybe Alex Red cannot move the market, but he at least tests it with entering the market and to see how it behaves.
I am pretty sure that mr Livermore would say here exactly this : I am with Alex.
“1. The big money is made by holding for the long term moves, and 2. Most positions in any market should only be initiated maybe 3 or 4 times a year.”
I don’t think you know what those rules mean. They certainly don’t mean that a) you need to have an opinion, b) you stick to your opinion as much as you can c) you decide where the market should turn d) you choose those 4 times a year to trade e) you know for sure where those long moves start.
Those rules mean : a) you stick to the existing trend as much as you can b) you don’t gamble on direction when the market is going nowhere, doing nothing.
This is my last post for sure.
I am not here posting to sell a service or for ego. I came here to try to convince people to be open minded to the possibility that John’s scenario is wrong. Very wrong in my opinion. I don’t want to come back when the SPX is at 1950 or 2050 and see this blog has become a desert wasteland, the last commenter crying that they lost all their money following this bearish scenario. College plans for kids get disrupted, marriages fall apart.
Personally, SPX can go all the way to 2500 in my opinion. No trader shorting here and just hoping for the best will survive.
My long from this morning is now +20. It is not a day trade. I believe we have seen the bottom of this correction, and really doubt we will go below 1840 in the near term or even this year. I urge all of you Keep an open mind and good luck to all of you. Goodbye.
Goodbye!!!
Alex…..I agree with Steve T, this is not a day trading site. The constant need to prove yourself right is getting quite old, and it’s far beneath what this site has to offer. This site is for big boys and girls who want to receive John’s brilliant observations, as well as add meaningful information and insights. If you are looking for approval, look elsewhere. If you are looking to add value, then by all means…do it. But you do not need to warn everyone here….that’s quite unnecessary….and quite unprofessional….
Perhaps YOU instead should open YOUR eyes to the possibility that YOU are wrong….??? Newbies don’t usually think they are wrong….
Goodbye!!!
John, thanks for sharing. I am saddened to see this special community, as a reader put it, being hijacked by day trading posts.
“It seems like bullish talk is not welcome here, so I will not post any more.”
Alex, this couldn’t be more incorrect. And because it so misses the point of this blog and John’s investment approach, it would be better if you don’t post any more…but, again, not for the reason(s) you think.
Good luck to you in any event.
Alex; I perhaps should have added that I no longer like daytrading. I personally don’t think it’s worth the risk anymore; and it’s far, far too stressful. Back in the day, long term for me was 3 days. Maybe I’m jealous because I don’t have your skills. Here’s wishing you all the best if I don’t see your posts or feedback.
John,
I read so many views by other respected authors. I will start posting and see your explanation. Does 2014 feel and compare to 1996.
Check the link – http://www.zenolytics.com/2014/05/a-deeper-look/
Extreme prices, indicators and valuations in the US stock markets. Anyone who believes that extremes cannot be exceeded, or can only be temporarily and marginally exceeded, might have a look at the Dow:Gold ratio in 1995: http://www.chartsrus.com/charts.php?image=http://www.sharelynx.com/chartsfixed/115yeardowgoldratio.gif
That was an impressive extreme which apeared to be the perfect chance to switch from US stocks to gold – just as the Dow started on its most impressive rally ever into the 2000 high.
Mark:
“That was an impressive extreme which apeared to be the perfect chance to switch from US stocks to gold – just as the Dow started on its most impressive rally ever into the 2000 high”
I don’t think anyone here thinks that extremes can’t be exceeded. It is just that we are not talking one or two extremes or indicators here. There are extremes in just about every direction one cares to look.
Couple that with economc figures that just don’t support the case that the economy is improving and I think it is a wise move to lean toward risk aversion, not further speculation.
John’s solar cycle research stands up pretty damn well just by itself and I gotta say the more I study it the more I realise he is definitely onto something.
Hi Allan – I definately think you’re right when you point out how just about everything looks bearish. All-time highs, long lists of bearish indicators, negative divergences, and even the lunar declination cycle (which indicates a bearish phase between 2013 and 2016). Its all so obvious, isn’t it?
But that, ironically, is the reason why the US stock markets haven’t been able to decline significantly – no efficient market will pay out a big profit to the concensus.
You’ve no doubt got the impression that I’m bullish, but all I’ve done is make a few comments pointing out that there are alternative scenarios. In fact, I’ve gone short SP500 today – but that’s just using a pip-range chart to try for opportune entry points, and I’ll be out like a shot on any sustained strength above 1890.
I know you are strongly alligned with John’s current view, but he has already thought about what he would do if these markets rally strongly from here…
…have you?
Thanks all.
Have twisted again and increased Dow and SP500 shorts. Having gone through all the charts again I can just repeat: a historic opportunity.
Absolutely agree John.
I still see a “diamond” on SPX and the way it stands it should break lower any day.
Cheers
John,
when does this negative period end.
Lunar negative? End of next week.
diamond! can you show a chart with outline so we can see.. all i see is an inverted head and shoulders on daily chart, and 1950 target, bloomin hope not as im short too
inverse head on low is 13th april
looking at russell chart any dip below 2oodma in last couple yrs has been buying chance!!
With the weakness in the Nikkei earlier this week, the next phase of weakness in SPX (should it come) could push the Nikkei below the big support level at 14,000 and create a wave of selling. This could also push the 10 yr yield below its level at 2.580% and the USDJPY as well. Thereby releasing all the energy that has been building in markets to the downside.
Looking at the price relationships between the 10 yr yield and SPX in the past, mainly 2007 and 2011. It was the confirmed break of support in the 10 yr yield that finally confirmed a high in SPX
Sopriscap, Thanks for your comments. If you see US 10-Year Bond yield it already looks weak. See CCI(200) on daily is -79 and all my prop indicator suggesting down. About Nikkei it also looks weak. CCI(200) at -70. Here again my prop indicators suggesting down. As you said below 14000 downside will get momentum.
we just need wait for some days for both the above to start decline. Thanks again for your comment.
Love your work John. Always interesting charts from which logical conclusions are drawn. I’ve been trading over 20 years and am involved with trading software design and automation. The only other blog/website I view regularly is Martin Armstrong. He is a bit of a cynic like myself and believes the world is in deep doo-doo because of the ever growing public sector, and ineptitude of those elected and appointed officials.
My question related to your perspective pertains to ongoing QE and thus being in unchartered waters can any of our previous work/ideas be applied to the current trading environment? Someone told me one of the worlds most successful traders, Paul Tudor Jones commented at a speaking engagement recently that the past couple years of trading have been his most trying in his 35 year career. I agree with your assessment that this market is in the 3rd, 4th, 5th standard deviation relative to value but that doesn’t mean it can’t continue. As a side note I just got short again today and do believe the market could be topping.
That being said what needs to happen to confirm/negate your perspective that this could be a “historic opportunity”?
Thanks Steve.
I see QE as the mantra for the current mania. If it really worked valuations would not be so high and economic growth so low.
The indicators (valuations, euphoria, leverage, divergences, solar cycles, bull market internals, demographics etc) present such a solid cross-referenced mutli-angled case, that I have strong conviction this is a historic opportunity. Too many to entertain invalidation.
Maybe next week then. Starting to get painful watching these powerful rallies. But this is all part of the topping process….
My thinking aligns with John but the it is hard to stay patient at the cusp of a historic opportunity…
One thing puzzles me though: Small caps (Russel 2000) is now down 10% but SP500 has not moved down at all. This has never happened before!? Can anyone offer theories to explain this?
Obviously, I am hoping that SP500 will correct down to RUT. Until it happens, one should remain open to alternative scenarios. I am thinking a sector rotation and all new time highs for large caps.
“According to Jason Goepfert of SentimenTrader, Tuesday was only the third time in 35 years of market history that the NYSE Composite was sitting at a 52-week high one day before the Russell 2000 dropped below both its 50- and 200-day moving averages the next day. The last two occurrences were 3/12/99 and 11/1/07” http://www.marketwatch.com/story/small-cap-stocks-send-bear-market-signal-2014-05-08?dist=markets
Just to add, when I first saw those two dates quoted by Sentimentrader I thought they implied an urgent bearishness. But a closer look at the SP500 chart shows a 3/9 month delay (and considerably higher prices) before the market eventually rolled over.
That timescale matches nicely with the most likely end of the SC24 plateau very late 2014 or early 2015…
Hi DV.
This of any help? http://www.streetsmartpost.com
Academic study: http://rnm.simon.rochester.edu/research/PPiCToAPA.pdf
Predictive regressions find that the party of the U.S. President, the weather in Manhattan, global warming, the El Ni ̃no phenomenon, sunspots, and the conjunctions of the planets all have significant power predicting the performance of popular anomalies. The interpretation of these results has important implications for the asset pricing literature.
USDX appears to be on the verge of a big movement, either up or down, both the ADX of the Directional Movement Index and the Bollinger Bandwidth are at the lowest level since 1990, this of course indicates the lowest volatility.
The resolution of this current situation would impact various asset classes.
http://scharts.co/1kQkns3
Somehow the above link does not work for those who are not stockcharts.com members, my apologies. It is just a monthly chart from 1990, to observe the lowest volatility, the DMI period is set to 5 and the Bollinger Bandwidth is 20, 2.
Thanks for the input everyone.