

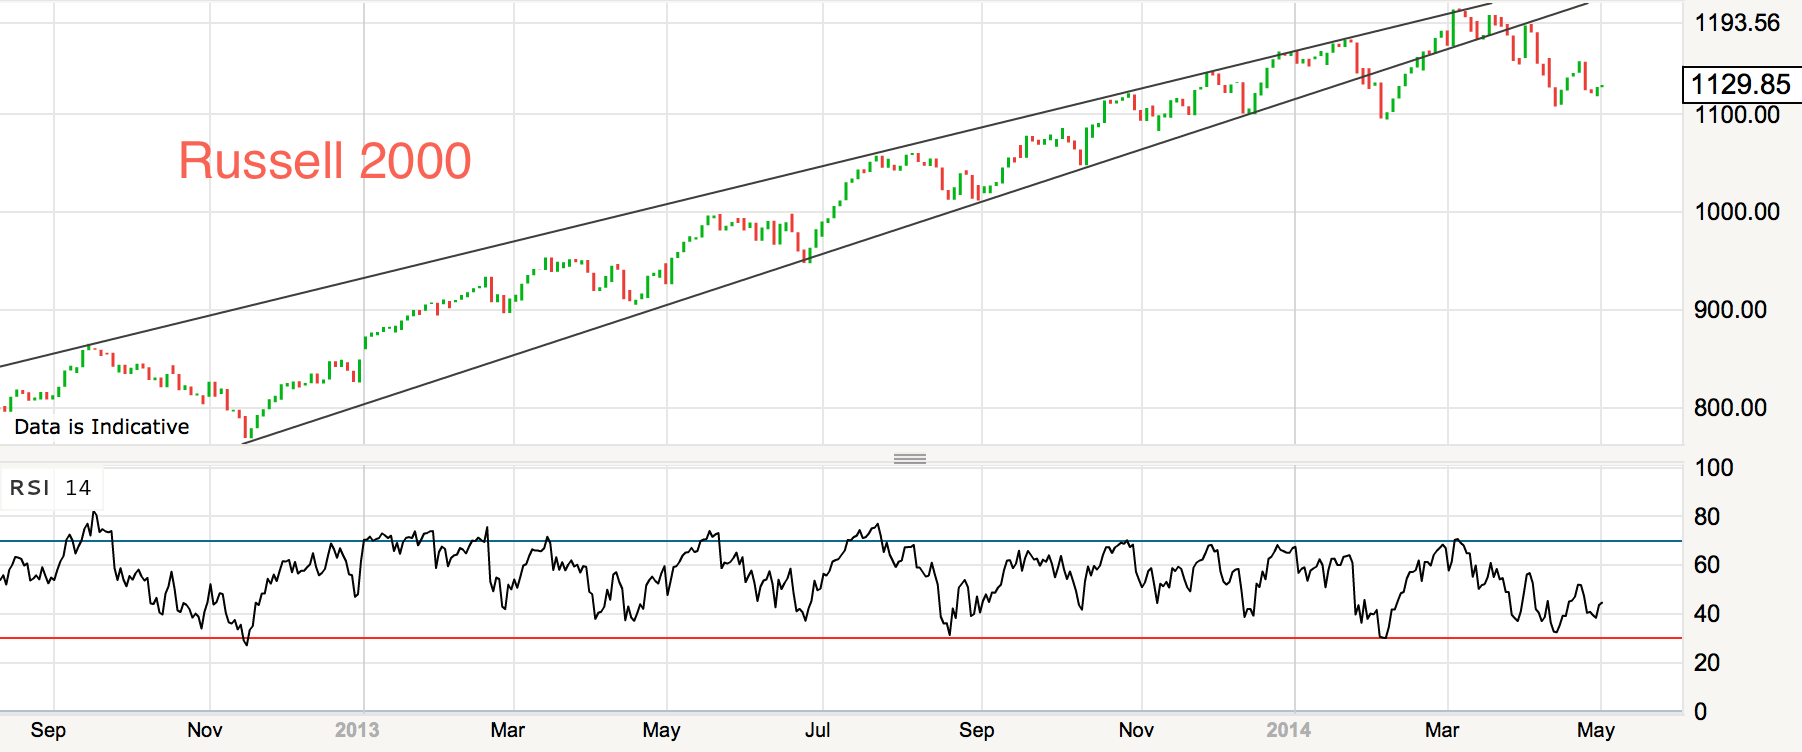
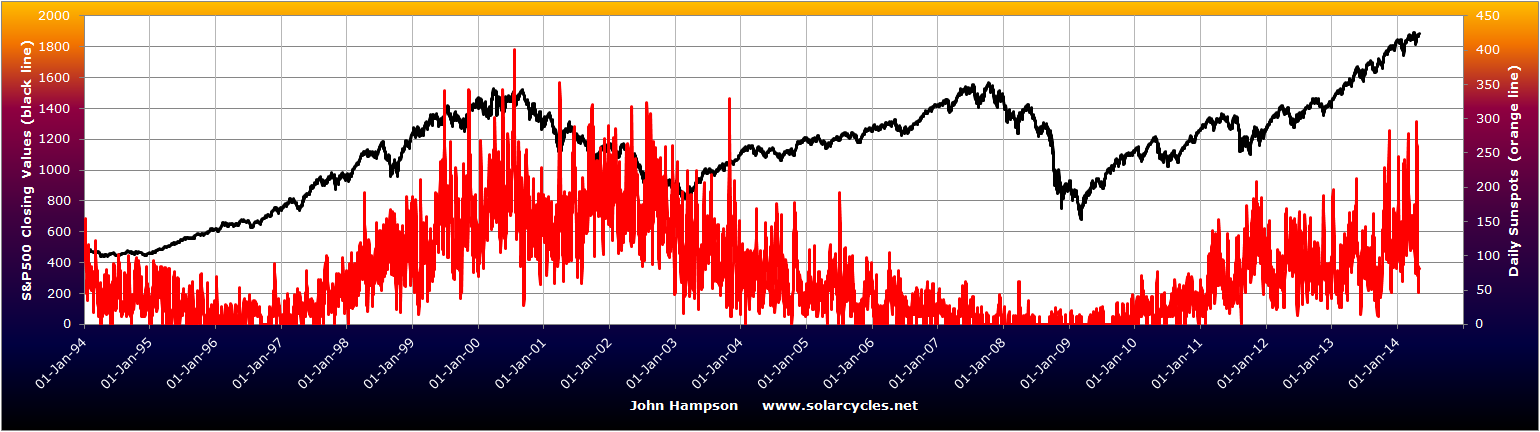
Speculation typically peaks out at solar cycle peaks. In 1989, the Nikkei was the speculative target reaching p/e>80 as it topped out at the solar cycle 22 peak. In 2000, the Nasdaq soared to p/e>80 as it topped out at the solar cycle 23 maximum. Now, at the current solar cycle 24 peak we see a broad range of historic topping valuations in equities but it is particularly the small caps that have been subjected and bid up to the extreme, as the trailing p/e for the Russell 2000 currently stands at >100.
Remove the companies with negative earnings, which is about 20% of them, and it would be 23, which is at the top of its historical pricing:

Source: Andrewunknown
Valuing by EBITDA, the R2K reached 10.8 in March, the highest since 1995.
Small caps are also at the top of their historical pricing relative to large caps:

Source: Alhambra
Similar historical rallies to 2013 in the R2k have been reversed in full the following year:

Source: Fat-Pitch
R2K current historic levitation is demonstrated here:

Source: Gordon T Long
Biotechs have been a key driver of the R2K outperformance, but their parabolic bubble looks to have popped:

Source: Alhambra
Along with Biotech, the Russell 2000 potentially topped at the turn of February into March:
 Lerverage also looks to have peaked out in February:

Source: DShort
Over the last 5 months, the collective performance of the four major US stock indices switched from uptrend to range:

Source: Stockcharts
I believe this is a topping process aligned with the solar cycle topping, so let’s look at the updated solar charts.
My daily sunspots chart shows a higher high but a lower low in April:
The pole-switch progress has been oscillating around a trend that is now set to complete:
 Source: Leif Svalgaard
Nasa and Noaa models suggest the smoothed solar peak is behind us. Solen agree, suggesting a smoothed peak around December 2013. The below forecast aligns with that, whilst allowing for an April peak:

Source: Sunspotwatch
SIDC are still running with their two alternatives. The SC prediction aligns with that of solar cycle 16 progress, which SC24 has mirrored to date. The CM forecast predicts ongoing but plateauing strength into late 2014.

Source: SIDC
Previous speculation peaks occurred close to the smoothed solar maximum and on a spike in monthly sunspots. Aggregating the predictions, the smoothed solar maximum for SC24 is likely to have been at the turn of the year from 2013 into 2014, whilst the monthly sunspot spike so far was February 2014, with both March and April coming in lower.
As things stand, US equities broke out of their uptrend and into a range at the turn of the year and the R2K, Nasdaq, Biotech and momentum stocks all peaked out at the end of February. A February peak in margin debt is also supportive of a potential speculation peak having occurred.
I suggest chances are slim that equities resume an uptrend here following this price ranging, due to the 30 bearish indicators that I recently amassed, some of which are already overdue fulfilment by historic norms. We have a compelling cross-reference of stock market topping indicators (price clues) and solar cycle topping indicators (time clues) in the window of Dec 2013 to April 2014. I believe the Dow’s marginal new high yesterday will be shorted lived: a fake-out.
My biggest short remains the Russell 2000 and I have added to this today. It is the largest trading position I have ever had, so there’s my conviction. NFP Friday a likely market mover, and the start of the lunar negative period this weekend.

Thanks John. I always appreciate you taking the time to penn your thoughts and analysis.
At certain stages in markets different indexes will diverge.. often radically.John has stated all along that his largest position is short the Russell… here is the chart of TNA since beginning of year…. since early march I can find no fault with John pushing the short side… the index IS down for the year,,,
http://stockcharts.com/h-sc/ui?s=TNA&p=60&yr=0&mn=4&dy=0&id=p88199862150&a=331801219&r=1398948193937&cmd=print
Nice analysis. Feels like the economy has painted itself into a corner. Do you think there is a correlation between “strength” of solar activity and “strength” of correction? Or is it more likely just a switch that triggers a polar change?
Not found as such
What do you make of the VIX being so low? Although it seems to have bottomed, it also seems like other peaks had a higher level of fear.
Complacency still reigns
The problem with John’s bearish case is today’s Hammer on IWM, $RUT may have bottomed.
keep an eye on germany dax its at a crucial point and looking bullish, check out the daily chart and its right on the down sloping tram line.
r2k moves above 1160 my target is 1175 before i go short its in c wave up.
Alex: sounds like you’re making Allan’s case. LOL!
r2k above 200dma im long
dow target 16700 next few days
IWM has been making higher lows since 4/15. If you are bearish, do you have a plan? Just making sure.
The end is nigh but another 2% is nigher.
Elliot analysis of SPX by Caldaro places today in iii of 3 of extension II of Primary 5.
Ipso facto- SPX (presently 1885) must see at least 1921. If it turns so low into 4 of this extension then it’s a short leg down before the final upleg which would typically see 1958 as the end of the long term bull, but in reality could be anywhere above 1921.
Someone on the last thread concluded: “we are nowhere near a 2000-type debt divergence.”
Here is the difference, the US economy was in fact fundamentally strong during the secular bull market in the 80s/90s; particularly towards the end of the millennium, common folks even quit daytime jobs to day trade the stock market on large margin which contributed to the margin debt to a far larger extent than nowadays. We just do not see things like that in the current economic environment.
Take a look at the long term chart of S&P500, the volume in fact has been gradually decreasing since the market bottom in 2009. This tells you the difference.
Don’t traders say low volume rallies are not legitimate?
Anybody see why the junk market sold off today in the face of a very strong Treasury bid?
Dividend payout…
Great charts and insight as always John. Here is some info for your demographic study http://www.mybudget360.com/young-broke-americans-young-living-at-home-percent/
Thanks all
Chart of new highs at the new high:https://pbs.twimg.com/media/BmjVoxgCUAAFdsz.jpg:large
Thanks John. Excellent analysis as always and I like to come here because I love to see the charts of the sun’s activity.
NFP may be not a market mover, however, if in similar environment in the past 12 months Thrursday before NFP was a range day, NFP Friday session had a decent range of 175 points on average in the Dow ( from 100 points in Dec 6th 2013 to 250 points in Apr 4th 2014). I am affraid that long weekend in UK may dampen all attempts, so that we may wait for some action till next week : flush moves on Tuesday, and trend day window opens next Thursday.
Excuse me John, I thought you wrote ‘unlikely market mover’.
Complacency peaks in July, and it’s around mid year that the stocks either stall or correct, even top out. As far as google and my memory can reach.
http://www.google.com/trends/explore#q=stock%20market%20crash&cmpt=q
What stock market breadth is telling us: http://traderfeed.blogspot.com/
“All of this is consistent with mature bull market cycle behavior, but it is not clear to me that we are on the cusp of any bear market. The absence of broad strength does not necessarily imply the presence of broad weakness.”
Thanks for the link, the guy is O.K.; usually when I see Ph.D or other insignia I run away.
Personally I think we grind higher and maybe see 1950ish on SPX into May/June timeframe. Patience and care is key imho….
J
With the reported jobless rate falling to 6.3%, does this mean the Fed’s employment mandate has been met? Will this be enough to signal the end of the Yellen put? We shall see.
when the employment numbers started improving they said they would look at other factors instead!!
Employment is a trailing indicator. In other words, it is part of the topping out process which occurs against a background of good news. Initial jobless claims tend to be a leading indicator.
Tops. Gold topped in Sep 2013. It spent the next 14 months trading between 1550 and 1800. The last rally broke out of a triangle downtrend and above the 200 moving avg. Looked for all the world like the bull mkt had resumed. It took several more months before the crash to 1200. Stock market tops can be even more difficult even if you don’t listen to the new. Crash from tops obviously happen but are rare.
From the Economic Cycle Research Institute:
US Future Inflation Gauge Up: USFIG ticking up to a 1-yr high, underlying inflation pressures are starting to simmer.
Yes, TIPS (Treasury Inflation Protected Securities) is breaking out:
http://scharts.co/1i8FBhW
I was bullish going into today as you all know, but I was flat, but now I see bad things so I shorted at 1890 SPX. Good luck to John now.
Specifically, triple top on Dow still valid. Also saw double top in Dow transports. But if these highs are broken I am out with small loss. Always keep loss small is most important. I don’t blame manipulation and never have to since any loss I take is very small.
Most trades if they are right work right away. If you have any drawdown your trade is wrong and you should get out.
Moving stop to breakeven SPX 1890. No risk. Good luck to bears.
I am not as bearish as John, so don’t get your hopes up about some kind of crash, in my opinion.
Just posted on my bearish case and as always very good analysis here
http://www.marketoracle.co.uk/Article45426.html
I also had sell signals at the end of first hour of the session but as a swing trade; the market (Dow) likes it here, it’s Home, level-ridden between 500 and 600, shall the price attempt to break below 500, I will reenter.
http://www.bloomberg.com/news/2014-05-02/tom-demark-says-u-s-stocks-at-risk-of-11-decline.html
John, I need a refresher, how do you compute this again? “the start of the lunar negative period this weekend” I poked around but couldnt find the info on your site. Thanks.
Negative lunar period: buy on the 4th day after a new moon, sell on the 4th day after a full moon.
Thanks for replying. I read that on the Lunar page, but when does it become positive I wasn’t sure if it was tied to geomagnetism seasonality or not? If I do the inverse buy on a 4th day after a full moon and sell on the 4th day after a new moon – bound to not see gains but losses? In general I got mixed up in my head what marks it positive versus negative. Negative equals new moon to full moon and positive is the full moon back to the new moon. In terms of waxing and waning? Thanks John.
Ok, bought the Dow at 494. The price failed at 600, failed at 500, let’s see how far it can ride; 5m 20ema was containing the price for 25 minutes. – What are you doing, – I thought – 20ema will fail as 10ema failed. Then came 20.00 hours train, and the price touched 50ema. Now I am after bears’ money:)
@T_TRAD3RZ Dont be fooled by any weakness today, were not there yet. http://tradingview.com/x/uUCWK7f7/ http://tradingview.com/x/qCbNSSLN/ #WallStreet
Thanks everyone
Hi John
Solar maximum (13 month smoothed SSN) has stretched into 2014, now projected around April.
Historical data suggest that DOW mothly will either top near solar maximum, or ~1 year later. So either right now (April-May) or in 12-18 months.
more correct would be stating that DOW wont top out in the months 1-12 after solar maximum (based on history), so either before or after. Which means now or in a year or more. Given that solar maximum doesnt stretch further into summer-fall this year 🙂
Click to access GMO_QtlyLetter_1Q14_FullVersion.pdf
Jeremy Grantham of GMO suggests roughly same 1998-2000 cycle which I also believe seems to be playing out.
Read Page 10 wherein he guesses weakness from Feb 2014 to Sep 2014, strong Oct 2014 to Apr 2015 and beyond (may be up to 2016) with S & P 500 target of 2250+ and then burst of bubble.
My tidal force analysis now says a significant top 6/7 may and then down to august 10th. Then sideways for a double bottom until September 10th, Then the uptrend starts again. Seems to confirm the post above.
The only way there will be an uptrend is if they taper the taper – otherwise it’s a series of downdrafts with minor bounces.
http://seekingalpha.com/article/2187593-falling-nyse-margin-debt-not-yet-a-sell?ifp=1
Dittoing dots…
From the 2014 top seller ‘Capital in the Twenty-First Century’ by T.Pikkety as translated…
The Central Contradiction of Capitalism: r > g
conclusion extract…
“consequences for the long-term dynamics of the wealth distribution are potentially terrifying”
[but for our here & now the sleeping dogs are supposed to lie – forever & always]
Just some more dots leading down the same path that only few see
High concentrations of wealth are the major cause of depressions. Think of the Middle Ages, the USSR, the Ukraine, Middle East, strongman South America, the US in 1929 and now. It is hardly ever mentioned as the prime cause.
Money always has to find a home. Where there is excess then bubbles are automatic, as one dies another starts and money moves there. The only question is where is the next bubble – the most beaten up assets are commodities so round and round we go.
For anyone with some time on their hands, the comments under this article reveal a lot about current sentiment in the precious metals markets. http://traderdannorcini.blogspot.ca/2014/05/the-gold-cult.html
It seems many of the proud self-professed “stackers” (“I will NEVER sell my silver”) are angrily bailing out now, and the blame-game has started. There’s an urgent “get out while you still can” mentality setting in.
All strongly indicative of an impending bottom. (None of the comments are mine by the way, despite the similar names)
Great article once again. It is ofno coicidence, as I have said in the past, that the most speculative of the speculative bubble will burst first, as it did weeks ago .
And yet just about every single investor come finance writer/analyst has failed to acknowledge the fact that indeed the stock market bubble has burst and indeed, Biotech is leading us down.
BTW let us see how they defend the 50 dma on the SPX?
As time goes on the more it pierced to the downside the more crucial it will become to get it back above that level. Particularly as the choice becomes between that or From this sideways action to new all-time highs.
Lol, have the Fed been caught out yet AGAIN? Nothing would surprise me.
Click to access groenewegen050514.pdf
True. How do we know the Fed is really tapering when no one can audit the Fed? It may sound foolish but, notice that nobody questioned it within the mainstream media.
And gold still looking bullsih to me, in fact even more so than last week. The weekly MACD continues to climb off its 2013 lows and if it crosses into positive it will be signal for me to double up.
http://stockcharts.com/h-sc/ui?s=GLD&p=W&b=5&g=0&id=p21768294155
And the Dow back at 500. That gap down was a bear trap. Low volume, on a Monday, long weekend in UK, the move up off 375 was screaming ‘there’s more to come’. Intevention? Bears look so desperate at the end of open drive, ‘do we have enough ammo, boys?’ and the liquidity providers bought them all:)
If that was an intervention, I am one of them interventionists.
I don’t know Kris Puplava, but as in chess, after few moves you know who is who.
The guy uses 52 week new lows to include in his market study, which seems logical. It’s not my type of analysis, but it paints the same picture I see in the charts.
http://www.financialsense.com/contributors/chris-puplava/consolidation-top-key-watch-points
This is how the 52 week new lows look at the top.
http://www.financialsense.com/contributors/chris-puplava/market-tops-are-a-process-not-an-event
Allan calling for a crash again, talking about bubble bursting. Give me a break. This morning, $RUT tested 200-day MA, lot of buying emerged again. Draw a trendline connecting the last two lows on $SPX. Notice That level is 1872. Notice no 15-minute closes below it. How can anyone stay bearish is beyond me. If you can’t make money in this tape, you should not be trading. Very simple setups and very simple to trade.
Alex, mate attempting to scalp a few extra dollars at what is clearly by virtually ALL historical indicators a major top is not my trading style.
The time to have traded long in safety has come and gone.
Remember buddy, “major tops are a process, not a single event”.
Tuesday is always up… just saying.
Tuesday was a good day in the past months, but I have checked randomly a few months of 2013 and in two monthsTuedsday was the worst day in terms of NYSE open below NYSE close. Summing all checked days up, the best day was Friday.
So ‘Tuesday always up’ is curve fitting; we may have in the near future 3 down Tuesdays in a row.
Alex you have very short term views whilst most on here are thinking a bit longer term. Yes it does look bullish right now but we are predicting it will turn bearish in the coming weeks and months so be a little more considerate to others views. I think tomorrow will be up keeping with the trend and I will short at the end of the day for a decline the rest of the week. Russia turns off the gas on Wednesday so fireworks may start.
I am still long from 1870 SPX. There were only two Tuesdays this year in which stocks went down so staying with that. Stop at breakeven now. No hourly close below the hourly trend line means only logical trade is long. I mentioned last Friday that the right trade (if it is the right trade) works right away and this one is no exception. Did not have any drawdown from entry, so stops could be moved up fairly quickly.
If you are short because of Ukraine, then consider the market is already saying Ukraine doesn’t matter. News does not matter. There is a great deal of support beneath, including: 1) 50-day MA at 1860. 2) The “2013 close” level of 1850. 3) The Last low 1850. 4) The trend line support showing higher lows since the April bottom.
Mate I doubt anyone here, like myself included, is short due to the Ukraine. With all due respect that statement in and of itself indicates to me that you have little understanding of what the majority here sees as what constitutes a cautious approach toward the market and a probable major top.
John has spelled it out pretty clearly in previous essays and most here agree with his views. I believe time will justify his and our approach. Again I add, attempting to scalp a few dollars at these clearly absurd valuation levels, in light of all we know from history, is foolish, but each to his own.
Just to add, I never view markets based upon geopolitical events, with the caveat being, unless we get WWIII, which I highly doubt. Putin is bold, but he ain’t stupid.
Caldaro has target of 1970-2070 by Q3 of this year. That doesn’t sound like “scalp a few dollars at these clearly absurd valuation levels”. Who says these are absurd valuations? By what measure? Companies are buying back their stock and earnings per share are nowhere near bubble levels.
Buffet Indicator, the 2nd highest in 50 years:
This is such a great place for exchanging ideas.
Why would anybody try to ruin that by trying to get others agree with them
Some corporations do hire people to discharge [mis]information, messages and reviews, etc. based on their agenda, people like such are all over the internet forums.
Caldaro has target of 1970-2070 by Q3 of this year. He says we are very close to confirming a wave 3 up of Major 5 within Primary Wave III up. If you are a bear, then by all means, just know at what point you are wrong rather than sit in a losing trade and blame POMO, Fed, valuations, bubble talk, HFT, algo, etc.
Caldaro has a history of calling for 3rd waves up at major and intermediate tops. Look back as his historical posts and you’ll may notice that he doesn’t hold the most accurate forecast record. FWIW
Scalping a few dollars…I had 3 trades yesterday, 2 winners, one BE, 92 DJIA points profit. And as almost everyday, I go to sleep without thinking about the market and opened positions. I never roll over a losing position. I sometimes roll over a winner, if HTF tells me so. Good sleep is essential for my mental performance. Scalping a few 92 points a week, a trader can make a good living. I see no logic in thinking hard where the market will go next, when it doesn’t seem to be going anywhere, I prefer to out-box those who jump into the market believing that ‘yeah, this is for real’. like yesterday. If a boxer wants to win a match, every tillte punch matters, you won’t win by waiting for the knockout punch, doing nothing, especially ignoring what your opponent is doing round by round. Home run will happen, but not when your strategy is looking for home runs.
Sorry Allan, to make any money, you have to take it from guys like me. I am just average, I’ve seen guys I am no match for. Whinging doesn’t get you anywhere : evolve or die.
Hi Alex you state:
“Companies are buying back their stock and earnings per share are nowhere near bubble levels”
Mate that is absolutely one of the reasons to sell. Management are buying back shares to support earnings so they meet their targets and they get their bonuses.
Share buy backs have been financed by debt issuance due to low interest rate policy instituted by the irresponsible Fed.
Those same “insiders” are selling at record levels becase they know that valuations are based upon nothing but easy money and not upon real growth.
Did you even see the latest GDP figures. The market did and completely glossed over them. That is not the sign of a healthy market. That s the sign of a wildly speculative market.
Like I say, each to his own. I am not asking you to agree with me, just to understand why I have my opinion. Not to just dismiss it as some lunacy because you think the market has to go up just because it’s Tuesday.
despe, nobody is whinging mate. Attempting to make a point. Letting off a bit of anger last week maybe, but by and large trying to see things rationally.
Hi All
I have followed John’s bloggs, virtually on a daily basis right from the beginning,and not only have I thoroughly enjoyed his journey I have also benefiited from his ability to collate information and trade with it in a controlled manner. Most importantly even though I have never met John face to face I have seen enough of him online to know that I like him….. I also respect the efforts he makes to add value to a wide community.
Apart from the fact that John is a great trader – I have seen that over many years – his ability to produce so much content has sometimes amazed me. I have always had to tell myself that of course he was originally an IT whiz before a trader/analyst in a vain effort to make my own inadequacies seem less.
I have been lucky enough to have been a pretty successful trader myself over many years which has enabled me to buy houses and educate my children privately and live a very comfortable life. Ive seen many traders come and go. I recognise when someone is successful and sticks to their knitting. John is that. He is not always right – nobody is.
It is very rare to have “a John character” prepared to offer his analysis for free and at the same time to lay bare his trading. Even the best traders get things wrong, at least for periods, and this, even with good money management can be a very dark place. Anyone who has done this job for a long time will know that that’s what comes with the territory but it’s not easy.
I”m probably sticking my neck out here but I feel as if certain commentators on this site, who have appeared over the last 6 to 12 months, are posting without considering the style of discussion that John has encouraged. His style is non personal and his views are backed up with analysis that he demonstrates. He is totally open to conflicting opinions but I sense he would prefer it if these views were substantiated with an evidence based approach. Furthermore, If somebody was to send him an email with a full analysis that contradicted his own view, I feel sure if John felt it was well put together, he would even post it as an alternative view – he is a very grown up man.
I think it is best to comment when yo have something to say where you believe you can add value to this very special community.
By adding value I do not mean agreeing with John every time he posts. I mean offering some information or opinion with well formed analysis that is of use to others. Nobody, including John, needs YES men/ladies ; nobody needs people boring us with how they bought it at 70 and sold it at 90. We’ve all got millions of those stories and they should only be shared with your dog.
if you have something to say…say it …..but back it up with demonstrable facts in a narrative that others can benefit from.
I’m sorry for this off topic post but I felt this needed to be said.
Have been restricting myself to writing the posts and answering direct questions, so thanks to Will for this (+ compliments appreciated)
Well said.Despite my warnings at the tops in 2000 and 2007 I was unable to find the words to help my family and friends to exit their investment positions. The great gift of John’s work is I now have a place to refer them that shows the danger of this market in words they understand and have heeded.I am grateful..
Well said, Will. I remember you had a website, I used to have it bookmarked, but later the website was removed for some reason. Do you still run a blog?
John, thank you so much, this place is indeed a very special community as Will said.
Brilliant post, Will.
Looks like this stupid Tuesday is always up trend is ending at last!
I would not be so quick to say such a thing. Remember that the current pattern is to bottom within the 10 to 11 am eastern time period and rally rest of day. So far today’s low occurred right at 10:10 AM.
Well said Will and slater!
Just to add. I still see the potential for a “diamond top” unfolding. A very powerful reversal pattern if it follows through.
http://stockcharts.com/h-sc/ui?s=$SPX&p=D&b=5&g=0&id=p15612080840
Let’s be completely unbiased here and see what price evidence is there for bull or bear case. Since 4/30, if you use hourly chart, you see long tails on candles for prices below 1875 SPX. On IWM you see long tails above 200-day MA. That means that price spends very little time below 1875. It is like holding a beach ball under water, it pops to the surface very quickly.
So far Tuesday’s odds of being positive is 90%. I added more longs today to my position from yesterday.
Wow that trade worked immediately. Longs all green. Time = 10:30 AM at this time.
So we bottomed between 10 to 11 am eastern again just like every prior pattern. Sell off in the morning, rally rest of day. I will hold all longs to end of day and sell some at the close.
It might rally at end of the day but i’d be amazed if it finished up today.
Well one of us will be amazed but it is money management which is most important to a trade. The low came in right at 11 AM. So I will put my stop there. Small loss if we go lower. Always keep loss small, being wrong should not be a big deal.
Bought a cheap binary for Dow to finish up today. Great risk/reward in that but am pretty confident it will be a down day. Still holding all my short positions and fully agree with John about a sharp decline soon.
What is the consensus on biotech? Still the most likely bubble to pop? What factors, if any, could cause IBB to reach new highs?
The parabolic looks definitively broken, and usually these things take a long time to repair. IMO, for it to retake the parabolic, we would need the solar maximum to extend and for margin debt to make new highs.
Comments on demographics from a professional trader (for readers of this sight, the following is nothing new but I still think worth posting):
Demographic Trends
Yesterday there was a Harry Dent conference in Los Angeles. For those not knowing Harry, he applies demographic principles to help gauge secular market trends driven by spending patterns. Baby boomers are the gorillas in the demographic space today. On average individual peak spending is age 46 with minor adjustments for different countries. He takes the immigration adjusted birth rates and shifts by 46 years to estimate peak spending for each country. Japan was the first major economy to go over the demographic cliff around 1989. The cliff is defined when the average individual reaches an age when spending peaks and then start spending less. The USA peak was next around 2007. Germany has a larger cliff than Japan and begins downward spending this year. Korea is like Japan on a 22-year lag. Buying patterns of baby boomers probably means that housing net demand will go down starting this year and continue down for decades. Also mentioned was the Chinese property bubble, the largest bubble in all of history.
We talked about how prior to 1989 Japan was an economic juggernaut that just fizzled out when it went over its demographic cliff and now has a coma economy, a bug looking for a windshield. Think about the repercussions for Europe with Germany reaching demographic headwinds this year is like Japan in 1989.
None of this bodes well for a continued long-term upward move in the market nor does is suggest that the QE process will ever be successful; it explains why QE has not generated significant inflation. QE has been fighting an underlying deflationary trend.
The few bright spots I noted were the following:
India, Mexico and SE Asia have positive oriented demographics. Overall spending may drop when the average man reaches 46 but health care spending peaks at age 74 and cruise ship vacations peak around age 70 suggesting pockets of activity going forward.
Most of this is explained in his most recent book The Demographic Cliff, published this year.
Are you aware that SPX is still above 50-day MA? Just saying. I am currently in cash, looking to buy as close to 50-day MA as possible tomorrow if it tries to bottom before noon again. For the same reasons I mentioned previously…There is a great deal of support beneath, including: 1) 50-day MA at 1865. 2) The “2013 close” level of 1850. 3) The Last low 1850.
We didn’t even take out yesterday’s low. You would think a big bad bear move would easily cut right through it. Anyway…
Any trade bull or bear is OK as long as you have a stop, so best of luck to you all.
Alex jst a few suggestions:
1. Look at fear levels with todays move. Hardly budged, almost total complacency.
2. Check out volume the last few days.
3. Check the Nasdaq. Its largely been the leader in recent weeks.
4. Check the Trannies. No confirmation of the prior days bounce off the 50dma in the DOW
5. Check new highs vs new lows for the last two trading days
6. Finally. Be very aware of the potential pattern unfolding on the SPX
Regards
I probably should have added a 7 as well:
Not withstanding the above checkout Biotech. The evidence is empirical. The Biotech bubble has burst. No new highs now that it is done and dusted.
A study f the weekly shows the current situation. A back test of the long term uptrend. A bearish weekly flag on diminishing volume. A break below the 50 wma coming.
http://stockcharts.com/h-sc/ui?s=IBB&p=W&b=5&g=0&id=p62811968745
Thanks to all