

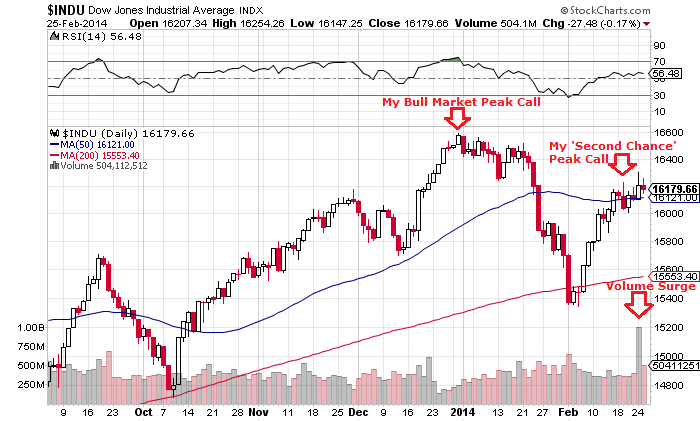
1. Dow daily candles and Monday’s volume print at high reversal:
 2. Nasdaq 100 and breadth divergence:
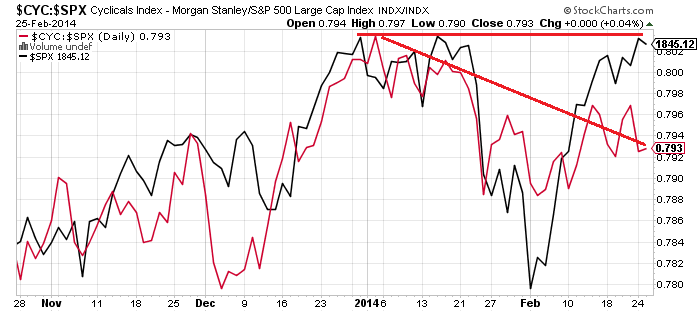
 3. SP500 and defensives outperforming cyclicals:
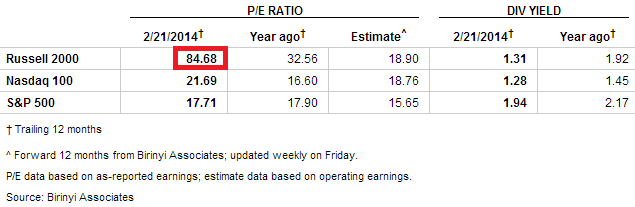
4. Russell 2000 (my largest short) P/E:
5. Gold outperforming stocks:
 6. Treasuries outperforming stocks:
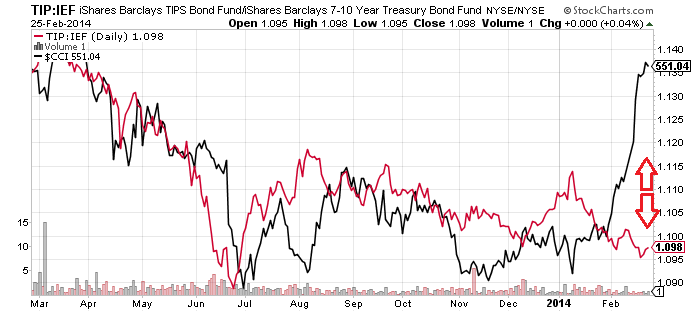
 7. Inflation expectations cast doubt on longevity of commodities (CCI index black line) rally:
 8. Smart money sold into 2013’s equities rally and outflows accelerating into this month’s upleg:
 9. Rydex bull ratio exceeds levels previously associated with significant corrections and 2013’s anomalous levitation raises risk of sharp collapse:
 10. Put/Call ratio (21 day average) also exceeds levels of previous significant corrections, and at best suggests period of consolidation with downward bias ahead for equities:


Nice work John
Thanks Mat
Yes, great work, dear John…! Greetings from Basel, Switzerland. I have been following your work since Amalgamator.
John, great analysis. One way to get to the waterfall decline would be from an Elliott Wave perspective. The typical waterfall occurs after the completion of an ending diagonal. To make it even more exciting, one would see an ending diagonal for the fifth leg of a larger ending diagonal. Avi Gilburt has an ending diagonal count going. Now to complete the fifth wave of that count and you may see a waterfall decline that would catch everyone by surprise. https://www.elliottwavetrader.net/images/charts/full-j5zdopWJt0BfRuqgznAh9.jpg
Thanks Peter
thanks…
…welcome
Fully agree with John’s consummate analysis. There really doesn’t need to be a single catalyst for a huge decline to take place. The evidence is all there in the charts. This is a multi-decade market top in the final stages of formation. To those who watch the overnight futures, frankly, they mean nothing, other than to those who trade them. I’m withdrawing $500 a day from the toxic banking system and buying physical gold and silver like there’s no tomorrow. All the coiled inflation in stocks will eventually flow into precious metals and commodities. Great work John, and thanks for allowing us to express our views.
Simon,
“To those who watch the overnight futures, frankly, they mean nothing, other than to those who trade them”
They mean nothing until they mean something. The fact is that currently futures indicate an open back up near all-time highs for the SPX.
Monday’s break was uneqivocally bullish and yesterdays action smacks of a test of the break if we get follow through buying today and new highs.
I for one, regardless of howbearish things look, will wait for price to confirm to me when the market has topped and reversed.
I’ve been around long enough to see several blw off moves and I always remember the following quote from JMK:
“the market can remain irrational much longer than you can remain solvent”
US-Futures still up and European Indices down, expecially emotional frontrunner DAX. That’s how is has to be and remain to signal in trend change.
“the market can remain irrational much longer than you can remain solvent”
Dead on. That’s why I bought Leaps for January 2016 puts on the SPX on december 31st. Can’t pick the tops, but it will coom soon enough.
Moves generated by underlying exhaustion vs news catalysts are better as they are more real.
Allan, Monday certainly looked bullish and most certainly felt bullish. It also looked like a false break-out smashing the poor shorts stops. The market also is in a long term very bearish megaphone formation as well as a short term one plus all the bearish indicators John has pointed out. You are absolutely right to wait for price confirmation which per the megaphone a close below 1836 on the S&P. Even doing this during 2000 and 2007, I got beat up pretty good before it finally really happened.
Thanks Simon
Moves generated by underlying exhaustion vs news catalysts are better as they are more real.
Investors Intelligence bull-bear spread back up to 36: the dotted line on this chart:

Martin Amstrong just published sheets with the weekly signals of his computer program for DOW, gold and euro. A directional change is on schedule this week for all three. Not that this signals are working all the time, but since I’m watching them at least the weekly DOW signals are more often then not correct. The predicted panic cycle for the week 31/03 is also conform with Johns historic comparisons.
http://armstrongeconomics.com/armstrong_economics_blog/
For what its worth here is another indication, in my opinion, that trouble is on the horizon. The yellow line is the COT Normalized Small Spec net position, when they get very long more often than not SPX is usually near a intermediate to major top.
FYI – DeMark calling now for 1885 and no more crash.
http://www.bloomberg.com/news/2014-02-26/stocks-so-many-love-to-hate-buoyed-by-yellen-s-priority-on-jobs.html
lol…all is well then.
DeMark is a has been…he’s been wrong for about 200-300 SPX pts now..why he gets any press anymore is beyond me.
When Demark started out over 30 years ago he ran a small trading service called Futures Forcast and I talked to him The insights he gave me then I still use almost on a daily basis in my trading. I am glad i talked to him 30 years ago.
There are only 4 or 5 market gurus that have been consistently right over long periods of time. ie, don’t be so harsh.
John, any thoughts on high yield debt continuing to show no divergence? In the past tops it has diverged in price vs SPX.
When I looked it didn’t so compelling as a leading indicator. However, I’d add that corporate debt has been driven to historic extremes as investors have piled in, with the corporates then using a signifincant portion of the cash for equity buybacks, encouraging the maxing in equity markets. In short, I see it as part of the problem: investors are all in and all eggs are in one basket: corporates.
Thanks all.
Yesterday saw another failed breakout attempt in US stocks. I have a case for the market to be rolling over, so let’s see how this week ends. If conversely stocks do muster a breakout close, it would likely be on multiple divergences, and I would expect it to be short lived. I would then look to a roll over after this weekend’s new moon. However, my primary scenario is that downside resumes before the week is out, and if that occurs I would want to see some sharp selling into Friday’s close to set the scene for a potential big down day on Monday. So let’s see.
….how nicely the DAX is paving the way!
The more we churn sideways and consolidate. The odds would favor an update rally vs substantial decline
Futures gone from +60 fair value on the Dow as of 3am EST to -69 fair value as of 6am EST. Could be an interesting day ahead! Good luck all.
I’m “Yellen” for a new high. HERE WE GO. Not even the potential for another Cold War can bring this market down.
I’m afraid you missed the start of the “Cold” Nato-Russia-China war and won’t believe it, if you wake up in the midth of a very real hot one.
This leg up has been brutal. Today’s price action will be interesting regardless.
February 25, 2014
Slater9, can you please expand on pugsma’s expertise and the EWT? I couldn’t find the public post; it all looked like a sub to me. Then I saw your post that it had been withdrawn. Thank you for any additional feedback.
Keep in mind that whatever I say about PUGSMA includes that fact that after being an invited poster at his site I was tossed from his site.
For a long time I saw little value in ELLIOT WAVE.Then I saw the work at PUGSMA
and it changed my view…The work there is done strictly by the rules AND he ALWAYS has an alternate count…Based on the work there , I now keep my own elliot.I wanted traders to see his charts when he briefly posted then publicly by mistake. They showed the view of the coming top by the best elliot analyst I have seen..I thought traders who are looking to get off the BIG SHORT would like the imput of an analyst who has had this price level and slighty above as his target for years..
If interested, Pugsma has a public post on stockcharts where he follows GLD and the S&P. The link is http://stockcharts.com/public/1696337
PUGSMA’s price target for GLD in what appears to the 2016-2017 time frame is 77.49, which invalidates his S&P 500 price targets. Billionaires who got rich by correctly predicting gold’s price movements, such as Eric Sprott and Doug Casey, are incapable of being that wrong about gold. And I retired at age 35 due to having a certain unusual prescience about precious metals price movements as well. Trust me; GLD will never see 77.49 again. (And by the way, GLD and SLV are total and complete frauds and the public will eventually find that out.)
D.J.
What do you advise then? If GLD is fraud, should we still buy it or should we buy the physical gold instead?
Kasi, DJ is absolutely correct. The so called “vaults” of GLD and SLV will become crime scenes. They are almost certainly empty of metal. Buy physical metal and take personal delivery.
Thanks Simon.
This came out right on time…
http://finance.yahoo.com/news/gold-fix-study-shows-signs-090756962.html
Simon nailed it, Kasi: Buy physical metal and take delivery. Keep it in your own possession.
John,
should have seen some weakness but looks like there is always a bid every dip is aggresively being bought. Does this bheaviour change your thoughts.
I cant understand whats wrong with your approach it should very much work and positioned accordingly.
bill
Refer you to my new post
You are wrong, the market is going a lot higher. I think nasdaq at 6000 and S&P 500 at 2200 are reasonable targets. You should cover your shorts.
Hi John! Just want to say thanks for sharing all your great work. I have been reading your site for a long time but never left any comments as my style of trading is very different but none the less I still find your analysis very interesting and of high quality. This is something that is very rare within the financial blog community and I salute you for sharing your work and for being a great man!!! Ultimately I do believe your ideas will play out and the current price action is perfectly logical with the intent of shaking out as many weak hands as possible before price heads down.
Thanks Bert
Slater9 and Cal
Thank you for sharing this information. Slater, I have scoured the web to find a consistently accurate EW guy. Was basically disappointed. Do you have an opinion of Neely’s work? You probably know about the following but thought I’d post it anyway in the spirit of sharing info.
https://www.elliottwavetrader.net/
Also, have you seen the following? Looks similar to Pug’s. Scroll down to his
SPX
http://www.safehaven.com/article/32870/spx-weekly-technical-and-elliott-wave-analysis
Cheers.
This IMO is the chart the “bulls” need to watch carefully. Unless the Trannies can reverse this higher into weeks end then things could get very interesting next week.
http://stockcharts.com/h-sc/ui?s=$TRAN&p=W&b=5&g=0&id=p36888874656
Hi John,
Many thanks for your analysis so far. Would appreciate your thoughts after yesterday’s price action.
Refer you to new post
Hi John,
Following your work with interest. A bit tangential, but as a solar guy, I wondered if you had come across the Electric Universe (and hence Sun) theory. Check it out, if not. A quite good intro at: http://www.thunderbolts.info/
Thanks Matt. Looks interesting, have bookmarked it to have a proper read.
Nice VIX/SPX divergence to throw in the mix also – http://scharts.co/1ceOLNN
And the monthly view… http://imgur.com/DnpJGIW
Thanks for your input all