

1. Nasdaq Big Money Shorts:
 Source: Sentimentrader
2. Percentage Of Indicators At Bullish Or Bearish Extremes:
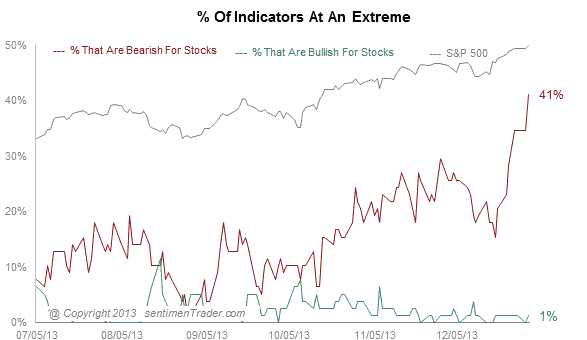
Source: Sentimentrader
3. NAAIM Sentiment Survey:

Source: PensionPartners
4. Margin Debt Relative To GDP:

Source: GuruFocus
5. Lunar Geomagnetic Model January Peak:

6. Citi Panic/Euphoria model further into Euphoria (to +0.6 from 0.52):
 Source: Barrons/Citi

John, thank you very much for your geat work I have studied during the last months. Your [5. Lunar Geomagnetic Model January Peak] could be a 1:1 copy of my S$P500 cycle model. Very intersting!
Lets see how it plays out.
Have a great week.
Roland
Thanks Roland
On 12/23 John invited traders to make the case for a continued bull market.I could not and so far no one else has stepped up to make the case based on their tools.As a trader who relishes the short side and trades long out of necessity nothing would make me happier than for John’s work to be confirmed.All I can add to the conversation is where my tools are right now..
The most glaring lack in my work is this….Usually at larger swing turns my scan of longer term charts of hundreds of stocks has 80% or more on buys or sells based on the tools i use… simple concept… i am looking for the parts to confirm the whole…Right now i have only 2 stocks on long term sells!This is the major lack in my work..
The 12/31 high was important in my work… short term sells were given in2 of the 5 etf’s i track…At this morning’s high, all 5 triggered short and price responded….close below price are levels if broken would say something bigger is in place…
What do you think is going to happen based on your tools? John’s work is compelling..what would be ideal for my tools to align with John’s work would be for a sharp sell off to be followed by new highs… I simply do not have enough info yet to say if I think this is the beginning of that sell off.
@slater9, John may not like what I’m about to say, but I have somewhat said it before which is why I never reposted after the 12/23 challenge. I’ll say it in a slightly different way this time. Take the difference between the 2007 highs of SP500, DJIA, and forget markets ever fell from those highs but were paused frozen for 4 years. Then they thawed and started to gain traction for the past 3 years. That would imply a bull market that is only 3 years old with heavy influence from buybacks and global QE in US, Japan, and China. If France enters a triple dip recessions, will ECB start QE or sorts? Spain is in trouble. Earnings about to come out likely to disappoint. Not bad, but will not match enthusiasm present. Taper over here still implies large QE still for remainder of this year. If Iran deal reached and U.S. energy output reaches new peaks, energy may cheapen enough to damper inflation. Think its going to be lackluster year, continue to be a bull market, and test old theories and warning flags that function pre-QE and post-taper. I really do not foresee the triggers John is mentioning triggering any type of major crash. Think the thresholds needs to be set higher then one feels the itch to scratch.
Thanks guys. A ‘devils advocate’ post seems appropriate, looking at the bull case and talking about what’s missing in arguments for a top at this point.
12/31/2013 I think the indices will continue to rise into the middle of January. Think momentum. Bulkowski
Robert, do you then expect to see a correction? If so, of what magnitude?
I think we might get 1999/2000 squeeze through the year and then finally John will be right and we retrace to where we broke out last year in SPY. But this is just craziness as I do not predict but it is a roaring bull market and the reason behind it is not important just profit in and out. =)
Hi John
Is there any correlation between interest rates and the solar max?
Interest rates started this whole thing. They have to go UP a lot more to stop it.
regards
bob
Yes – see chart in last post – interest rates usually rise – tightening against excesses. Rates are suppressed but yields are rising globally.
Thanks John,
I never saw the chart.
Blind as well as deaf
bob