

Major global equities breakouts or reversals, at these combined key levels?
 Source: Chris Kimble
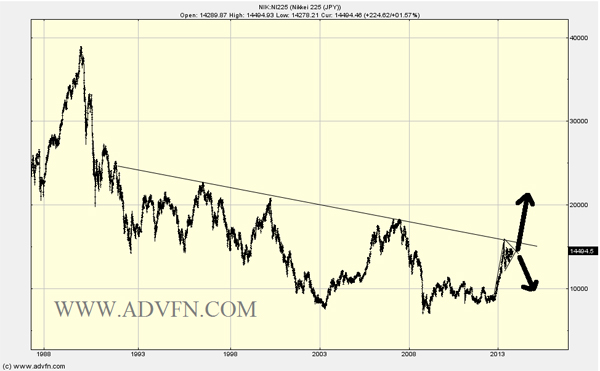
India’s Sensex is also flirting with a long term triple top, with peaks at the end of 2007, 2010 and now. Japan’s Nikkei has broken upwards out its consolidation range, and looks likely for another retest of long term downward resistance, joining the other indices at major resistance/breakout levels:
Equities have struggled the last few sessions, but with various sentiment and contrarian extremes having been reached (see Sunday’s post) together with these collective technical positions, the bullish case would argue for a little consolidation to ‘deflate’ these indicators before collective breakout. Chris Puplava still sees no signs of a major top, at least in US equities.
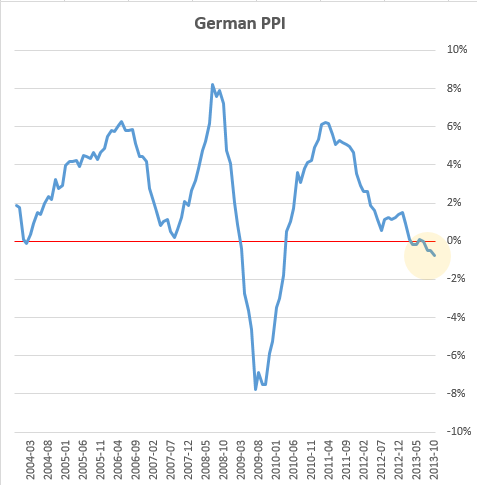
Lately, Japan’s leading indicators and inflation data have both been positive. For me, that’s consistent with Japan’s positive demographic window and I believe it can (eventually) break free of that technical long term bear, moreover it is overdue. The case for the bulk of the other major nations is really the reverse: unprecedented collective demographic downtrends. Equities bulls have historically been killed by rising rates, excessive inflation or outright deflation, and it appears outright deflation – as collective demographics suggest should occur – is the nearest threat:

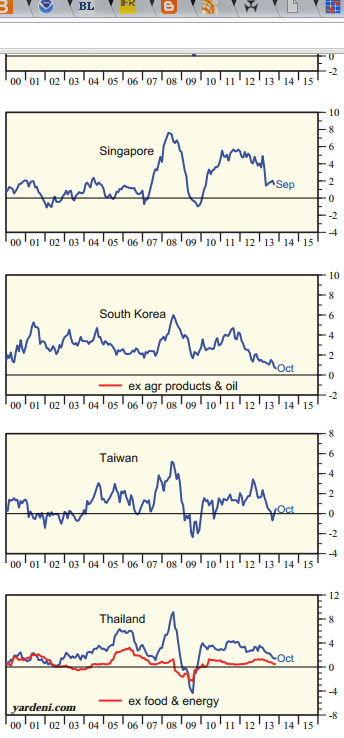

Source: Ed Yardeni
Source: Sober Look
Source: Dshort
I revealed some charts in the last post that showed how equities (particularly developed world equities) have made notable divergences this year. I have some more to add to that collection.
Firstly, this chart shows the ‘snap’ in ‘risk-on/risk-off’ financial market correlations that occurred over the last year. Developed economy equities going separate ways from commodities and emerging market equities and currencies.
 Source: Business Insider
In fact, if we look further back in time, such divergence is not so abnormal. Historically, it would normally signal a new secular bull had begun in equities, and that normal economic conditions in the major economies had been restored following financial/economic crisis. Global financial stress indices also are reflective of this currently, down to low levels, with the US government shutdown appearing as just a blip in the trend. The Vix also shows no perceived threats.
However, equities have diverged with the economy recently in the US:
 Source: HighTowerAdvisors
And with consumer sentiment, which has been in decline since July:

Source: Stockcharts
Consumer Confidence has made a similar divergence, and both measures show a fairly good historical correlation with equities over the longer term.
Global IPOs have also diverged from global equities:
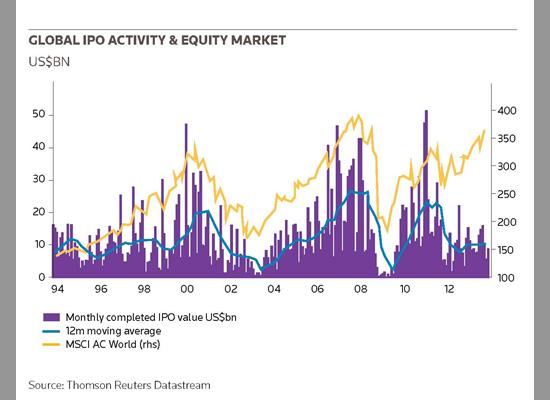
Source: IFR
Broadly speaking the reason for the decline in IPOs in the last couple of years is attributed to economic concerns. That seems reasonable, but why the divergence, when historically they have correlated with equities up and down?
These charts, and those divergence charts from the last post, all suggest we have either broken into a new norm where equities are legitimately rising despite anomalies (charging ahead as a new secular bull gradually comes to light, or under historically unprecedented conditions of central bank support) – or – we are seeing speculative levitiation before sharp declines return these divergences to normal.
Here’s the thing. This time really is different. Unprecedented global ZIRP and QE and/versus unprecedented global collective demographic downtrends. But ultimately I don’t believe central bank actions can defeat demographics, and that’s because central banks can’t force people or businesses to do anything, they can only put the conditions in place to encourage or discourage. I believe the evidence in GDP trends, trading volumes, inflation data and more, as well as the lessons from Japan’s example from the 1990s, suggest the demographics are the destiny of the economy and markets, but how long we take to get there is the question.

http://www.foreignpolicy.com/articles/2013/11/18/second_child_syndrome_one_child_policy_china
About demographics…
Its a shame when this is in foreign policy “fp” and not financial policy.
New blog here with DJIA signals
http://swingtradesequitymarketmodel.wordpress.com/
John, greetings, what a great blog you have, I think you are most profound when you observe that this time it really is different. Both the causative and the remedial, tragically different. In my real world existence I have found that most remedial work is unproductive unless it effectively addresses the real root cause of the problem. We appear to be observing the consequences of such ineffectiveness.
May I observe that if the top set of charts have lines extended from the 07 region highs to the 11 region highs then there are some impressive break outs already, Hang Seng and China are nearest to this. India appears as if under a blanket of other issues.
Many thanks for sharing.
Thanks Peter
Break out
Let’s party like it’s 1999!
John, do you see the Chinese Reform a catalyst for a long tern play? …when coupled with the new no fresh water fracking technology by APA plus a race toward thorium reactors. Can they be enough to eventually overcome the demographic problem? Please comment. Thanks.
The best time to invest in China was 1949, and1978. How about 2013???
I personally think the collective demographic downtrends of USA, China and Europe mean global stock markets will go down together (some more than others). So even for a longer term play, I think the opportunities are after that.
Good charts John. Just thought I’d share some other commodity perspective here: http://www.safehaven.com/author/580/erik-swarts
Thanks Paul