

In my last post I suggested that using lunar phase oscillation would increase the probability of a trade. There are several papers that demonstrate this lunar edge in the markets, and underlying this is a body of research relating lunar phases to moods. The period into and around full moons can bring about pessimism in humans, and this endures despite the advent of artificial lighting. The period into and around new moons is conversely often one of optimism.
To verify the relationship in the markets for myself, I split the lunar month into the two opposing periods and studied data from the last 20 years (which covers multiple cyclical bulls and bears within secular bulls and bears) to assess any difference in returns between buying at the start of the positive lunar period and closing at the end of it, to buying at the start of the negative lunar period and closing at the end of it. Here is the summary of results for four indices:

All three stock indices plus the commodities index displayed a lunar edge when totalling returns over 20 years, which means there was relatively more buying-up of pro-risk assets into and around new moons, compared to full moons. The commodities index displayed the weakest edge over the period, so I suggest lunar oscillation is best pursued through the stock indices, and of those, Singapore and Germany revealed the greatest differential. This is in line with the findings of Dichev and Janes, who also identified greater lunar differential in the Dax and Straits compared to some other indices.
I don’t think it’s overstating it to say that the lunar edge in both the Dax and the Straits is pretty massive and compelling. Understand that a lunar month differs from a calendar month so that new and full moons move through the months over the years. That means we are not confusing calendar phenomena here, such as end of month or quarter window dressing. In the case of the Dax, almost all the 20-year return came from within the positive lunar periods. Nonetheless, it would still have been better to buy and hold for 20 years than only participate during the positive lunar periods, as there was an extra 17% on offer in the negative lunar periods. However, in the case of the Singapore stock index, not only would ‘long’ participation restricted to the positive lunar periods have returned more than buy-and-hold, but additionally shorting the lunar negative period would have added even more to overall returns.
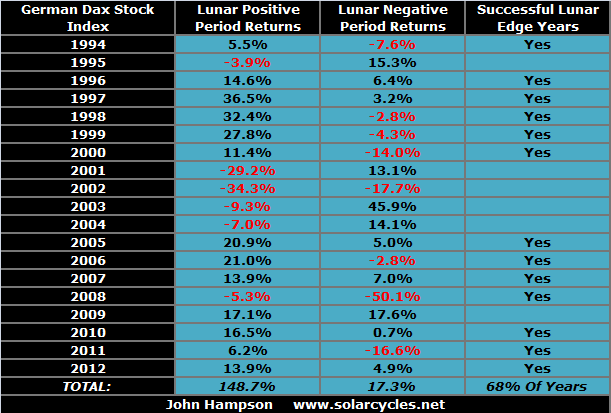
To return to my opening comments from the last post, nothing works all the time, but some things work most of the time. Lunar phase oscillation is such a phenomenon. It takes persistence through successes and failures to draw out the lunar edge, but the edge is real and profitable. The next table breaks down the Dax returns by year, revealing how the 132% differential built up. As can be seen, not all years demonstrated a positive lunar edge, and the gaps in returns varied year to year.
Drilling down one level further, if I show a sample year from Singapore’s history with an impressive differential, it can be seen that not all lunar months within the year demonstrated a positive lunar edge, but most did.

So some years fail, and some months fail, but most years and months successfully return a lunar edge. This fits with my expectations, because lunar phasing influences market sentiment but other phenomena are also influential in stock market performance. So we shouldn’t expect ‘without fail’ but ‘more often than not’.
I suggest there are two trades to consider. The first trade would be a pair on the Singapore Straits: long the positive lunar fortnight, then short the negative lunar fortnight (this aims to capture the negative return made over 20 years into and around full moons). The second trade would be just long the positive lunar fortnight on the Dax, staying out of the market during the negative period (this aims to capture the biggest nominal return of all the indices over 20 years, made on the positive lunar fortnights by the Dax). A ‘failure’ month or year then depends on which of these trades we are studying – i.e. the failure is in a negative differential between the two periods or the failure is in a negative nominal return in the positive lunar periods.
Let’s take the Dax trade first: long only during the positive lunar periods. 68% of years made a positive return. 62% of lunar months made a positive return. The total return over 20 years was 149%. The worst run was 4 years of negative returns: from 2001 to 2004. The worst run within any year was 5 consecutive lunar months of negative returns. What these ‘worst run’ stats reveal is that anyone mechanically trading this idea would have had to endure some significant drawdowns that we would ideally like to avoid. So are there any patterns in the failures? Yes, the failures are largely concentrated in the cyclical bear markets (as we might expect). If we were to only trade the Dax positive lunar periods during the cyclical bull markets of the last 20 years, avoiding the cyclical bears, the returns would rise from 149% to 240%. Whilst this is an impressive increase, it involves correctly calling cyclical tops and bottoms and patiently sitting aside the cyclical bears – both easier said than done. Nonetheless, this is supporting evidence for my suggested highest probability trading technique: trading long stock indices during the positive lunar periods during cyclical stocks bull markets.
Let’s turn to the Singapore ‘twin’ trade: long the positive lunar periods and short the negative lunar periods. 74% of years produced a positive differential. 60% of lunar months returned a net positive percentage, going long into and around the new moon and then short the full. The total return over 20 years was 169%. The worst runs were 2 years of negative consecutive returns, and 7 consecutive lunar months. Again, were there any patterns in the failures? Nothing significant that I could draw out. No seasonal patterns, no concentration of note during either cyclical bulls or bears (the Straits suffered an additional bear 1996-1998). Just sometimes the lunar edge differential didn’t work, but most of the time it did. If we were to change this trade to going long only during the positive lunar periods and only during cyclical bull markets – staying the rest of the time out – then the returns would be around 170%, so no notable improvement on a mechanical ‘twin’ trade regardless of bull or bear.

What about shorting the negative lunar periods during cyclical bears, and staying out otherwise? Again, this would involve being able to correctly call the start and end of the bears, but even with that assumption, I found that the returns are less than if we stayed short for the duration of the cyclical bears, rather than staying out during the positive lunar periods.
So returning to my ideas for highest probability trading, what if we look at returns during cyclical stocks bulls but additionally filter on those periods when the geomagnetic trend was up and when stocks were not overfrothy (suffering overbought and overbullish readings). This gets a bit more difficult to draw out retrospectively, but I can do this for the last 4 years. The result is we would have participated in 21 positive lunar periods (effectively just a quarter of the time active in the market, the rest of the time sitting out). 19 of those would have produced a positive return (i.e 90%), producing a 47.1% gain in the 19 winning periods and a 1.5% loss in the two failed periods. Clearly, this is a high winning rate and although patience would be required to sit out of the market three quarters of the time, the technique would be to apply large exposure when these trades arose. The difficulties in applying forward are correctly assessing whether we are in a cyclical bull or bear and identifying changes in the geomagnetism trend and assessing when overbought and overbullish apply. I believe that is all possible, but it is to some degree an art.
To be clear, I am not suggesting sitting out of the markets for entire cyclical bears, making no money. The idealised trade in my terms, the trade of highest probability, may only be available during cyclical bulls under specific circumstances and parameters detailed above and in the last post, however this does not preclude making trades of lower – but still good – probability, and going forward I will continue to look for opportunities at all times. However, this research has confirmed to me that there are specific trades out there that are worth pursuing with significant funding, and I intend to announce them when they arise and record their progress and success on my site.
Specifically, I am looking to capture and draw together lunar oscillation, geomagnetic trends, cyclical bear or bull trends, sentiment and buying/selling extremes, and I aim to take such trades on the German Dax and Singapore Straits for their sensitivity to lunar oscillation, and also on the SP500 for its sensitivity to geomagnetism. There are several permutations of trades within this: a repetitive twin trade on the Straits (alternating being long positive lunar fortnights and short negative lunar fortnights), a long trade on the Dax only during positive lunar periods within a cyclical bull, and a long trade on the SP500 for the duration of a geomagnetic uptrend. So watch this space.

Hi!
Great study. I see some years ago, a paper and annotate :
Lunar cycle effects in stock returns
Ilia D. Dichev
University of Michigan Business School
Troy D. Janes
University of Michigan Business School
This version: August 2001
If you see a graph there, I think you can try others strategies:
example:
There:
“We find strong lunar cycle effects in stock returns. Specifically, returns in the 15 days around new moon dates are about double the returns in the 15 days around full moon dates. This pattern of returns is pervasive; we find it for all major U.S. stock indexes
”
So, try only enter in market in this 15 days around…
Or only enter in calendar days where the expect return are great over 5 (see graph there).
I do not be able to test this things … but if you can…
Thanks
Obrigado
Jose
Thanks Jose. The Dichev Janes is one paper and there are two more which are all referenced in my PDF. Plus there is research by Lunartic Trader (Danny) and Stockchartist. They slightly vary in their timings, but the theme is the same: negative pressure into and around the full moon and vice versa.
Hi John,
The negative effects around full moon appear fairly consistently for over 60 years. In my work I use the actual position of the Moon rather than a fixed days offset from the Full Moon, but basically when you use a fixed 3 or 4 days offset you are close to the optimum.
And there is actually a possible physical explanation for this 3 days offset. The Moon has its own special interaction with the geomagnetic field, and it was found this interaction lasts until 3 days after Full Moon. See the NASA article I mention in my blog today.
The solar wind (solar cycle), geomagnetism and the full moon are all interrelated, and this gives a kind of “switch” 3 days after full moon, when the moon goes through the bow shock and out of the magnetotail.
Hey Danny, can you please link to that NASA article. Many thanks and godbless
Robert, here you go: http://science.nasa.gov/science-news/science-at-nasa/2008/17apr_magnetotail/
Thanks Danny – interesting
Hi John, Interesting stuff. The 1994 Singapore data shows amazing monthly volatility. Am I reading the table correctly: In Lunar month 1, the market was down 22% while month 2 was up 22%? Would you be willing to share the data since you have already compiled it in some format? It seems like there would be a lot of possible studies to be done using the lunar monthly data. One that comes to mind would be to use a seasonal filter that stays out of the market between May 1 and November 1 more or less (The “Sell in May and go away” filter). Obviously many others to test.
Another question: Does the positive period begin the day after a full moon and end the day of the new moon? When I read the phrase “around the full moon”, it is unclear to me what that means specifically. Just want to make sure I have it right.
Thanks for sharing all of your thought provoking work.
Hi John, thanks. It was 1998 (label corrected) and the Asian financial crisis – hence the large volatility. I will share the more detailed data tables on a new page – will advise when it’s up. I could not find a seasonal pattern. It was one of several ideas that I ran to check for patterns in the failures. Maybe others can spot something I did not once the data is up. In my data the negative period runs from the 4th day after the new moon to the 4th day after the full moon, and vice versa.
This Saturday I posted a study of bearish Class A divergences over the last 30 years on the SPX that puts into question the generally accepted convention that bearish divergences can be counted on to warn of a top.
http://highrevsopenhouse.blogspot.com/2013/03/spx-divergences-30-year-study.html
Useful study.
Thanks highrev
Bob
Aside from your compelling research, orderly presentation and thoughtful organization within an intelligent framework, I must say that your delivery is simply enjoyable to read. It’s challenging but at the same time inviting. It piques my curiosity and interests me in learning as much as I can much less make money. Wonderful job John. And thanks for the updates on your whirlwind jaunt around the globe. No doubt you and your wife will enjoy the indelible imprint its left on your children for the rest of your lives.
Best,
HVA
Thanks so much HVA
Looks like ‘positive lunar periods’ act as negative ones in a bear market, as if a full moon was bringing about counter rallies…
I personally believe that traders should have each their own strategies and never listen to others, of course too much knowledge won’t do harm but I cannot be so sure. For example what would I do when my DJIA chart turns and the solar chart doesn’t? I prefer to exit when my DIJA doesn’t behave after the entry instead of waiting only because lunar and solar cycles look good. Price action is the king for me.
I would like to ask you John to write about the mental side of the game. Strategy is one thing, but what we actually do is another. How to be patient to stay so long with a winning trade? How to fight fear that the market would take our profit? How do we fight temptation to enter the market although the moment is not so clear? How to cope with running losses (if one is a long term trader like you)? How to find wisdom to be able to acknowledge mistake?. Act of trading itself is pretty simple, but we are not rare robotic machines – we have to fight our own emotional nature.
Thanks. I have been meaning to write a post about money management and trader psychology – will do that soon.
Trader psychology… learning how to read your own natal chart and not to trade in your own bad periods is something that I am starting to believe in more and more. Call me crazy but you can give the same trading strategy to 10 traders and for some reason they will not get the same results. Question is why? Gann discussed this.
Reminds me that way back in the 70’s I looked into trading silver lunarly. As I recall it was good and in strong bull phases negative periods were sideways consolidations. Have you looked into silver, John?
No, could be one to do. I was also given the suggestion to break stocks down by sector and see which sectors are the most lunar.
I have seen a study on gold here: http://www.theidiotandthemoon.com/
Would be interesting to understand the reversion years and periods i.e. when it fails to understand if it is random or if these years have something in common.
Really interesting John, and I would like to try…..but I am unsure of the specifics as previously asked by John.
For example, does one buy on the 27 March (full moon) and sell on the 10April (new moon) or does one include more days etc., and am I right in presuming not to buy in the new moon and ride until the full moon. Feeling particularly thick today!
Loved your trip pics.
Thanks Fiona. The negative period, by my analysis, runs from the 4th day after a new moon to the 4th day after a full moon, and vice versa.
Excellent post, John. Never ceases to amaze me that after so many outstanding posts, you come up with yet another one! Many thanks for your willingness to share your analysis with us and to do it in such a clear and thorough way.
I’ll second that. Also looking forward to more on the lunar edge.
Thank you guys!
John,
Do you have an thoughts on Cocoa? I’m long silver, cocoa, sugar and coffee mainly because those have not made new all time highs in this bull market. All others have went up atleats twice the highs of 1970s for example:
Corn went to 400 in 70s and went to 800 in this bull market
Wheat peaked at 650 in 1974 and went to 1300 in this bull market
Gold peaked at 850 in 1980 and went to 1900 in this bull market
Cotton peaked at 97 in 1980 and went to 220 in this bull market
Oats peaked at 250 in 1981 and went to 500 in this bull.
*Funny how they are all almost double?
If this holds true for all of them, then new all time highs for:
Sugar would be $1.22 from current 18 cents
Silver would be $100 from current $30
Cocoa would be $9000 from current $2100
Coffee would be $640 from current $135
And what is very nice is all 4 of the above a down from recent highs in this current market, so they are low risk setups, all are 40% or below peaks of 2011.
Thanks for the continued nice posts. They have certainly shaped my commodity plan.
Actually, Oats peaked @400 in 1988
A doubling of prices from previous peaks is something that is covered in Gann’s work, and is quite common. They can also triple or quadruple if there is very serious shortage. E.g Oil prices in 2008 quadrupled from previous peak in 1990.
Thanks Dan, I’ll look into Gann’s work some more. What are your own thoughts on commodities at this point? Peak still ahead in year??
Justin,
Not all commodities are the same.
Actually, the very first study of an effect of sunspot cycle on grain prices was done by William Herschel (the astronomer who discovered Uranus).
He found that grain prices tend to peak near sunspot minimum, and become cheap at sunspot maximum.
Recently this was confirmed by Israeli researchers, Pustilnik and Yom Din. See their research paper: http://arxiv.org/ftp/astro-ph/papers/0312/0312244.pdf
The most recent peak in wheat prices was in 2008, once again near the solar minimum. So, I would look for grain prices to reach peaks again around 2020.
Danny, there has historically been a lower inflation peak 5 years prior to the solar peak larger inflation peak – in this case 2008 versus 2013’s peak (if forecasts are correct) – see here:

Wheat peaked in 1974 and then 1979/80, in line with this. Here are the two secular peaks prior to that showing wheat peaking close to the solar peak both times:
Hi John,
I am not the kind of person who is convinced by something that was observed only a handful of times. Any researcher will tell us that the statistical significance of something that was seen 3 or 4 times in a row is very low. So, that becomes a problem with all long term cycles. We only have a few hundred years of market data, thus with cycles of 20 years or longer we are usually looking at less than 10 observed cycles.
With commodity prices we are a bit luckier, because CRB index has been reconstructed going back to 1450.
Drawing in solar max and min you get this chart: http://t.co/thDRv3xeY8
Prior to 1600, the every 3rd sunspot max didn’t work at all, producing bottoms rather than tops.
Between 1600 and 1900, most of the major commodity spikes came at solar minimums. Every 3rd sunspot max did manage to mark a few peaks as well, but in two cases the commodity peak came two years before the sunspot max (1750 and 1816) and no parabolic finale was seen near the sunspot peak.
So, how confident can we be that what you observed for the 20th century is set to continue?
Great work Danny, will address in my next post.
Justin, I think you have brought up a very interesting point. John Hampton thinks the commodity top is in our future. Due to the extreme top characteristics of 2011 (new era, peak oil and commodities, extreme optimism, blow off tops etc), and the elegant Elliott Wave 5 count from the 1933 bottom, I think the top is in. And bear markets are characterized by one more rally thinking. Historically, the commodity tops have been prolonged affairs lasting several years. So the fact that all the softs you mentioned have not made new highs provides fodder for a triple top (head and shoulders, RPW, 5TH wave etc.). Plus the grains are still in potentially parabolic rises. Carry over grain supplies are at near record lows which usually occurs at tops, but another bad crop could fuel a parabolic blow off. So if we are going to have one last leg, I think you have identified the leaders. The true leader of this bull market was oil!
Kent, Thanks for feedback. My opinion is that 2011 was not a peak at all since the CRB and GSCI didn’t go to new highs, which means this has been a long consolidation since peak in 2008 similar to the 1974 to 1977 consolidation. Even when you look at CCI in 2011 it was only 10% above 2008 high – which is hardly a blow off top. I don’t think many folks are reading the charts this way, but look for yourself. If 2011 was the high, then bond yields would breaking out of 30+ year trend and stocks would be making significant new highs, like in 1920, 1950, and 1980. The peak is still ahead of us.
Thanks, Justin
My two cents: the CCI is about to break out of its large triangle (that I showed recently) one way or the other. Oil is at a similar point, with fresh momentum having taken it to resistance. Certain agri commodities, including cocoa, coffee and sugar are all back at their secular rising support. Meanwhile gold is at the bottom of its 18m consolidation range – a breakdown here would be significant. Therefore, we should be on the cusp of a collective decisive move in all these – if the secular bull is alive and well we should see imminent breakout and then momentum. As I previously also showed, the last two secular commodities peaks comprised a broad speculation of commodities – you did not have to be picky in choosing which commodity – the whole class became a target of frothy speculation.
Hi John, a couple of points. I would be a bit careful going short Singapore just because that has worked in the past. Unless there is a logical (or intuitive reason) that would explain this, then Singapore being the only ‘negative return index’ is far more likely to be just a statistically likely result that would occur in one of the indices being studied.
Secondly, Indonesia has shown the widest dispersion between new and full moon by far – worth looking at that one?
Finally, a simple method to assess whether we are in a cyclical bull could be to simply apply a moving average – if prices are above it or the MA is rising then that means a bull market – and using this as filter – ie. no long trades taken if below the MA or if MA is declining
regards, Peter
Hi Peter!
A fair point of caution. Is Singapore a statistical outlier that will normalise over time? If so then a twin trade would be likely turn out a bad failure. If however it is in fact enduringly more sensitive then conversely it should be a good target. I don’t know. Dichev Janes studied 1970-2000. I ran 1994-2013. So the latest decade maintained the edge they found. Yes I spotted the Indonesia edge too. I just leaned towards using Singapore going forward as I felt more confident it would be a more reliable economy and Asia proxy.
And South Africa has the smallest dispersion between new and full moon.
I am very disappointed.
I wonder how accurate these figures are?
Bob
Add stocks with low p/b and 6 months positive momentum and you are all set. Skip trading anything else than stocks. And only trade long. Do not be a Yale student. Be a rat trader.
That combo makes sense – value plays but already with momentum – as momentum can be at excessive froth, and value can take time to turn around. Thanks Robert.
The p/b, 6 month momentum is just a subset of stocks reversing trend as Gann would say or as Bayer would put it, “buy just after the soup has been served before the fish or after the white wine” =).
I remember from Jul´11 to ago´11, the Lunar dates were awful and we saw a sharp decline.
I wonder, John, if the lunar dates work in important situations. Have you studied the time frame from oct07 to march09? It would be very interesting! I have no dates from this period.
Hi Antonio,
The lunar periods worked in 2007, and in 2008 the market went down in both the positive and the negative lunar periods (with a slightly bigger loss in the negative periods)
The worst years for using the lunar periods have been: 1952, 1960, 1971, 1987, 1990 and 2002 , when the “negative” periods did much better than the positive periods. So basically, about once every 10 years the lunar periods fail badly.
Any ideas on what was different in those years?
Hi Danny
You helped me on your LunaticTrader website with SN …. sunspots.
I am still intrigued with this phenomenon.
Is there any chance that SN can cause a lunar inversion?
For example a sudden flare up in SN just as we pass Full Moon would negate the reversal.
Alternatively,are inversions more likely to happen after Full Moon or New Moon?
Bob
I will put up the lunar data page soon then you can look at things in more detail. But if I can identify a problem area in the last 10 years, it was 2003-4. In those two years, all four indices (Sp500, Straits, Dax, CRB) reversed the lunar edge (i.e it failed). Sunspots and geomag effects also were largely reversed. As stated, we should expect these phenomena to work most of the time rather than all the time, so the failures themselves are OK. But what caused such a collective failure in that period?
So, Danny, the conclusion is that is little dangerous to trade with the full moon/new moon, I have checked out some periods and in sharp declines, down-trends, or volatility, is not very safe-trading, only is a more-or-less- indicator
http://aa.usno.navy.mil/data/docs/RS_OneYear.php
http://www.moonconnection.com/moon_phases_calendar.phtml
Are the Lunar phases that are used local to the index that you are measuring and if so is each index in a different lunar phase? Given the cross correlation between markets is this effect evident when comparing various markets?
Also how well does this effect work when used in conjunction with other filters and indicators?
Full moons and new moons happen on the same day all over the world. Inbetween the phasing is opposite in the northern and southern hemispheres. But the key thing is the full and new moons affect the world over simultaneously. You have a point about the cross correlation of markets. I can’t say for sure that the CRB index is responding to lunar phasing, because that edge could have come from pro-risk moving largely together, with only stock indices having lunar oscillation. However, the science shows that full moons bring about pessimism in humans and this would influence sentiment towards pro-risk as a whole, including commodities.
Interesting “coincidence” with the three days around the new moon. The ancients put a lof of significance around the moon seeking into oblivion for three days and resurrecting. Happy Easter.
Thanks Kent
My friend the trader Joed who i have known for 12 years is currently doing some posts on the mind of a trader that some may find useful.
http://traderjoed.blogspot.com/
May be useful to accumulate many years of data together to overlay
http://www.calendar-365.com/moon/moon-phases.html