
This week has been on average the most bearish of the year historically. We also have downward pressure into this coming weekend’s full moon. To add to that we had reached levels of overbought and overbullishness in a range of pro-risk markets (plus support/resistance levels in Euro and Dollar). And following previous QE announcements, the markets corrected for a couple of weeks after the initial euphoria of the announcement, example here:

Source: Chris Ciovacco
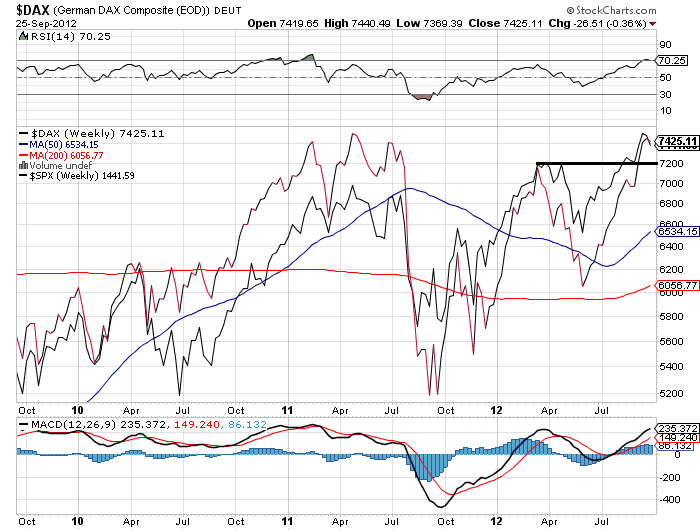
So, I expect the markets to continue to consolidate into next week, and then resume bullishly. It is important that those markets that broke out over their previous March/April 2012 highs, stay above those breakouts, or succesfully backtest. I have shown that level on the chart below which overlays the Sp500 on the Dax – I would like to see the Dax hold above 7200 and the SP500 above 1420.

Source: Stockcharts
On the macro front, the environment has improved for pro-risk. Economic Surprises remain positive and in an up trend:

Source: Ed Yardeni
European debt accuteness has retreated:

Source: Acting Man
ECRI US leading indicators continue their uptrend:

Source: ECRI/Dshort
The missing piece of late had been global leading indicators which persisted in the negative, however we now see positive development here, and evidence that reflation is coming:
Conference Board Leading Indicators 26 Sept 2012:

Conference Board Leading Indicators 24 Aug 2012:

The snapshot of the CB leading indicators above today and one month ago show a much healthier picture. With China particularly strong looking forward, that aids the commodities bull case. However, we now need to cross reference this with surveys and data coming out of China and the rest of world to ensure the improvement is valid.
One other key macro consideration is earnings, particularly US earnings, and US earnings season begins again 9th October with Alcoa. If pro-risk does consolidate into next week, then the following week I would be looking for pro-risk to be back in bull resumption, but it would be against the backdrop of earnings announcements beginning. In other words, it is important that earnings do not disappoint. As well as the earnings factor, Euroland is back in the news, so developments need to be monitored, but broadly speaking the macro evironment is currently supportive for pro-risk.
Dow Transports continue to be a concern. That index completely reversed its positive reversal, as shown:

Source: TSP Talk
The divergence with the Dow Industrials has been in place now for 6 months (DJIA made a new high but Transports did not). At some previous important tops in equities, the Transports topped out 1-8 months before the Industrials. That makes it a warning flag – unless of course it recovers and makes a new high.
If I am wrong about stocks pushing higher into the end of 2012, and this is indeed a top, correctly flagged by the Transports, then recall that topping is a process, and should take some time and messy price action, as highlighted for the last two cyclical bull peaks:
 We should see more flags appear, and negative divergences appear in breadth and market internals. Also, we only just reached overbullish levels in indicators such as stocks over 50MA and bullish percent / call put, and these too have historically needed some time flirting with the extreme zone before the market keeled over.
If we consider for a moment that the topping process actually began in March/April and this is a little overthrow of the previous highs but essentially a double top in a multi-month topping process, then know that we don’t share the usual features of a cyclical bull top: leading indicators are trending up, economic surprises are trending up, there has been no inflation accleration or rate tightening, US yield curve is normal, rotation only recently began out of defensives, and so on. So I believe that scenario, that topping has been occurring since March, is unlikely, but a breakdown back beneath the March/April highs s/r level in the stock indices would give that more merit.
In short, I see us at a reflationary point, which should enable further upside for pro-risk. But too much frothiness first needs working off to some degree.

Do you see the Chicago FED National Activity Index?
Regards
Yes, particularly weak
I have to say, everyone on this site is very articulate and very smart, and that is why I love to read…Thanks John.
I am not that smart. I just follow astro’s and cycles. As I have mentioned here before, the end of September could get very ugly from an astro point of view, and here we are, very bearish price action. We could see a low this week, then a bounce next week, but most likely a bull trap… We could see the lows to this pullback around mid to late Oct. (In fact we could get two lows, mid-oct and late oct, just don’t know if late oct is a lower low).
Should the next turns work out, we could see a rally into the beginning of 2013, but there is a possibility we see the highs in January. My charts are showing a target on the Dow of around 13,800-14,000, but of course I think time is more important than price….
If the market tops out in January, I am wondering what is going to hold up the idea of “risk on” in PM’s. One position (ST) I have is being long treasuries and I don’t see the big sell-off in treasuries everyone else keeps touting. Risk off means safety. So I am dubious of a continued rally in PM’s after January if in fact we top out….
Karen,
Do you have a website or blog?
No, I don’t have a blog…
Do you use Heliocentric positions for the planets in your work, or Geocentric, or both?
Thanks!
Thought maybe we could be down after the 3/4th of Oct, but it looks like we could put in a low on Monday the 1st then begin to move up into the 3/4th, then have a pullback, but there is a Sun Jupiter trine on the 9th, so there is a possibility we make a new high or at least get an exaggerated move up around that time into 11-12th….
Sorry to make so many changes, but look for a low on the 5th and a high around 10/11th, and then a low around the end of Oct/beginning of Nov….
Silver may take a big hit around the 12th….
I had to share one last fascination with that dollar index chart I posted yesterday. That is, just how similar it has been behaving to it’s last cycle for over two years now. For anyone interested, here it is, but I warn you it’s messy.

It probably follows a completely different path now that I’ve posted it 😉 but I still find it interesting. And once again, even if it does continue on a similar path, I remain open-minded to certain commodities reaching new secular highs in 2013. Exciting times with the secular inversion and all!
PS You sound alot smarter than me Karen 🙂
Mike, nice dollar chart….if the analog is correct point #8 could have been reached in April ’11 at 72…
Should stocks get a trough around the end of Oct then head up into January 2013 for a crest, I have a major support level on the dollar around 75-76 (if we break the current support at 78-79).
i’m not sure I see a mega parabolic move in PM’s unless the dollar can break that support of 75-76 and go to 65….
Thank you for your report.
One thing that is interesting is the excessive positioning in some of the currency futures. In particular, and I may have said this before, the Canadian dollar’s open interest is the highest (by a long shot) that I can find on record. John, maybe you can find otherwise? Net non commercial longs are also at record highs. The Aussie dollar is creeping up there as well, however is nowhere near the same extreme point. This positioning is usually indicative of a call of direction and not a hedge.
Ever since QE3 everyone hates the dollar and rightfully so but as I have said, people act as if the Fed is the end game. Now, the ECB has a bit more teeth than before. The BoJ is the BoJ and seems to be long-gone in countering their strength of the currency, next to just fixing it against the US dollar or SDRs.
What concerns me is in a global slowdown, as the US continues its dollar devaluation policies, other central banks that haven’t had to adjust their policies too much are well behind the game now entitled “The Race to Debase”.
One can look at how 2008 and beyond has affected the Canadian balance of trade and current account. A nation rich in natural resources, they have a current account deficit, and while they appear to be nowhere near the brink of “disaster” like the US, in a global slowdown, at what point will the deem that parity with the US dollar is not suitable and they must react accordingly to be more competitive. The same can be said for the Aussie, but for other reasons.
When one considers the fact that on a valuation scale, using PPP, the Canadian dollar is roughly 20% overvalued and the Aussie dollar is roughly 50% overvalued against the USD. While these overvaluations can last for years and of course don’t take fundamentals into account, it still tells a story of what the US has done with its currency versus the rest of the major developed nations and what some of these nations might have to do to play “catch up” in the race if the slowdown turns into a “fall off the cliff” scenario.
In the end, it depends if you believe global growth will continue, will stagnate, or if a global slowdown and contraction is on its way. Assuming growth is to occur, I think currencies are fairly valued at current levels (CAD, AUD, NZD), in a stagnant scenario, the risk currencies have to come back in to a more competitive level with the US dollar. In the worst of the scenario’s, I would suspect that we could see some atomic bombs (rather than helicopters) dropped by some Central Banks in regards to their policies as they devalue away, in particular emerging markets. Just look at the actions of Brazil this year.
I would like to make a further observation regarding the comments about fund flows from Stocks into Bonds, which even John put forward in his recent 4 part write up:
Majority of retail investors continue to quote how money is flowing into bonds out of stocks and that is amazingly bearish for the Treasuries and bullish for the S&P 500. However, when have retail investors ever been right on anything? How many retail investors do you know, that do their research properly and question everything without just following the herd? And how many retail investors are actually wealthy and made fortunes in the market? I do not know many.
The fact of the matter is that mums and dads, who have been taking money out of stocks, have been going to bonds. So that part is right. But Mr Bernanke has reduced rates to such low levels, that it doesn’t pay to be in Treasuries at all. I have numerous research charts of fund flows from EPFR, which shows that Investment Grade and Junk Grade has received just about 80% to 90% of bond fund flows over the last several years.
So thanks to the help of financial planners and market experts, who correctly told mums and dads to buy Nasdaq in 99 for the long haul and Real Estate in 2006 as a safest / wisest tangible investment “that never goes down”, these same guys are now back again… telling mums and dads to buy risk Bonds like Junk, because their yield is so much better than Treasuries. Typical quotes I have heard from a lot of financial planners are that these assets are bonds and it makes sense to buy them as they are “safer than stocks”.
In other words, majority of bond fund inflows have gone into corporate and junk funds, which actually have equity like characteristics and behaviour. In other words, these are risk on assets. And once again, it is thanks to Mr Bernanke who has distorted and intervened into markets, and no created unintended consequences. Helicopter Ben’s fiddling in the Bond market has pushed so many investors higher up the risk threshold, precisely where they shouldn’t be taking that much risk as they are planning for retirement. So now mums and dads are loaded up on Junk Bonds at record low historical interest rates. What comes next?
When the Junk Bond bubble bursts, the equity market will go down with it as the VIX spikes! As a disclosure, I am short Junk Bonds.
what instrument are you using to short junk bonds?
…And one theory is that when the bond bubble bursts, the last and only perceived ‘safe haven’ will be Gold. This could help gold become parabolic perhaps.
Great to read all your thoughts, thanks.
Tiho, can you point me to a chart or charts showing the majority of fund flows have been into corporate and junk rather than treasury bonds?
Durable Goods Orders: http://advisorperspectives.com/dshort/updates/Durable-Goods-Orders.php
A real stinker. And it is considered a leading indicator.
GDP USA 2ndQ 1,3%
Real GDP YoY % Change, drop again below 2.0
$NYADV:$NYDEC has issued a (buy the dip) signal.
Thanks.
Cobra’s chart shows a longer term look at Advances:Declines breadth. It’s made a fairly definitive new high – no negative divergence like in 2007 so far:
http://stockcharts.com/public/1684859/chartbook/122111960;
John, please allow me to Share with you and folks 1 of my very trusted tools (of course for entertainment purposes only):
$SPX:$VIX (daily)— Price ($SPX above); Dots; MA Envelope (Simple) set at (8,8,0); Wm %R (14)…and enjoy watching the Dots hopping in and out of the (envelope) channel.
The dots are signals in conjunction with other breadth tools.
You have been sitting tight so you deserve the profits.