
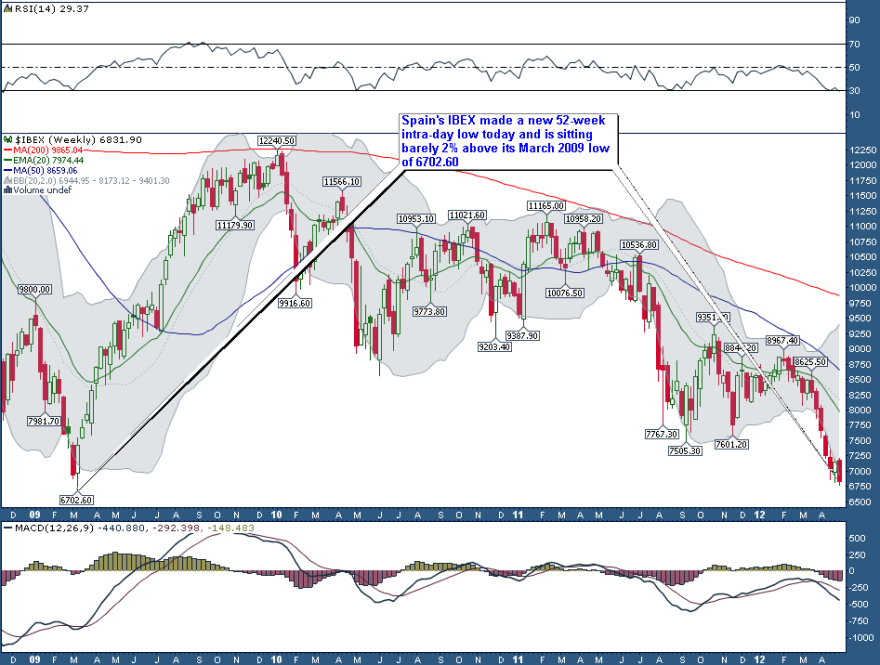
The Spanish stock index is back at its 2009 low, and out of its lower bollinger band.

Source: StockSage
Gold miners are out of their lower bollinger, at an extreme of pessimistic sentiment, and gold miners to gold ratio is at a major extreme.

Source: EC De Groot
And two from Tiho: investors extreme bullish positions on US dollar and public opinion on silver extreme pessimism.


Source both: Shortsideoflong
Extremes typically mean opportunities, especially when they ‘fit’ together. There are several contrarian opportunities to choose from here. But patience is often required (the market can stay irrational longer than you can stay solvent).
The downside that I was expecting into this coming weekend’s full moon eventually materialised. Once we are through that, I will consider new trades from these areas. Regardless of the outlook, a period of mean reversion eventually comes to pass.

I have been small short the sp500 the last few days and sat intensely digging about just before that figure to see whether I thought it likely to disappoint or not and whether i would run things.
I decided to run it when I found the following site and read this. At first viewing I think it looks a good site.
If you all use it then I’m sorry to repeat.
Here is the link I saw 10 min before figs.
Will P
http://www.google.co.uk/imgres?imgurl=http://1.bp.blogspot.com/-pG5Zckrk70I/T1TLmNTqyBI/AAAAAAAAFCI/JqdbX26ehRc/s1600/real-gasoline-pump-prices-time-shifted-two-years-later-and-unemployment-rate-us-jan-1976-feb-2012.png&imgrefurl=http://politicalcalculations.blogspot.com/2012/03/gasoline-prices-and-unemployment-rate.html&usg=__7ERNppeZZ43KJHqtGDSEccUfZbo=&h=663&w=914&sz=93&hl=en&start=8&zoom=1&tbnid=BS8tTAc4ZrZI7M:&tbnh=107&tbnw=147&ei=7s2jT9uND5Cq8AOQnpi1CQ&prev=/search%3Fq%3Dinflation%2Badjusted%2Bgas%2Bprices%2Bus%2B2012%26um%3D1%26hl%3Den%26gbv%3D2%26tbm%3Disch&um=1&itbs=1
As is always the case ,trading is a complex set of ideas which you have to distill and then make a risk weighted trade.
On the 25th March, X CLAS FLARE asked if my equity model was inverted. Well no the model hasn’t inverted but at times price can trade at a significant discount or premium to the model. That’s the value gap I like.
But XCF got me thinking.
The 1425 initial marker was accurate; the gradient has been true;price has responded as expected at my projected 1SD lines and most importantly the mean has been touched so many times that things look about right. BUT maybe the actual time frame , for the moment, is two weeks delayed.
If so it would look like this:
Now the main reason for this post is to say, what if, FOR THE MOMENT, the cycles have shifted two weeks on then the strength that the bottoming process that was expected to start from mid Apr onwards in Gold would have shifted two weeks forward too.
For that reason I am buying my bear in the SP500 back slowly and putting the money into gold.
You could well be right Will.
There are some tentative signs emerging this afternoon that gold could be at last going its own way, in spite of a steady USD and falling stock indices. It would need to sustain this resilience until the close today though…
Could your chart be shifted only one week, therefore giving a low on the 4/7th, which would then give you a high near the 20/21st around the time of the solar eclipse??
May 4, 2012
Could your chart be shifted only one week, therefore giving a low on the 4/7th, which would then give you a high near the 20/21st around the time of the solar eclipse??
The real question is are these things still in a bull market or are they in a bear market. Remember, Joe Granville said bears are right in a bear market. In other words, in a bull market it can have very bullish sentiment and be extremely overbought for a long time (silver 2009-10). My experience of bear markets is they don’t stay oversold or extremely bearish sentiment for such a long time, but in the 3-6 weeks of McClelland non-confirmations an extreme amount of damage can be done before you finally get the extremely sharp relief rally. The recent capitulation in Natgas is a good example.
According to the COT data on http://www.barchart.com large speculators have been very long following the recent rally, but have been selling off gradually to 0 as the $ has corrected. The large commercials have gone from very short toward neutral in the same way. The moves up since the 2008 lows have come when they were both at neutral. Which we are nearing now.
Kent, I agree completely. The statistics regarding sentiment as a reverse indicator works well most of the time. Often, when a well established trend is in place, such as when a product is trading above it’s 200 dma then the returns from reverse sentiment are good; however, when that trend is broken, the returns are much poorer.
As you know, I am probably more in the 2015 camp for Gold but I am prepared to be long of a bit at these levels. My average price is about here. As I posted the other day I think 1613 is important. If it trades there I will review things.
http://www.mcoscillator.com/learning_center/weekly_chart/?utm_source=McClellan+Chart+In+Focus+-&utm_campaign=b77545ca34-CIF_A_Seasonal_Quandary_5_4_2012&utm_medium=email
Tom McClellan somewhat concurs with the timeframe being off a bit….
Always interesting.
Tom McClellan is always interesting and always a contrarian. It doesn’t always work, but it works more often!
Thanks for your input everyone.