
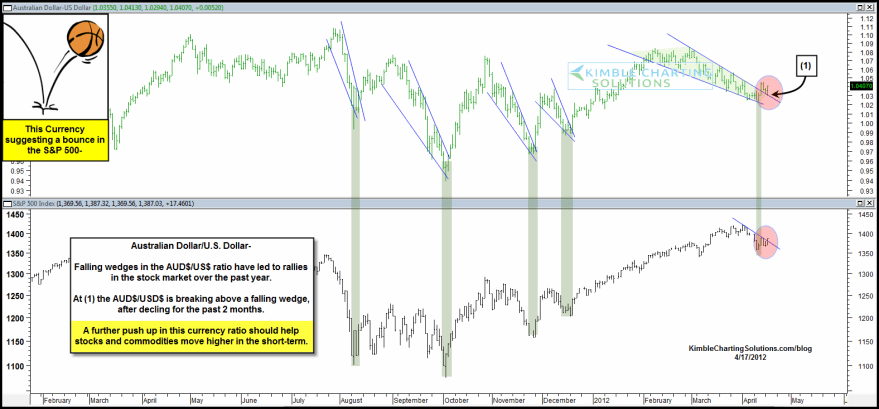
The first chart shows the Aussie dollar broke out of a falling wedge and successfully backtested, which previous marked new bullish uptrends in stocks and commodities.

Source: Chris Kimble
This second chart shows the Indian Sensex in a similarly bullish technical formation.

Source: Market Letters
The third chart shows that Dax sentiment washed out fairly swiftly, echoing AAII sentiment for US indices, making upside appear more likely than down, from a contrarian perspective.

Source: Animus
And the last chart shows capacity utilisation as a US economic proxy, revealing the Fed has kept rates too easy recently, making significant inflation ahead more likely.

Source: Scott Grannis
All four charts make pro-risk look attractive right now. Shorter term I am still looking for upside into the end of this week, and will then review whether or not to sell my bounce equity longs. There are more important earnings first, and I am aware the uptrend in place again since yesterday could yet be part of a longer B wave that began a week ago, in an ABC correction down. Alternatively, given how quickly capitulative breadth was reached, the low could already be in and a revist of the highs coming next.

An interesting link.
http://eon.businesswire.com/news/eon/20120417006172/en/BofA-Merrill-Lynch/Bank-of-America/Fund-Manager-Survey
Thursday morning mini-update. Dollar still in its triangle – hard to believe. Seems to need a trigger one way or the other. Key Spanish auction today could provide it. Sunspots still on the rise, geomagnetism contained, new moon this weekend. Still expecting stocks can make a little more upside into tomorrow and will then review if I want to take profits on my bounce positions. Asian indices look to be taking the lead right now. Wonder if we’ll see a swing in outperformance away from the US for a while. Economic Surprises for the US still fragile.
There doesn’t seem to be much of an appetite for anything at the moment – neither the USD, nor commodities. It will be interesting to see if the upturn in sunspots can create more speculation and inflation, but they will need to be sustained in a way that has so far not been typical for cycle 24.
On the charts, I think precious metals are at a point where they should break higher (especially when compared to previous corrections), but a failure here could lead to gold heading for $1330 (40SMA on the monthly chart, where the 2008 correction was ultimately supported)… Now that would be a buying opportunity!