
Let me start by saying that I’m not a gold bug. I don’t own any physical. In the event of a global mega-disaster I don’t want gold. The fiat system is unsustainable on current trends, but debt limits in the major developed nations are further out, circa 2030, so those buying gold as protection against its collapse are too early, in my view. Investment and central bank demand are the growth areas for gold, and I expect them to reverse once a new secular growth cycle emerges and dividend-less gold suddenly doesn’t look very appealing.
All that said, gold has been a source of great profits since I started trading, because of its enduring secular bull since 2000, and I am overweight precious metals currently, anticipating that the biggest gains are yet to come in an imminent finale. By solar cycles, the peak should be 2013, and thereafter I don’t want any gold in my portfolio – not until the next secular commodities bull in the 2030s. In short, I believe there is a final gold mania just ahead, which is a terrific opportunity for a trader to make big, fast profits, and yet, I don’t want to get stuck with gold so want to ensure I sell out before the peak. Therefore, I have a full long position in precious metals already, frontrunning what I believe to be a final mania (if you subscribe to the general ideas of Kondratieff, then this is a K-winter in which gold is the leading asset).
But might I be wrong? It is a tricky one to call, as it isn’t clear cut, particularly with gold currently in a down trend some way off its peak. It reminds me of the condundrum regarding equities in the second half of 2011. It was a tough call that needed repeated assessment. So here we go again…
As things stand, gold’s secular bull remains in an orderly uptrend, although it is currently beneath the 200MA, which has largely supported the bull to date. There have been notable spikes on the way since 2000, but nothing resembling historical manias. If I had to pick out a few analysts who I respect and trust, then Marc Faber remains a gold bull, Zeal LLC maintain we are still in a gold secular bull, Chris Puplava is bullish on gold to retake $1900. The alternative is that precious metals peaked in 2011 and the batton has already been passed to equities.
The major central bank policies of negligible interest rates and stimulus make for asset bubbles, hence since the secular stocks bear began in 2000 we have seen bubbles in real estate, oil, cotton, and even equities in 2007. Until their policies change more bubble-blowing is likely, and with money finally flowing out of treasuries, the likelihood of bubbles has risen again. But will equities be the main beneficiary, with their low historic valuations and good dividends, will real estate, now that it is back at historically reasonable levels, or will commodities, and if so, some or all commodities?
Let’s start with real interest rates. Negative real interest rates are typically bullish for gold. The below chart shows that certain key countries have negative real rates but the trend is currently up as money exits safe havens and inflation has eased a little following 2011’s deflationary episode.

However, with a tentative economic recovery and large debt obligations, central banks and goverments need to keep rates down. Of course, their actions and policies over the last decade have made it clear that they will and can do this, particularly if inflation is not too pressing. Real interest rates are likely to stay supportive of gold into 2013, particularly as inflation should rear again, due to oil.
Oil inventories remain above historic average levels currently, however the recent push up in the price partly reflects the worsening situation in emergency stocks, as shown:

Source: IEA
This is total OECD fallback stocks. Note that the dip in these stocks early in 2011 corresponded to the oil price accelerating in that period, only for the Euro-debt deflationary episode to deflate it for a while. But now stocks are decreasing again and the crude oil price is back over $100.
Below the global demand-supply situation. The forecast is for demand to increase later this year, which means supplies will have to increase again, if the price isn’t going to run away.


Source: IEA
But now look at global production – it has been flat the last few years, with new supply coming on stream only covering old supply ending. Although it appears from the above chart that oil supply has been rising along with demand, it partly reflects drawdown on emergency stocks.

In short, the situation for oil is tight, and a geo-political supply disruption would rapidly see price escalation. As we head into the solar maximum of 2013, increasing sunspots have historically corresponded to protest, revolution and war (such as last year’s Arab uprisings), due to increased human excitability. I believe there is a distinct possibility that we could see something that threatens supply, and potentially mirrors the 1970s:

Source: Now And Futures
Now let’s look at gold supply and demand:

Source: Morgan Stanley
Essentially, investor and central bank demand are expected to reverse as of 2015. The price is expected to be supported into 2013/2014. What might change this? Emerging central banks are switching some reserves out of diluted major currencies to gold. It is unlikely by next year that the US, UK, Japan and Eurozone will have reversed their policies to non-dilutory. Investor demand could potentially reverse if the oil price declines and economic growth continues to pick up, making equities yet more attractive. However, stronger economic growth and oil price declines are an unlikely combination.
Balance sheets of the 5 main central banks continue to grow, and as a proxy for gold now make gold appear underpriced.

Source: PFS Group
Food prices also appear to be a proxy for gold. Broadly speaking the current outlook for food prices is supported by tight supplies and increasing demand but dampened by record plantings. With trends in natural disasters still on the rise, and particulary strong in 2011, there are potential threats to the plantings and harvests, but where and on what foodstuff is hard to predict. I therefore remain exposed to agri as a whole.

Source: Casey Research
If all non-gold reserves were covered by gold then the price would be close to $10,000. As can be seen, during the last secular stocks bull of the 90s, the gap in this measure didn’t inspire it to close. Whether it could do now, in a secular gold finale, remains to be seen.

Source: Casey Research
Gold in relation to the money supply reveals we are some way from gold’s last secular peak.

Source: Casey Research
CPI inflation-adjusted gold paints a different picture, that we have aleady reached 1980’s heights.

Source: Measuring Worth
However, the same model using Shadowstats undoctored inflation data shows a very meagre gold run to date.

However, there is nothing to say gold ought to replicate the final height of the last gold bull. For that, we might do better looking at gold’s relative value to other assets. The Dow-gold ratio, shown in my earlier posts of this week, reveals an unclear picture. Having bottomed so far around 6, it lies beneath the long term trend line, but some way from the 1-2 reached in the last gold bull. Having begun its secular bull from a ratio of around 40, gold’s relative value has moved a long way. So we might conclude that gold is relatively expensive to stocks historically, but could potentially move more extreme yet, doubling or tripling in relative value.
We see a similar picture in gold’s relative value to real estate. Both US and UK shown.


Source: Approximity
Again, gold is historically expensive compared to real estate, but could yet become more extreme, perhaps doubling again.
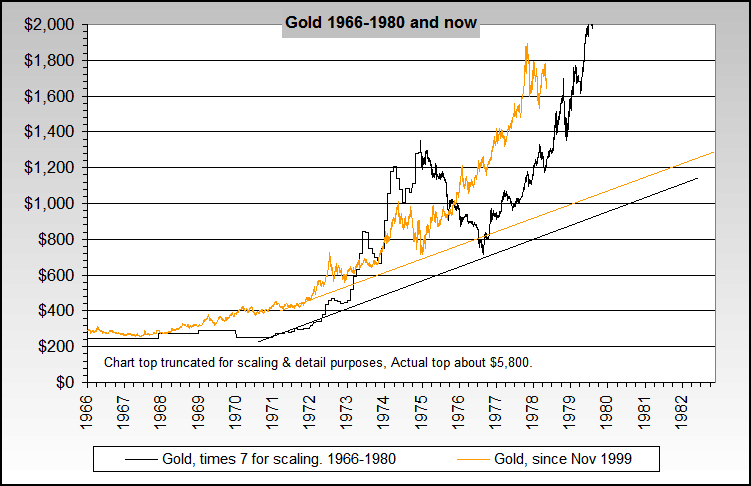
Lastly, here is an overlay of the current gold bull on the last. There are some technical similarities, and the finale would be achieved by 2013, in line with my expectations. The top would be circa $6k. Again, there is no requirement for gold to replicate the last gold bull’s ferocity, but drawing in the potential to hit absolute extremes in relative value versus stocks and real estate, something of that size would fit.

Source: Now And Futures
OK, let me sum up. The balance of evidence supports further rises for gold into 2013. Demand and supply, the oil/inflation situation, real interest rates and government balance sheet. As per my post of yesterday, gold and gold stocks are currently at overbearish extremes, suggesting a rally will occur soon, supported by gold seasonals the next 2 months. The technical shaping of that rally should give further clues as to whether my favoured scenario is correct. Developments in agri and oil and economic data will also help to bolster the one scenario or the other. For now, I sit on my full set of precious metals longs. If gold was to drop out of its current consolidation to the downside, then it would make the overbearish/oversold indicators yet more extreme, and therefore a mean reversion rally as a minimum. Furthermore, historical rhymes suggest that we should get a rally here even if it made its secular top last year. So, I expect a period of rally, and then we can reassess again.

Great article and information, thanks.
Gold/M1 still convince me that 2014 will be more likely 1974 than 1980 and we are only half way through. We are not any closer to higher interests rates, what possible should kill the bull market? Central banks (the western ones) don’t want to buy gold as a protection any more they are buying equities to protect against inflation which they create. US cannot possibly repay debt in fair way, fair value of dollar, it’ll take a few hundreds years. So it doesn’t matter what you buy gold, equities or real estate you not going to lose money in the longer term.
I think the world has yet to see real speculation in the precious metals markets!
This research by GMO shows that 79% of total gold demand between 2000 and 2010 was accounted for by emerging market consumers (buying physical gold). Less than 7.5% was bought via ETFs (ie. western speculative demand). Whilst there was more speculative buying during 2001 H1, that was largely negated during H2. I don’t know a single person outside the financial industry who has bought gold (either physical bullion or ETFs) – so there is potentially a huge number of ordinary people who could still buy in…
http://www.advisorperspectives.com/commentaries/gmo_11912.php
I also have some serious doubts about NASA’s February/March 2013 prediction for the next solar peak. Their record is not very good, and their prediction for cycle 24 has already changed several times. I’m seeing more and more research showing that 24 is likely to be significantly longer than currently expected:
Click to access IJEST11-03-11-020.pdf
In the past, periods of longer solar cycles (such as the Maunder and Dalton minima) had lesser numbers of sunspots and consequentially colder global temperatures. Research shows that this would result in lower crop harvests and higher agricultural commodity prices over a sustained period…
But now look at global production – it has been flat the last few years, with new supply coming on stream only covering old supply ending. Although it appears from the above chart that oil supply has been rising along with demand, it partly reflects drawdown on emergency stocks.
Brilliant point John, Here I thought no one actually bothers to cover supply and demand, but you are doing a great job. When it comes to Oil, not only are we using emergency stocks, but we are using them at 6% per annum. That means if we do not discover any large Oil deposits soon, within about 20 years, the world would be out of inventory.
The only way we can discover oil is for prices of Oil itself to rise and create industry incentives with high waves, high profit margins and large shareholder returns on investment. That way more capital will flow into this sector in search of Oil due to high returns. As we find more Oil, supply will overwhelm demand, just like in every other commodity bull before this one. Than, mania will occur at the end and the bubble will eventually pop, crashing everything back to earth and restoring common sense…
However, I don’t think it will end next year, because no one has found any major oil fields in over 25 years. Mr Jim Rogers think that this commodity bull market, based on supply and demand, will last more than average and upto 20 years, until the end of the decade. Due to the banking crisis of 2008, additional investment and capital has been postponed into searching and opening of new oil rigs, mines, farmers etc etc. Lehman Brothers crisis has most likely extended the bull from say 16 year cycle to a longer one, until we find and build more supplies.
John
Regarding your statement below, with sovereign debt being added so rapidly now, what is your basis for thinking the limits are that far out in time?
Ben
The fiat system is unsustainable on current trends, but debt limits in the major developed nations are further out, circa 2030,
Just getting caught up on another week of terrific posts. The wild card not mentioned in Tuesday’s Dow 260,000 is the technological evolution of weaponry, particularly the democratization, most specifically the affordability, of weapons of mass destruction and their delivery systems so that anyone and everyone could easily have the capabilites of inflicting horrific destruction. Technological evolution will certainly be fascinating but let’s not overlook the double edge sword.
Re gold, evidently I’m not a gold bug as I don’t possess the physical. I have, however, owned GTU for the last 10 years. Typically twice a year the weekly GTU Full Sto will dip below 20 (no link as I use ThinkOrSwim charts) which always marks a great buying opportunity. Today’s reading closed at 32.8 which tells me gold has another 1.5 to 5% to fall before backing up the proverbial truck. Of course I could be wrong which is why I bought Jan and March options for Gld and Slv today.
Also added and traded miners today. My horizon is 6-9 months here and the wide daily swings present plenty of chances to lower the cost basis. One point I feel will be increasingly important over the course of the year is country risk. Just in the last two weeks we’ve seen new steep taxes (Australia), forced divestment (Indonesia), and game changing lawsuits (South Africa). Emerging-Developed market frictions and tensions should only increase throughout the year which I think bodes well for the Canadian miners, especially the juniors, but also the bigger guns such as ABX, GG, and AEM. Today’s action shows this as the above three easily outperformed GDX.
Given the markets action since Monday’s 1414 Spx peak I suspect John may have an updated turning point post brewing. If so I’m hoping you could address a couple points re the Spx and Geo-Lunar model discrepancy. If we ignore all other factors and focus strictly on the gap, is it safe to say the wider the gap the greater the fall? Secondly, is it significant that (medium term model) the Spx and Geo-Lunar are trending in different directions?
Last, like Still Water, I think the sovereign debt limit dilemma arrives earlier than 2030, largely due to all the uncounted liabilities and guarantees. Bruce Krasting at Zero Hedge does a good job of exposing the wide varieties of US debt liabilites not counted in our official 16 trillion figure. I believe his current tally is around approx 60 trillion.
Really excellent stuff, John et al
THANKS
Great comments guys, thanks all.
The medium term models for Dax and CRB are still well behaved, only the SP500 has run off. Hence I think sideways consolidation rather than abrupt down.
Regarding debt, gov balance sheets have been expanded siginifcantly to prevent what would otherwise be a natural depression and cleansing. Money supply has been siginificantly increased, reflecting the intervention, yet money velocity remains low, as per the depression/cleansing cycle. Following this, from 2014-2032 a genuine growth cycle should erupt, where supportive intervention is now longer required. Balance sheets will need to be maintained higher, but revenues will be higher, which should slow the debt ballooning. All the money supply that has built up will start to circulate in the economy.
Maximum debt to GDP levels, based on history, are around 200%. The US is on track to hit it 2030, UK 2025. But this is based on the trend in place since gov debt started ballooning a few years ago. If the growth cycle erupts then I see this slowing. They may not have the flexibility over interest rates going too high because of debt commitments. But inflation will be permanently higher, which will help reduce the debt, and revenues will be higher.
John,
Can I ask you which criteria you use to determine the date of each solar peak? Is it the smoothed monthly value of the number of sunspots?
The reason I ask is because solar peaks are in fact marked by periods of volatile sunspot numbers extending up to one year or so – in other words, they look like single peaks (or spikes) on long-term charts, but more like rounded tops in the shorter term. The chart near the bottom of this webpage
http://www.lunarplanner.com/SolarCycles.html
entitled Solar Cycles 22-23 illustrates the difficulty in trying to time trades around a solar peak. The red line shows, I believe, the smoothed monthly values and it starts to turn down during April/May 2000 (right on the secular bull conclusion) for solar cycle 23. It turns down after June 1989 for cycle 22 – just a few months before the Nikkei peak in December 1989.
So a turndown in the smoothed monthly values would seem to be a suitable way to time the forthcoming solar peak. My view is that cycle 24 could turn out to be an extended cycle (as I’ve previously commented), so I’d prefer to time my commodities exits using this approach rather than simply rely on NASA’s prediction of a peak during March 2013…
By the way, the quality of your analyses and the number of visitors to your site are going from strength to strength – keep up the good work!
Regards,
Mark
Hi Mark, thanks. Yes I’ve been mulling over your interesting thoughts and links about an extended maximum. That’s a useful chart showing a kind of double head the last two maximums. But I note that the S&P by the second peak of cycle23 at the turn of 2002 was some way off its peak, though it did try to push up again, and the Nikkei by the second peak of cycle22 circa 1991 was also some way down. The maximums I have quoted are based on smoothed sunspot number. Regarding commodity solar peaks we have seen peaks close to the official maximum, plus a later echo rally. I’d expect this again, as the commodity demand-supply balance is gradually resolved rather than instantly. But that said I’d expect stocks to be outperforming by the second echo rally, so would want to be in equities. Well, going back to the charts in my post above, we’ll know this time next year whether gold has reached absolute extremes, and if it has I’ll be out, even if it comes again later.
Here is the updated graph I have for Gold.
The thick blue line is the annual modeled price fit.
The thin blue line is the intra-year dated modeled price
The purple line is a 13% discount to the intra-year modeled price. 13% was the premium the price got to my modeled price last summer.
Modeled price currently 1844 and rising;but rising much faster from 6th April.
Purple line currently 1613.
Preston, I find your graphs really really interesting, but wonder why you negate the link after a few days.
I would like to use both graphs as reference points.
Thanks Preston, John, and all the interesting followers on this site, for your ideas.
Fionamargaret..Hi
I know it’s annoying. I don’t seem to be able to copy to this site , only copy a link from IT Charts which they must erase after a while. I suppose I could start a blog and post them …..you’ve got me thinking.
Likewise here is the updated equity graph.
As stated before we are above the modeled price and in a downward pressure that started on the 8th at 1369…
This continues to the 29th so by history we will be at 1369 or lower by then.
Preston, I like your charts, especially the one on Gold. In terms of cycles/astro’s it looks like there may be a trough in PM’s and crest in the dollar around April 4/5th. Yet your charts for the equity market reflect a trough around 29/30th. Is there any information you have that could instead give us a trough in the equity markets around April 4/5? Thanks!
Thanks Preston, if that pair come good I will be happy.
Preston, I like your charts, especially the one on Gold. In terms of cycles/astro’s it looks like there may be a trough in PM’s and crest in the dollar around April 4/5th. Yet your charts for the equity market reflect a trough around 29/30th. Is there any information you have that could instead give us a trough in the equity markets around April 4/5? Thanks!
Karen hi…sorry for the delay, I didn’t see your post.
My modelled price suggests that the prime move from 23rd Nov would reach 1425 by 8th March. Then a dip and then a new high into April. After this high, a lower low would be made and rising lows from thereon….effectively a slightly rising step.
Mr Bernanke looks like he’s taken the steam out of the dip this time.
Given that the dip from April has a lower low I think it is fair to assume that that high is the start of the bell curve.
It is about that time, the second week in April, that the modeled Gold price starts to rise rapidly.
If Gold stays within the range 1660 – 1740 ish for the next couple of weeks then the bolinger bandwidth will be down to a level normally associated with a large ensuing move. Sorry I can’t demonstrate any of this as I’m on my son’s laptop today and I can’t get the right click to work….Grrrrrr