
So far it’s been a leap year for the account – which I hope is the case for you too. First, I profited from the big up trend in stocks, and took a large part off in profits. Now commodities are outperforming and I am benefitting from a full set of long positions there. Based on a rather unscientific indicator, when things are going this well, there’s usually some ‘less well’ around the corner. So let’s get a bit more scientific about whether some protection of gains here might be wise or not.
Firstly, silver broke out yesterday. Unless we see a swift reversal today, that looks pretty compelling for the bulls.

The US dollar could potentially have started a multi-month downtrend, which would be supportive for commodities.

Source: Chris Kimble
If we consider the (energy-heavy) Commodity Ishares fund’s relative performance to stocks and to bonds, it suggests significant relative upside should be ahead for commodities and energy in particular – that is IF the secular commodities peak is still ahead. I maintain that it is.
Commodity Ishares : Stocks

Commodity Ishares : Bonds

Source: Stockcharts
However, sentiment for the US dollar is now into the overly bearish zone, suggesting a near term pull-up might be imminent.

Source: Daneric / Sentimentrader
Sentiment for crude oil is also into the bullish extreme zone, suggesting oil might need some respite.

Source: Shortsideoflong Blogspot / MBH
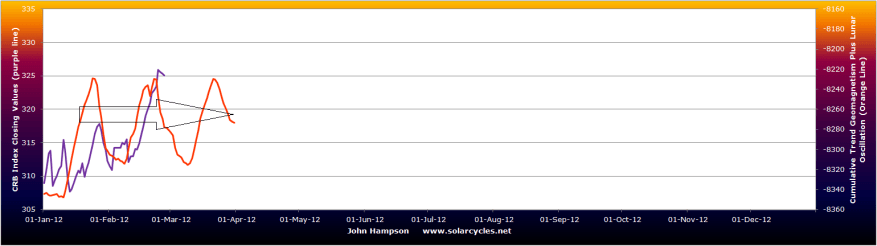
And actual and forecast geomagnetism has now flattened out. With greater seasonal geomagnetism normal in March and April, I expect my model to tip over or at best stay flat. I also maintain the expectation that some consolidation or downside will be realised into around March 9th. The RJ CRB commodity index in near and medium term views:


Turning to stocks, the Vix still appears to be making a bottoming pattern, whilst the CS Fear index remains at an extreme high, which together suggest a pullback in stocks may be imminent. The Summation index also appears to be rolling over.

Source: Chris Ciovacco
Citigroup Economic Surprises remain in an uptrend for major economies as a whole, but are perhaps now in retreat for the US, which as previously noted might spell overall sideways action for stocks.

Source: Bloomberg
We see divergences in Mclellan momentum and Dow theory. Overall though, equities remain in a tidy uptrend without screaming sell signals.
So what to do?
I have enough evidence to want to protect some gains, but whilst expecting that any near term reversal in the US dollar and commodities will only be a counter trend move before momentum resumes towards in favour of commodities and against the US dollar. If I’m right in my assessment of a secular commodities peak ahead, likely 2013, then commodities should outfperform stocks going forward. So, I’m on the look out for a push up and reversal intraday in pro-risk, and maybe either LTRO or US GDP announcements today could provide that. I will be looking to exit some or all of my remaining (small) stocks longs positions and to just trim my commodities positions lightly, with a view to refilling to the full long commodities position, potentially week commencing 12 March.

Question – is my site blocked at work for anyone? I know at least one person has this problem (classified ‘social networking’) and wondered if it is common.
Hi John, I am in the US (Missouri) and your site is not blocked at my company. I work for a large co. that I think would be similar to many US co’s in terms of internet restrictions. Also, many people have smartphones these days with wifi or a data plan and often they use those to access the internet if restricted at work.
True. Thanks Tom.
John,
It does look like week commencing 12 March is shaping up to be a potentially pivotal period – the next Fed meeting is on 13 March, and 16th is a major Bradley Turn. I know you don’t regard bradley Turns as your most important indicator, but they did mark the major trend changes very accurately during 2011, and could very well do so again this year.
Regardless of what happens with stocks, I will try to “sit tight” on my commodities during 2012…
Regards,
Mark
Thanks for the date pointers Mark.
For my point of view is ok
Morgan Stanley Is The Rosetta Brick – Part 2
http://chartistfriendfrompittsburgh.blogspot.com/2012/02/morgan-stanley-is-rosetta-brick-part-2.html
I say you were god damn lucky to ride this bull wave all the way into this high. Why not book all of the profits and sit this out on the sideline? 200 handles on the SnP/10$ on silver 200$ on gold is pretty good in my book.
once continuation of the uptrend is confirmed – re-enter. Big money are already earned anyway, cant be right 100% of the time … or can you? 😉
A fair question. Essentially I have done that with stocks – taken profits on the bulk, and now ready to reload when the opportunity comes again. But commodities – IF I am right and the secular peak is in 2013, then it’s an opportunity (of mania) that doesn’t come round too often – about every 11 years to be precise. So I want to be fully loaded for it. And if commodities start to accelerate in the final phase, I don’t expect there will be much opportunity to get in.
Gann’s Master Time Factor (60 yr cycle) called for a commodity top in 2011 corresponding with the 1951 commodity top. The article, Metals and Mining Paradigm Shift, by Richard Mills on themarketoracle.biz has the CRB spot commodity chart that shows the 1951 and 2011 tops. Plus the 2008 top. The zeitgeist is like that article “new paradigm for commodities”, everybody seems bullish, plus COT commitment of traders has large speculators as bullish as they were in 2008 and 2011 and the commercials are about as short as then. The 60 year top is a 3-4 year rolling affair as each commodity has its run, but it’s been 4 years already.
The $ is so bullish. It has a 3 year Elliott 1-2 double bottom and has broken out above its 200 day MA and the long term down trend line from the 2002 top. The long term down trend line from the 1985 is around 100.
To me the 2008 and 2011 commodity tops were like the 2000 internet bubble so yet another run while possible would have to be scintillating.
Commodity bull markets do not end because of cycles from Gann or the sun or Elliot Wave or anything else. They end when supply overwhelms demand. Commodities move based on supply and demand over the long term, but I have actually yet to see a trader, investors or a blog which follows supply and demand of commodities properly.
Everyone just takes short cuts, because it is too hard to figure out what the Brazilian pickers of coffee are estimating for this season (supply), what the weather is doing (transport of supply) and if the grinding in Europe is picking up or slowing down (demand).
There is no doubt that the story of W D Gann is one of the most fascinating in financial trading history – a man who made $50Million trading commodities during the first half of the 20th century commands respect.
The difficulty with his work is that no-one else seems to be able to understand it fully! His books were written in coded language, and he famously would never reveal details of his methods in public, saying that “the public are not ready for it”. If anyone fully understood his work, they should be able to emulate his profits, but nobody has been able to.
For example, on 3 October 2010 Gann Global Financial forecast that the current commodities bull would peak “near the end of 2012”, in contrast to those Gann followers who believe it was early 2011.
Gann was very interested in the 60-year cycle, but he also listed 150, 120, 100, 90, 84/82, 60, 50, 40, 30, 20, 15, and 10 years as “major cycles” – take your pick! His interest in the 60-year cycle stemmed from the Jupiter-Saturn Conjuction – regarded by ancient astrologers as the most important in the Cosmos. Jupiter and Saturn align in geocentric ecliptic longtitude every 20 years, and every third alignment brings them back to their starting position.
The last alignment was 28 May 2000 (a period very familiar to all stock investors), and the next will be 21 December 2020. Although there was an obvious peak in commodities early in 2011, there is no convincing evidence that Gann himself would have regarded to 60 years between 1951 and 2011 as particularly signifiicant.
No one is disputing Ganns success, but in the end, commodities move on supply and demand.
Thank you Mark, excellent exposition. Ref Tiho and supply and demand. I am sure you are correct on supply and demand. 2000 was also the low for commodities, “coincidentally”. The cover of the economist was the world is awash in oil. That point of excess supply was the low. Industrial demand for silver has been dropping yearly for over ten years. But investment/speculative demand has more than taken up the slack. But basically the large increase in prices over the last 10+ years has prompted conservation and increased in production in all commodities. I have read after a very long lag, mining production is flooding on stream,finally. The peak oilers said 2005 was it, but even oil production is up, and how about natgas. I live near an agricultural area and the farmers have literally planted cotton in what was their backyards and are clearing timberland to plant. Cattle prices are currently near all time highs and cattle herds are lowest since the 1950’s. Hence, I think top. Bottom line, the long term cycles are a way of assessing supply and demand. Typically a shortage is considered bullish, but if it is at a cyclic topping time like 2011 it could be considered a time to sell and sell short. Typically it is given as a reason to buy.
Hi Kent,
I appreciate your comments. I also think the points you make are valid, and like you I “think top” – but not just yet!
Looking at the gold and silver “bubbles” in 19879/80, Nasdaq in the 1990s, US house prices in the noughties, Nikkei in the ’80s and even tulip bulbs hundreds of years ago, these bull market bubbles all ended with a spectacular blow-off tops where all sorts of people (not just investors and traders) were desperate to buy in at any price. I don’t think we’ve seen that yet, this time around.
There were reports during gold’s last bubble, of buyers at the New York bullion banks queueing right out onto the street and continuing twice around the whole block! They were even paying others up the queue to buy their place, because they were worried that each person in front was pushing the price further up. At the moment, I personally know of very few people who’ve bought gold (yet?!).
Under those condtions, the law of supply and demand becomes temporarily irrelevant. To my mind, it is the supply/ demand imbalance which eventually brings an end to this type of market excess, but it is temporary speculative mania which pushes prices to such ridiculous levels in the first place.
Of course, no-one can know what the future holds, but I am convinced enough that the current commodities bull will not fade out now in a whimper that I am happy to hold my long bets in the meantime…
Regards,
Mark
hello again John!
Many thanks for the new update but I’ve just noticed that gold took a big dip under 1700USD… do you consider this to be the beginning of a medium-term reversal or just a little dip that can allow late-buyers like myself to jump on the bandwagon? I’m kindof jealous on your profits BTW, personally I sold my commodity longs way too early in January, guess I should’ve listened to your advice… will do next time 😉
Hi Lemmi, I still look to 2006’s post-high analogy – some more back and forth and overall sideways (but with an upward bias) base building would be normal.
I do appreciate the quality comments folks. Kent – your challenges are food for my thoughts. Tiho, I totally concur on supply-demand – solar cycles are a key influence in this balance, rather than something separate. Mark, the importance Gann placed on time cycles absolutely resonates with me.
It all comes back to the key question of the moment – how much secular commodities bull do we have left ahead, or has it even already finished? So I’ll address it again in another detailed post sometime soon.
Tiho,
Could I suggest that you consider including a link or reference to your own blog in your posts here? I’m sure John would not mind (?) as he has already listed your website as one of his top ten favourites.
The reason I suggest this is because the analyses on your blog contain a lot more valuable detail than you can repeat in brief comments here. For example, you mentioned this morning about how commodities move “in the end” on supply and demand, but the detailed graphs etc in your blog are essential reading for anyone who wishes to time the shorter term speculative movements in the markets.
Regards,
Mark
While those a very nice words Mark, it is none of my business to advertise my written material on other peoples blogs. I try and join into conversations and put forward opinions to make this blog better as I respect John’s work and read it regular like many other blogs.
Mark, thank you for the comments. You are right about now is not as extreme as 1980 for gold. I was a young stockbroker in Alaska at the 1980 gold top. I went out to lunch at University Mall the very day of the top in gold. It was 20 degrees and snowing lightly but very large flakes. When I looked into the mall there was a line from Alaska National Bank of the North to outside into the snow. I asked and was told they were buying gold. Being young and brash, I shouted out it was time to sell not buy. The way everyone cut their eyes at me was scary, I’m sure they would have come after me if they hadn’t wanted to pay $850 an oz. for some gold so badly. I feel very alone being bearish on commodities, which only gives me a little solace. The reason I read Solarcycles is there is a lot of evidence for one more run. If that happens, I expect a correction ’til the fall. Not happening is because every asset doesn’t blow-out to that degree every cycle. This cycle we have had Dotcom Bubble, Real Estate, OIL, cotton, as well as gold and silver. I think RE was the 1980 gold of this cycle. I had unemployed friends and always underemployed friends buying multiple houses. My telling them how risky what they were doing was not well received either.
Thought-provoking again, thanks Kent. Marc Faber puts the multiple bubbles that you reference down to negligible rates and money printing, and expects more bubbles in the next couple of years. From the bottom in risk appetite at the end of 2011 and the continued environment of negative returns for cash and bonds it seems likely to me that money flows will drive something or things to dizzy heights again over the next 12 months.
Kent,
That was a brave call to sell gold, not just because it was such an extremely bullish market but also the risk of several hundred snowballs heading your way..!