
A bounce looks likely here, and a significant one at that.
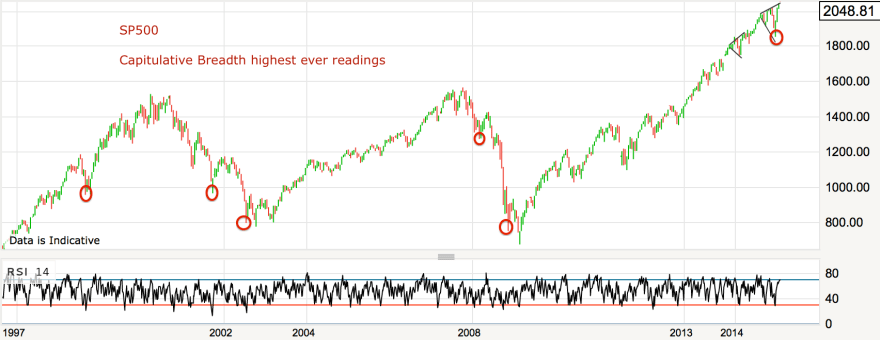
Capitulative breadth (Rob Hannah) hit 20 yesterday, which is extreme. See other extreme readings here:
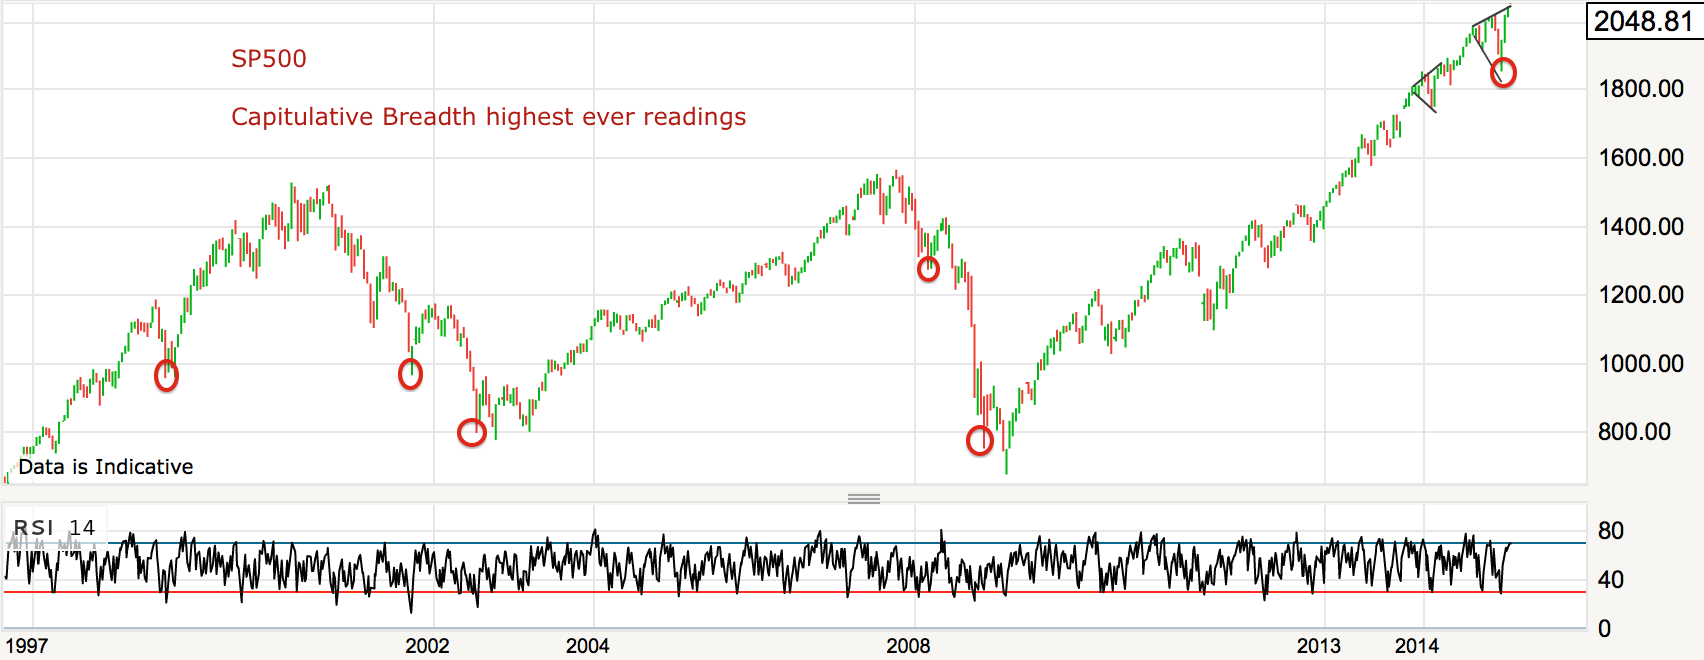
In the past, they typically occurred after major falls, but October last year and now have been more shallow. The Dow fell yesterday to just 3% off its July peak or 5% off its May peak. Capitulative breadth is made up of a count of large cap stocks in the index showing capitulative selling. Quite why this has occurred after only shallow nominal price falls is unclear.
Also, bullish percent (SPX) reached a level suggestive of a low.
 Source: Urban Camel
Plus, CPC on Friday hit an extreme also only seen at previous lows, and the recent little cluster of such readings further points to a significant bounce.
 Source: Stockcharts
Draw it all together and it looks like the Dow (and other indices) is going to get a decent bounce here at long term rising support.
 On the flip side of the equation, gold miners bullish percent hit zero again, like the boxes in the past shown:
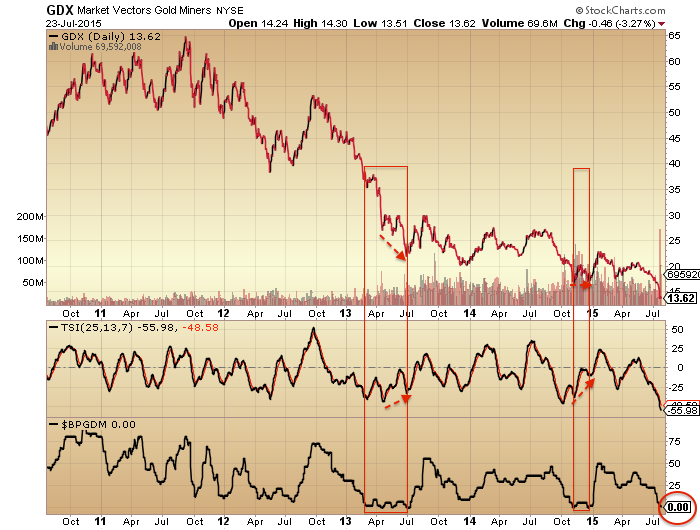 But note the norm in the past was for a lower low on positive divergence before a true bounce.
Therefore, it appears likely we will see a rally back upwards in broad stocks imminently whilst gold miners go on to form a lower low on positive divergence. The bigger picture of a major top in equities and a major bottom in gold remains unchanged.

Thanks John.
A bounce definitely here. It’s no longer in any doubt anymore that central planners buy stocks to support the markets, is it?
The Chinese are just blatant and unashamedly vocal about what the US Fed et’al have been doing for years in a more covert manner.
Stock markets are now central to maintaining the illusion that all is under control in economy and as such will do whatever is required to keep the illusion going.
Mr Draghi’s famous “whatever it takes” comment, whilst open for some speculation should have left litle doubt about what “whatever it takes” really meant.
Allan, the Chinese have just been jaw-boning, they have a large population (who have a penchant for gambling) to keep happy.
The Chinese have been deliberately deflating their property bubble, they will allow the stock market bubble to burst too (look at the past 2 days). They are the precise opposite of the Fed in these regards.
As for general ‘manipulation’ theories, if they do manipulate gold, how did it get to $1,900 a few years back? If there is a Plunge Protection Team, they’re not that good are they, given 2000-03 and 07-09.
Internet myths in my views, these powerful entities are largely impotent in the face of global capital flows. As the next 2-3 years will show.
GM, RE manipulation. I have always maintained that manipulation is within the major trend. To ignore that nether the Fed nor other entities do not partake in market intervention either directly or indirectly runs counter to all evidence.
QE is a form of “market intervention”. It may be indirect by nature, but it is still intervention and thus a form of manipulation.
As for gold the evidence is undenialble. Last weeks Asian sell off is positive evidence. The market had a massive amount of contracts dumped in the space of a few seconds in a time period that is normally the THINNEST in terms of volume all week……com’on mate!.
That was done for no other reason other than to run stops. The large commercials know exactly where the sell stops are placed and there was no reason whatsoever why anyone wishing to sell and obtain the best possible price would dump in that way.
If this was the first and only ocassion I woould be sceptical of funny business too, but this has happened time and time again over the years.
It is bizzare to me why people find it so hard to believe that manipulation occurs after banks have been cought rigging LIBOR, currency and sub-prime fraud. BUT don’t dare mention that they manipulate Gold to run stops or anything!!!
I just wouldn’t call ‘stop running’ manipulation Allan, that’s all, just part and parcel of the market. All the shorts will get squeezed the other way, and no one will call it manipulation then. We agree on the principle.
As for QE, yeah, they have manipulated the yield curve with Op Twist, as they did in the 70s, but again, the CBs will lose all semblance of control eventually.
Mother nature will have her way!
From Ben Hunt:
Today’s note, “The New TVA”, looks at the history of the New Deal to illustrate what I think is the biggest structural change in the investment world today: through the magic of Narrative construction, capital markets are being transformed into political utilities. It’s a path that status quo political actors frequently take when confronted with the existential threat of overwhelming debt; it worked to great political success in the 1930s and it’s working today. This transformation makes me sad, but crying about the past or being a grumpy old man is a luxury that few of us can afford. Instead, I try to take a clear-eyed look at how current events are rhyming with the historical events of the last time the world wrestled with too much debt to out-grow. The skinny: all of your capital market assumptions are at risk and probably wrong. It’s time to stop demonizing words like “leverage” and “volatility”, as these are tools we all need to learn how to use better if we want to be survivors here in the Golden Age of the Central Banker.
Highly recommend Ben’s writings — http://www.salientpartners.com/epsilontheory/
Gary, THANK YOU. What a find!!, for me at least. Yes! Another regular read added to my growing list.
http://stockcharts.com/h-sc/ui?s=%24SPX&p=M&st=2007-07-26&en=today&id=p13094953339&a=417583788&r=1438065665783&cmd=print
McHugh believes the top is in, here is what he says:
“The Industrials have completed a Rising Bearish Wedge from October 2014, with a truncated top, meaning its final wave {e} up failed to exceed its May 19th, 2015 wave {c} high. July 27th, 2015’s decline below the wave {d} bottom, below 17,465, confirms the top is in and the next great Bear market has started . . . . .
“Then we should see a short-term bounce, wave (2) up. That rise could take the Industrials up toward 17,800ish, with 18,000ish likely to be the maximum upside potential given the purple declining trend-line, drawn by connecting recent tops. Then wave (3) down of {iii} down of {3} down will follow and that will feel very much like a crash, but it will be just a minor decline compared to what is coming this autumn.”
So be vigilant and get your shorts ready at the top of wave 2.
McHugh has been saying the same senerio for I can’t remember how long. it would be nice if on occasion it played out to some extent but so far nothing
Since 2009 !!!
JH, you are already proven right, nice call.
I wonder if bubble peaks in the past have reset themselves so quickly after minor dips? Hussman (this week) reckons we’re there now for the top. Credit worth watching for a ‘tell’.
Armstrong has $1084 as a monthly closing key level for gold, if it closes below that, he’s (sorry, his computer is) calling for sub- $1,000 gold.
I certainly get the feeling we’re very close to extremes in both stocks and gold/miners, perhaps there already.
Thanks very much John. It’s good to see so much supportive technical evidence for a bounce here. Your research, as usual, is meticulous.
Just remember the different timeframes. Some look and act on shorter than others’ and vice versa.
J
Good point J. Having looked at the shorter 5 & 60 min charts I don’t get the impression that this bounce will be substantial. I’m beginning to veer towards another low of around 17200 on the DJIA so around 205x on S&P before a more substantial bounce develops. The 17200 is based on my long suffering wave count as shown below where the current down wave touches the blue trend line:
https://www.tradingview.com/x/I2V7i4XD/
The 205x count ties in with Peggy’s / Spiral’s projection.
I am still looking for a Mid-October ATH for stocks and a major low for Gold (and Commodities).
A rally!, it has not even gone down yet. The summation index is at an oversold level but occasionally goes lower, sometimes much lower. Same for the rsi.
I agree Kent, this micro rally will end in a few days. Then there will be selling into the Venus Inferior Conjunction with lows around August 3rd to 8th. Then a broad rally in all asset classes (FCX may double during this rally).
7/28 10:11 7442 Spiral update 2044 by 7/30 October price target 1878
Great Peggy and thanks for update. So first 2044 by July 30 and then what is target for uptrend in Sep? OR no uptrend in Sep and target of 1878 going in to Oct?
corrective uptrend expected between august 9 or 13 to approximately sept 11
But you’re still looking for ATH’s, right Peggy?
yes
I was on the ustream tv website and did not find 2044 in any of the prices Z’s , M’s or RefZ’s. ..
2044 is the “price” of the Spiral radius at 22.5* (last time was 7/8). This price is expected by August 1.
thanks Peggy…. Full moon + 3 days will be low
Peggy – thanks for the updates.
Is 7442 Spiral still expecting a possible drop to 1949 or so close to August 9th?
Thanks in advance.
at this point seem like a Tom Cruise move MI
Surprising –
WASHINGTON (MarketWatch) – Consumer confidence fell sharply in July to a 10-month low, perhaps because of a more volatile U.S. stock market triggered by financial worries in China and the latest Greek debt crisis. The consumer confidence index dropped to 90.9 from 99.8 in June, the Conference Board said Tuesday. Economists polled by MarketWatch had projected the index to total 99.1. The present situation index, a measure of current conditions, slid to 107.4 from 110.3. The future expectations index declined to 79.9 from 92.8, hitting the lowest level in almost a year and a half. “Consumers continue to assess current conditions favorably, but their short-term expectations deteriorated this month,” said Lynn Franco, director of economic indicators at board.
Why surprising?
Real disposable incomes continue to contract, jobs starting to go in the oil patch, companies will be squeezing their employees now like never before.
Plus, of course, solar minimums….. the point of this blog.
Dead wrong again, GM.
https://research.stlouisfed.org/fred2/series/A229RX0
https://research.stlouisfed.org/fred2/series/DSPIC96
Gary, see that bit at the end of this chart, that’s just gone negative. Also, you know, speak to people in the real world, see what they tell you. Sigh.
https://data.oecd.org/hha/household-disposable-income.htm
You’ll need to highlight the US, that didn’t carry forward in the link.
Have a look at this one, if you think the trend is conducive to ‘confident’ US households, you’re an optimist.
The US is in terminal decline, the trend is most noticeable since ’98.
https://research.stlouisfed.org/fred2/series/A067RO1Q156NBEA
How far will it plunge over the next 2 years I wonder?
I’m very, very pleased to read about posters looking for new all time highs.
Seems to me all the ingredients are in the mix now.
This September should be the most exciting time ever seen in the market.
What will be so spectacular in September?
That’s when the asteroids hit I think? Only the Southern hemisphere, so we’ll be fine up North 😉
Allan, ‘GM, RE manipulation. I have always maintained that manipulation is within the major trend.’
last weeks flash crash was nothing more than longs liquidating in response to the china crash. Manipulations occur within the trend as you say, but these guys are aiming to skim a fraction of a per cent on intraday trades. No one can create a four year bear market. All these so called dumps are merely accelerating price declines which would have occurreed any way.
Gold is heading sub $1000. That claim by me is based on technicals not crazy manipulation theories. I feel sorry for all the gold bugs who have brought into this nonsense from newsletter writers and held onto their losing positions.
I feel sorry for leveraged gold-price speculators that were long and forced to sell.
But I feel delight for physical-only non-leveraged gold buyers (like me) that have been able to but all through the past 2 years at silly prices, including right now.
Different animals karl, some of us see what is coming, some of us like to gamble.
buy, not but. Ooops.
” No one can create a four year bear market”
Never suggested that anyone ever could. My position has and still is that paper markets are predominantly traded on a technical platform and at times have very little to do with prevailing fundamentals.
Futures markets were set up to assist producers and end users, NOT to be a vehicle for speculation and abuse which, whether people wish to admit to it or not, has allowed large entities benefit at the expense of producers.
When you have a physical market that is dwarfed in sheer size by a paper market and you get the psychological damaged wreaked upon it like the event last week it takes a lot tom turn the psychology of market participants around regardless of the underlying fundamentals. Eventually you will, but the damage is already done and the producers in that market the ones forced to make the tough decisions until then.
So how in hell is that helping anyone but market speculators that may be on the right side of the trade? It has nothing to do about assisting producers and end users!
If you can’t see that then I don’t know what it takes?
I agree with that sentiment Allan, many markets are over-financialised these days, I do see that. I suppose my point really was, the same financial players will be juicing these commodities on the way up too, so why moan about it on the dips, if we know it happens, let’s take advantage, buy the lows, sell the highs. Cheers.
message for jeger,
please would be send me a message via the contact form found when clicking on my ‘GM’ name here, have a suggestion for you. Thanks.
will do – thanks
J
Good call JH. Perhaps this is second chance now.
They better do another 10 rounds of QE — Chinese government is panicking because Shenzhen Composite is ONLY up 49% right now. I wonder how many times in history have we done stimulus to prevent the market from dropping more than YTD+49%.
What’s the point of QE? They have made it very obvious they are trying to prop up the market. Would be better to just buy $10 billion of Chinese stocks every day and ban all shorting. Very silly what they are doing though trying to manipulate the market. Nice move by the DAX today. My next target is 11400 to retrace the fall which should happen this week. The Dow I think will get to 17900 or maybe 18k before the fall resumes. I am now looking to short at these areas before going long September till year end.
http://screwtapefiles.blogspot.co.uk/2015/07/dont-believe-hype.html
The Chinese govt are all talk, no trousers.
Also, this:
http://www.baldingsworld.com/2015/07/28/quick-hits-on-mondays-drop/
The C is with the first a-b, the FED thing is due. But the moon beckons suggesting sell the FED news regardless. Hubble bubble. Don’t trade innuendo unless you wrote it yourself and if you wrote it make sure you trade it.
Lunar Tuner This Week:
Phase: + until Th open
Declination: + T to Fr.
Distance: + all week
Seasonals: + M to Th, – Fr
Planets: – – all week (double negative due to Venus Inferior Conjunction (VIC) 8/15).
Summary: Went long Monday at bottom. Except for wild card VIC, all tuners are + until Friday. My exit will be Thursday, at or near open.
Valey,
how does next week look…will you short thurs/friday and for how long?
Will move to cash on Thursday. Don’t know yet if I will short then or wait until Monday. Definitely won’t be long past Thursday.
Hi Valley,
You and I have moved out of sync. I am long from Monday also, but I am expecting +ve for the next two weeks as we are at perigee, 0 dec and full moon this weekend (we could get a lower low today/tomorrow).
It may be that your timeframes are shorter than mine.
ATB,
Kerry
Hi I have a question about whether it’s the New Moon or the Full Moon that has the positive effect on the market?
For a while now I thought we went UP into the New Moon and down into the Full Moon. However the last few times I’ve seen comments suggesting the opposite.
Please would someone clarify. Thx in advance.
Purvez,
I concur with your view, up into the New Moon and down into the Full Moon.
FM to NM is a positive period, NM to FM is negative. JH then adds 2 days to these dates which I don’t do. instead I say +/- 2 days either way.
Regards,
Kerry
Kerry thx very much for the FM NM explanation.
Lunar Tuner has phase, distance, and declination with seasonals to get set ups. All four are almost equally important. Then, use overbought or oversold price action to target entry. If price is overbought, going long is risky even if LT is positive. Buy low when LT is positive, sell high when LT is negative, and avoid overtrading. Quote: “better to be out of a trade and wish you were in than in a trade and wishing you were out”.
I like that quote Valley.
Long DAX ETF at 11150. Target 12000 by year end. Currently have no spreadbet positions but looking to do go short near 11400 for a leg down possibly to 11000. I think european earnings will surprise to the upside and the DAX will re-rate to a much higher level over time.
DAX is in a downtrend since April. It has rejected 3-4 times in July at 11800 level. I would be hesitant to go long unless it breaks 11800 convincingly on a close. Rather, as it is in a downtrend I would be more likely to go short nearer 11800 if rejected again. You and I clearly use very different processes to trade:)
Good luck anyway, although trading on a conviction you have with no price action to confirm would not give me a good night’s sleep. Been there, done that, worn the t-shirt , lost the t-shirt, had no money to buy another t-shirt etc etc.
Looks like a lot of risk to take for a 7% gain by end of year……that’s all I am saying – but I am not saying I think you are wrong. If it breaks 11800 convincingly, then it will go far higher than 12k and you would also have somewhere to put a stop…:)
J
All this “BS” over whether or not the Fed raises a measly 25bp would be laughable if it were not so bloody pitiful!
Anyway I have said it before and I’ll say it again. There won’t be a rate hike this side of 2025.
Allan
I suspect you are right, there may be some token rate-rises here and there, but I deem it near to impossible to do this in the current and even medium-term. There are a lot of lies being told right now, even more than usual in a monetary system – so it should be interesting to see how things play over the next year or two.
As a resident in the UK, I still find it baffling that people don’t even know that the NHS has already been privatised (legally). I guess they will only notice when they get asked for £50 to go see a GP, or £250 to fix a broken arm at the A&E?
In this sort of ignorant environment, anything can happen. It is not the fault of the people of course, people have enough to worry about as it is. I used to say the world is made up of 5% electrons, 5% neutrons, 5% protons and 85% morons. This was unfair, people are not stupid but are not conscious of what is happening. This state is caused in my view by “structural abuse”. The monetary system inflicts this on the public/taxpayer through debt, competition, scarcity and so on that has been mentioned before – people do not have the capacity to consider anything beyond:
1. Get a job
2. Get into debt
3. Mindlessly reproduce even though overpopulation and very bad times ahead loom.
4. Keep job in point 1. at all costs to support points 2. and 3.
It is not surprising therefore that we cannot find a base of unity for what we want. People do not know what they want, but people also do not have the surplus capacity to ask questions and engage on the subject.
People are not even aware of TTIP, TISA and fu*k knows what other stuff is going on in favour of corporations. If they are aware, they don’t care. This is due to “structural abuse” – people do not think they can do anything, have no power, or just think this is a “pipedream” (one poster on here said that from memory). Monetary systems always divide and conquer. If 100 people told the banks they are not paying back their mortgages, they would be evicted and or sent to jail. If 1 million or more did the same, it would be a very big problem on many levels on a potentially global scale. There are safety and support in numbers, that is why our society has become more and more individualistic by design and of course we are told over and over again that there is nothing we can do, that it is human nature (a poster on here said that from memory) and all the other bulls*it.
Slightly off-topic, but the ignorance (willing or otherwise) despite tools like the internet and so on is staggering. People repeat “information” or “facts” without conscious thought.
be careful out there.
J
J, I agree with all that you said. Hopefully you meant it in a Global context rather than just the UK. I’d hate to have the UK singled out when all you say is globally applicable.
Well, countries are just lines on a map backed by dangerous man-made sentiment like nationalism and national pride etc. I refer to pretty much any developed country in the world, it makes no difference to me whether I refer to the UK or the country I was born in. I wonder why you feel that? These are the questions we have to ask ourselves…imho….
J
Hmmm perhaps I did come across as being nationalistic on a second read. I was trying to make the point that what you said was applicable globally and I think it was your NHS reference that made me wonder if you thought this was a UK only problem you were describing.
Rest assured I have little care of land or nations. That extends to possessions too, much to the annoyance of my family.
Hello All,
Anyone who took notice of my top call from January will have seen that it worked to within 2 days and I think the low is now in and have moved back to 100% long.
I still think we could have a wobble in September so I am on alert for that (i.e. a further sell off with a lower low).
Cycle chart and post is here:
http://www.17yearstockmarketcycle.com/2015/01/djia-march-2015-cycle-high.html
ATB,
Kerry
Are there two Kerry’s on the board?
No just me. I don’t seem to be able to log out of my son’s WordPress account (which I set up for him)
Gotcha – appreciate all your posts here Kerry.
How does the 17.6 year cycle guide your shorter term trading? The second graph on the page you link to seems to suggest DJI at 18k at year end? You are going 100% long now to gain 350 points on the DJI by end of 2015? Where are your stops?
If you could provide a little more flesh on the bones rather than references to a post from 2013 (well done by the way) that would probably be more helpful in understanding your work?
Cheers
J
Hi Jegersmart,
The 17.6 year cycle identifies years for tops and bottoms. The 17.6 week cycle that I referenced in my blog post identifies a possible top date within that year. Note that I am not saying I can predict the future and I am dealing with probabilities not certainties.
Then within that I have a 28 day cycle that I monitor to look for short term turn dates, +/- 2 or 3 days and based on price action. This is in line with what Valley does and is difficult.
I am 100% long looking for a bounce into late August. I am not suggesting the Dow will be at 18000 at y/e, I generally don’t have a view on price, only time and whether it is a low turning point or high turning point.
I don’t use stops as I am investing in unleveraged ETFS that pay dividends, so if I get it wrong I can wait. When I have been wrong it is because I have been out of the market, not because the market has tanked.
I am wary about a far lower low in September or March and agree with John that this is a short term bounce. But I could be wrong and generally there is a time to get out on a retrace.
I hope this helps.
Kerry
Hi Kerry, I read your book but there seems to be a lot of leeway. If the bottom is in 2018, we could peak any time before then. It depends on whether we kick the can and go all-in, like China, or let the market fall naturally.
Hi John,
There is a lot of leeway and I use the longer term cycle to time when to apply and back off leverage in anticipation of a trend change.
I am working on shorter timescales on my blog to try to get a decent trading approach. The May 18th top call worked out well. When is THE bottom? Sept or Mar is my best estimate at the moment. I will refine this though.
Regards,
Kerry
Kerry, just to be clear, you mean Sept 2015 or March 2016? Thanks in advance.
Yes, Sept 2015 (preferred) or Mar 2016. Price action should help identify the right time.
When you say ‘THE bottom’, Kerry I’m unclear what you mean. You do expect a ful-blown bear market through to 2018 conclusion I believe? Or am I wrong?
Hi GM,
I expect a final bear market low between 2015 and 2018. Based on the previous cycles I have looked at, and admittedly there are only three in total, I don’t think it will be lower than 2009 low. Also based on previous experience, I don’t expect this to be a 2000-2002 or 2007-2009 type event (i.e. a 2 year full blown bear market) but rather a 2011 type drop (15%-20% correction) which will be done within 12 months.
I am speculating, I don’t know, but this is what I am planning for. I think the change in the interest rate environment will be the catalyst as rates slowly move to a new normal (2.5%?). As I type this a slow change in interest rates could mean a slow grind lower but I don’t really believe that.,
In my opinion, 2018 will be where we finally make new highs from a point which we never return (Dow 18000, FTSE 7000) the start of the new secular bull market once again driven by low oil and energy prices driving down input costs for manufacturers, feeding into corporate profits .
ATB,
Kerry
Thanks for your reply Kerry.
When you wrote
‘I expect a final bear market low between 2015 and 2018’
I smiled, because you’ve given yourself a 3 year window, which is rather pointless, and seems to make your USP (17.6 years) totally redundant.
Good to see you’re an optimist about markets and the future in the long run, but debt and demographics guarantees much doom ahead I’m afraid.
Hi GM,
I have given myself a one year window for a top, 2015, that I later refined to 18th May 2015. I don’t expect that to be exceeded until 2018 (17.6 year cycle). When the bottom happens in that three year window I don’t know, as I explain in my book during the big bears it happens at the end, during corrections it happen at the beginning. I anticipating a correction and have said a low in September 2015 or March 2016, so a 6 month window.
You are right that it is difficult to trade with the 17.6 year cycle and I was finding it tough. I found selling relatively easy, but identifying when to buy back in was difficult. Hence I developed the 17.6 week cycle. It is serving me quite well at the moment. Nothing is guaranteed though, there are no certainties.
PS – debt will be eroded through inflation, as it always is. Demographics in the West will be dealt with by immigration. Sorted.
Regards,
Kerry
‘debt will be eroded through inflation, as it always is. Demographics in the West will be dealt with by immigration. Sorted’
Yes, just like those walks in the park in the 30s and the 70s. Sorted!
Kerry, thanks for posting. Look forward to more of them. Myself wouldn’t be long until we get way below the 200 MA on Dow or 8/15 VIC whichever comes first.
Valley,
Are you planning to short, if yes at what price and when..
Bill
Bill, I have decided to exit my long position at 12EST. I “guess” that the Fed will disappoint and the market will fall next five trading days. I won’t go short until Friday tho’ and may just stay in cash until next week. That said, I am very bullish from 8/15 to 10/15; see a counterseasonal rally that from the lows may be 10%.
Valey -why not go short before fed mins into this ramp up
50 50 odds, it gaps up on Fed announcement, imo.
Hi Valley,
So how low will we go till august 15, 20% and after that 10 % up..?
I follow the bradley so we will see an inversion in the graphic from august 15 till oktober 15…
Thanks in advance
John, I don’t know the amount of the sell off or rally just the approximate timing which is also a guess. To put a number maybe 5% down, and 10% up.
Thanks,
So up to new highs after the sell off
Goodmorning Valley,
(Almost evening in Holland) I have a question do you already go short from here?
Thanks..
John,
I am short Thursday from 12EST, day trade only. Will short again Friday at open if price is up.
Gold was a massive speculative bubble.
We had TV programmes about the subject,
“we buy your gold” adverts on TV, online
and in newspapers.
Towards the very peak I remember a report
on a gold dispensing machine in Dubai.
Utterly ridiculous.
Read Charlie Munger on gold, he sums it up nicely.
Just to highlight for everyone’s benefit, in inflation-adjusted terms, gold has been a poor investment since 1982, if you were in it for 33 years, you’d be peeved, unless your name is Rothschild or Al Saud of course.
http://inflationdata.com/inflation/images/charts/Gold/Gold_inflation_chart.htm
I smile at Phil’s vitriol towards a harmless lump of metal though, makes me ponder if he was attacked by a pack of wild Krugerrands whilst on safari in South Africa as a child?
GM, I’ve said it before, who holds any investment for 33 years?…. If you held US stocks between 1972-82 you did disastrously.
On the other hand if you held gold between 1999 and 2011 you did extremely well. I for note, sold all my gold and gold stocks into the hype in gold in 2011.
It was obvious that gold was over-hyped at that time.
We are now however at the other end of the spectrum once again with extremes in valuation in both general stocks and gold and gold stocks at the opposite end.
The fear mongering in the gold sector is the worst I have seen in over 30 years and I suspect that is due to widespread participation of the interweb which is fostering a “hysteria” mentality.
Phil, a bubble of sorts then to a degree. What about now?
The majority of producers are underwater, hardly anywhere near what Iwould call bubble territory!
I mentioned a couple of name that would hold gold for much much longer that 33 years Allan (the Rothschilds and Al Sauds).
That’s because they know what is coming and have gold to get through it and out the other side in far better shape.
But the fact gold has had a poor 32 year cycle can’t be denied, but the cycle ahead will be more explosive that the 16 years 20x increase in the 70s. I reckon 50x.
Well, today’s pop has taken us to the 50% retracement from the mid July highs to the recent lows on the DJIA. The 5 minute charts suggest another ‘down up’ right now (29 Jul 2015 20:00 BST) but I’m guessing we are now as far up as we are going on this wave.
I’m still favouring a drop down to the 17200ish region before anything else happens.
There!! I’ve jinxed it for the bulls AND the bears now!!
John, we need to start incorporating into your posts, graphs and data about search patterns like “buy gold” on Google trends. Got to give CNBC article credit for that, but I do believe it could yield a new source of psychological / solar driven behavior data about investments?
Being married to one’s investments/positions/views is dangerous. imo.
J
Looking at the daily chart of the Shanghai Comp, clearly it isn’t responding to anything the Chinese politburo may or may not be doing. It has responded as one would expect by bouncing off the 200 dma twice.
It is down another 2.2% today so appears to be forming a bearish flag rignt above that 200. A decisive break could just set the selling off again.
Will “they” step in and do whatever it takes,, or let things take their course?
http://stockcharts.com/h-sc/ui?s=%24SSEC&p=D&b=5&g=0&id=p27528926691
Correction (perhaps Y of 2 in EW-speak?) in progress – http://schrts.co/sWGJGN
ultra, in EW speak I’m thinking this is a ‘(b)’ of ‘c’ of ‘A’ of ‘4’ of an expanding wedge as follows:
https://www.tradingview.com/x/8ejj8eGp/
LOL!! One of these I’m going to disappear up my own ‘b’ of ‘c’ of ‘a$$’!!
It does not appear that US earnings or the US cycle
is rolling over at this point.
JH called the recent bounce very well and did
not get caught on the short side.
Are we heading for triple digits in gold?.
When you say ‘US’ Phil, are you referring the United States of America? Or some other small country, or planet?
I only ask because the facts don’t relate to what you write.
Maybe you would like to supply some facts, or maybe you might like to read Jeff Snyder’s blog at Alhambra, lots of nice charts of US data, all pointing downwards.
http://www.alhambrapartners.com/2015/07/27/slump-completes-half-year-with-no-end-in-sight-and-first-half-worse-than-first-thought/
There you go Phil.
Stay tuned –
Bloomberg’s Option Adjusted Spread (OAS) for US Investment Grade Credit now stands at 145 bp, up from 85 bp a year ago for the widest spread since September 2012. The 10 year yield has fallen less than 20 bp over the last 12 months meaning the widening of spreads is not a function of lower treasury yields and since the 10 year bottomed at 1.64% on January 30th (64 bp below the current yield) OAS spreads have widened another 29 bp, for a total interest rate increase of nearly 100 bp.
As we note above the overall SPX index has been range‐bound over this entire period. Although the weakest credit industries (Energy and Materials) have also
experienced brutal declines within the US equity market the strongest sectors
such as Healthcare have also seen spreads widen measurably.
LMAO, the MSM respond like what Gross is saying about ZIRP is some kind of prophetic revelation. Anyone with a modicum of financial knowledge understood what the global issues were and what really needed to be done to fix it.
ZIRP never was the answer. It was a short term solution for a problem that requires a long term approach.
We had the chance post 2008 to take our medicine and fix the macro issues surrounding global debt/trade imbalances and corporate greed, but have only managed to make things exponentially worse……
http://finance.yahoo.com/news/bill-gross-says-fed-recognizing-115301811.html
There is a plan Allan, lead by the BIS and the Eurosystem, but they weren’t quite ready in 08-09. They will be ready and raring to go from the start of 2016 though.
The days of reckoning are fast approaching, so know what you own and how you own it.
Added to DAX ETF longs at 11150. The IMF cant participate in the 3rd greek bailout. Big deal! But markets like to react negatively allowing great long entry points.
Ref the discussion on gold. Dan Amerman has an article on gold-eagle about the ratio of gold prices to housing prices. The first chart in the articles shows when gold was at it all time inflation adjusted high in 1980, it took 100 oz of gold to buy a house. That marked the high and the beginning of a 20 year bear mkt for gold. Well, in 2011, the ratio hit 100 oz again and a bear mkt in gold started again. Gold is still overvalued and the charts show $500 is in the cards. Not now, as there will be rallies, and one should begin within 2 months. As the venerable Richard Russell says, the bears give great rallies to keep everyone in until they have lost virtually all.
Kent, not wishing to be rude but what pure rubbish. Comparing gold to house prices, GoR, a mans suit and anything else is just total bunk.
Gold is not a hedge against inflation either, as many atest to. It is a hedge against global uncertainty and a loss of confidence in the system and the ability of Governments to maintain control.
BTW the mean Sydney house price just exceeded $1 m and in 1980 it was $28 k.
Oh and if gold ever hits $500 poz buy every bit of it you can because every single producer on the planet would be history.
That would ensure that prices would soar to absurd levels, because for one. No producers no requirement for a COMEX or any other futures markets.
According to Georgian economics, real estate(RE) is the most impt valuation criteria. I got interested in Georgian economics because it and the 18 year RE cycle predicted 2008 and everything that led up to it and since then. One tenet is that the stock mkt will crater a yr or two after RE peaks and then the economy soon after that. In the US, RE peaked in 2006. The stock mkt in 2007, and the economy in 2008. Not bad. So using that template, I noticed that Chinese RE peaked in Jun, 2014. Therefore, I wrote here, their stock mkt should peak in 2015 and their economy should be in a depression by the end of 2016. Coincidence, right for the wrong reasons, I do not know. But Gann’s Master Time Factor (60 yr cycle) has been amazingly accurate. It called for a big bull mkt, strong $, and weak commodities. Not bad either. Incidentally, The first big rally on commodities is due to start from the projected low this Dec. Real Estate is very different from men’ s suits. One more thing, one of the reasons I called the top for gold in 2011 was it was so tremendously overvalued relative to real estate and long term adjustment for inflation. We are mostly technicians here, but valuation matters a lot at extremes.
The world is in the mire. The big players know what lies ahead. The Chinese are in on the plan:
Click to access yao1.pdf
From that speech:
‘There will be a floor if gold price drops.’
If you read the slides from his speech, you should grasp exactly what gold is going to do for the world as the debt bubble is dealt with (via default & devaluations).
If you look back at the 30s and the 70s, you will know that this has happened before.
This time, the problems are much larger, therefore expect gold to rise much further.
Gold’s price can go to ANY level mankind requires or chooses (via the market), and it will have zero affect on how you live your lives. A unique asset class in that regard.
Load up, sit back, enjoy the ride of a lifetime.
Kent,
“It is the number of ounces of gold required to purchase an average single family home in the United States”
Once again a US analyst looking at things from a totally US based perspective.
What is it with so many people in the US that makes them unable to see things from a global perspective?
How low would gold have to go so certain players could buy assets at 30 cents on the dollar from the weaker?
J
valey,
Good Idea to go short from 2110 and scale up at 2120…do you think its just a day trade or hold for few days.
Is Valley still posting here? I thought he was long gone and hanging out on his yacht and the island he bought 🙂
http://www.imdb.com/title/tt0033729/
Past performance is no guarantee of future results. However, my goal is to become the “greenest” Valley of all.
Will probably short at open tomorrow, Full Moons often open up, then sell off. Plus tomorrow Lunar Tuner begins to turn mixed (Phase, Seasonals, Planets -, Declination and Distance +). What gives me confidence on short side is 8/15 VIC which is one of the most reliable bearish alignments into that date, and most bullish after that date.
Downward bias until next Thursday.
Blue moon in aquarius??
RSI divergence on HUI today, price at lows of 2 weeks ago, RSI at double the previous low (which was 11, I’ve never seen an before. 23 now.). Buy.
Patience, Grasshopper. Buy on August 10 which is around when the absolute medium term low will be.
JH, dare to comment if this bounce is over?
Swing Cycle Trades has interesting post on convergence of negative cycles next week. All of his cycles Kitchin, Wall, 10 week, etc. are in negative mode and bottom next week. One more reason to short market here and buy back next week sometime.
Valey,
I follow him and he is pretty good at it.. are you short using options or index funds…on a contrast cbi reading of 20 will take some time to brush off ,plus no real reason for decline
Bill
Hi Bill,
Can you post me the link of that site?
Thanks..
I think this will work great:)
I think SP500 is in a triangle and this up and down will continue for a few more weeks – http://practicaltechnicalanalysis.blogspot.co.at/2015/07/update_31.html
New post