

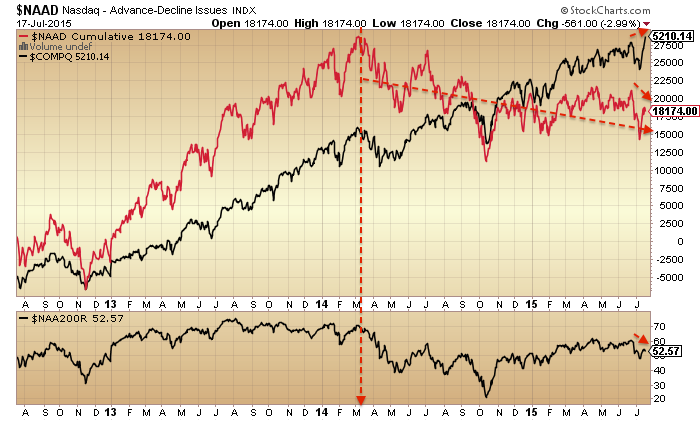
The underlying picture still looks the same. Stocks have rallied back up but there are so many persistent divergences that aren’t supportive. Here breadth, strength and bullish percent all look like the last gasps in 2011.
 The Nasdaq has outperformed the other indices to make new highs with the rally back up, but breadth is flagging a clear warning.
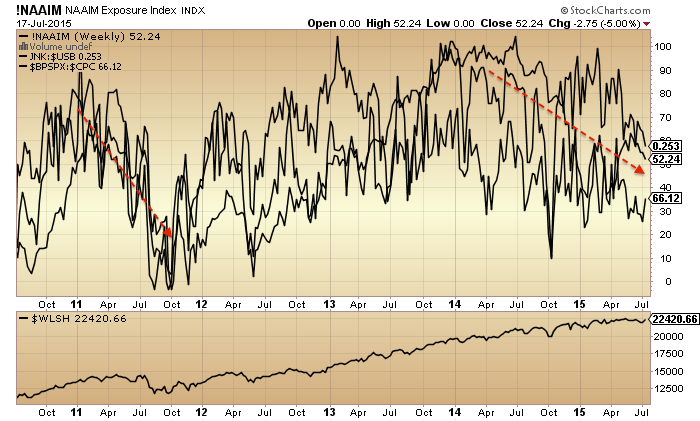
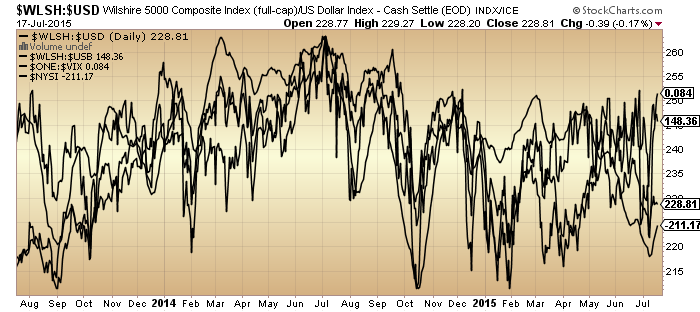
Really, there are so many divergent indicators on US stocks it’s take your pick.
Meanwhile, gold dropped again but the picture is the reverse, with sentiment and positioning at contrarian levels suggestive of a bottom.

Source: Sentimentrader / King World
Therefore, not much expansion needed. We are through the new moon and moving beyond the seasonal geomagnetic peak, and all the indicators are calling time (namely, major reversals in both classes). So just watching for the turn again to resume the attack and that should be the final move.

Reblogged this on rajveeronmarkets.
Excellent John, you must be burning the candle at boths ends?
Some astounding moves this week, but none more so than GOOGL. A $67.5 billion single day jump in market equaling the total combined market cap of 415 SP500 companies is incomprehensible to me.
The move in NFLX, with talking head Cramer saying that it is grossly undervalued despite the P/E and having to transform future valuations into earnings in whatwill become an increasingly competitve and crowded space.
Interventionism will eventually wreak havoc in Bond/debt,Stock and Real Estate markets globally.
Thanks Allan
John and others may find Paolo’s models interesting. Funny how the gold model is diverging so dramatically after performing reasonaly well for so long.
http://econocasts.blogspot.ca/
I found Paolo’s gold chart very interesting Allan, thanks for sharing. Are matters going to become unhinged so quickly that gold shoots above $2,000 by the end of the year? Or will the ECB launch GOMO I wonder?
I guess that price level might put to bed any of the manipulation theories eh! 😉
I was also interested to see that his cycles show silver doing very little, which fits with my expectations. I might spend $10 for his longer term cycle charts. I will contact him to find out some background info first.
Having dug through his archives Allan, his models were predicting a gold bottom at the end of last year, so it doesn’t seem very accurate at all. The turn dates keep moving forward!
GM, if you go right back and study his DOW model you will notice that it was working nearly perfectly up until around late 2013 and then………?
The DOW model began diverging, hich even threw Paolo, he has no real explanation fir why the DOW model, which orked for so many years suddenly began to diverge except for possibly being due to CB QE policy which altered the whole macro picture. His XOI model has worked extremely.
My feeling about the Gold model is that just as the DOW model began to diverge, just like the DOW model did earlier, that perhaps CB intervention IS having a much greater impact on cycles than many ever thought possible?
The question that remains is how long can they exert their influence upon the cycle and will their intervention cause a much more dramatic reversal hen it comes?
I happen to believe that will be the case. I have mentioned here before about a quote made by a previous Australian Prime Minister in the early 90’s, at the time he made the quote, he was castigated and riddiculed. Most misunderstood what he really meant by it. In my opinion he was a very intelligent and progressive thinker, that had a great understanding of business cycles etc and what th longer term consequences would be to artificially distort economic fundamentals.
His quote: “This is the recession that we had to have”
Cycles are cycles though Allan, they either work or not.
This bubble is huge, maybe it is throwing out all cycles.
It’s a human bubble though, central banks merely facilitating the conditions for a bubble, humans cause it.
John,
Thanks. The end is near. Check out what happened on Friday. The VVIX/VIX ratio exploded to an extreme which since the end of QE has indicated a near term top is at had. We should see a top immediately or within days.
Here is the link to the chart.
https://www.tradingview.com/x/OkwB7csu/
Great, thanks Bluestar
John, excellent analysis as always. I admire your patience and you seem very calm. Very hard to do in this environment with everybody excited about the PTB “fixing” Greece and China. I think there is a growing element that also cheers the Central Bankers ability to destroy gold. I just sit and smile and shake my head.
Thanks Specie
I have no positions on at this time (setting on Cash) and I am back to looking for a mid-October high for Stocks and low for Gold.
I am speechless. There is a good chance this is the peak, but my goal is to capture the -50% downside and that means staying alive until the drop begins. With IBB at new all time highs, I don’t think I can live with unlimited rally potential without a logical place for stops.
IBB not really unlimited 5 of 5 of 5 is running 405 +- a few bucks
i love reading this blog.
NASDAQ was on fire last week, it must be one of the best 5-7 days rally in many years, but based on what i saw the rally was led by GOOG/GOOGL NFLX AMZN FB EBAY and a few others, actually GOOG/GOOGL was responsible for 70-80% of the rally on friday.
next week AAPL & AMZN report, AAPL is expected to beat expectations, so QQQ will soar even higher, due to AAPL weighting. AAPL is alo in DJIA & SPX,
based on what i’ve heard & read GOOGL & FB are both expected to motor higher
so unless there is some horrible news, i’d say indexes have a good chance of being higher.
could NDX/COMP be starting the parabola phase? i’m short and quite concerned.
appreciate feedback
No, no parabolic phase, but you are early with shorts. There will be more upside until mid September at least.
The best way to play it – impulse is finishing and a pullback should follow. Get rid of shorts when it moves lower and enter a long to ride a few weeks to get back your money:) and enter shorts Septmber-October when the pattern is finished.
This is the problem with bears – no patience to wait until the pattern is finished…
and some like Nicolas look like genius….. in fact he is clueless
hi Karmi. okay thank you for the feedback. it’s just others i’m following suggested to go short on QQQ on Wed/Thursday, and the GOOGL reported.
Agree Nicolas looks like a genius for now. Bio-techs had another strong week. But what’s interesting is that small-caps (IWM) which is weird since many of the bio-techs are in IWM.
Over at OEW, TC is making a bold analysis for the Dow level: https://caldaro.wordpress.com/2015/07/19/the-historical-dow/#comment-210185
Lunar Tuner:
Phase: – effect all week
Distance: – effect M T W Th
Declination: – Th F
Seasonals: – all week
Planets: – – all week (double negative)
Summary: Short sp500 into Monday open, if stopped out will only look to be in cash or reshort later in week.
That was a nice call valley. What is the Lunar Tunar?
And Nicolas, NLFX is the new “buy” you settled on????
Whew!! I’m not sure what else to say here…..
Tim knight has really cool chart that some people here are really gonna love
Is gold down -5% tonight?
I see it down 2%, but yeah, the low looks like down over 4%….
A few more weeks and people will pay you to take it off their hands….. :-O
*shaking head here*
I am sure -5.5% will not stick — maybe it will be -1% or +1% even who knows. But -5.5% is what is reported on ft.com as the worst print….At this point, I don’t care if it is -10%. Maybe I should just hope it is -50% and then I can really load up the truck.
It bounced hard at the 50% fib level, which is interesting.
http://screwtapefiles.blogspot.co.uk/2015/07/1081-gold-bottom.html
It will be very interesting on how the gold stocks react tomorrow. I have been looking for a 120 HUI for the last year. With the possibility of a stiff market correction, the HUI may fall below the 108 – 112 level.
It is clearly a manufactured stop run in gold by the big boys this PM. They are trying to get as the weak handed retailers to freak out and sell as much as possible. Hopefully gold will continue staying this low until the US market open. I am loading up my truck as I see this as an opportunity of a lifetime.
The drop convinces me that the bounce later this month could quickly get gold back to as high as 1200 level, before an epic 8 year low drop in late in the year. Depending on how quickly gold bounces, the sell-off in the fall could potentially drop gold below $1000 imho.
That’s odd my previous post vanished???
Try again???!!!
LOVE LOVE LOVE LOVE when gold gaps down in Asia!
The last time gold gapped down big like this was the exact bottom on 24 th Oct 2008 when it hit $680 in Asian trading only to prmptly reverse in NY.
The rest is history!
LOVE when gold gaps down in Asia!
The last time gold gapped down big like this was the exact bottom on 24 th Oct 2008 when it hit $680 in Asian trading only to prmptly reverse in NY.
The rest is history!
Spoooky….is history about to repeat.
Gold hit a low of $680 in Asian trade 24 th Oct 2008 and reversed hard. Gold hit a low of $1080 in todays Asian session at that point down over $50. Currently only down $16 after reversing hard.
There will be one more lower low, I am watching 1065.
It looks like wave 3 on silver and gold, perfect measurements and usually the panic low is not the low.
2008 was a bull market, which means corrections end suddenly, now we are in a bear market and I expect the low to be tested(lower low with divergence)
A bear market in your opinion. In my opinion we’re still in a secular bull market and a similar situation to the 50% correction in the 70’s when gold dropped from $200 to $100 only to top out at $850 in Jan 1980
Miners in a bear market since 2008 gold since 2011… and this is not even the low just important bottom….
Just admit it – the most severe bear market for gold miners and gold/silver severe bear markets.
Who cares about useless definitions secular or not when they are down for 5 years and more and loses 50%(gold)/70%(silver)/80%(miners)
If you trade 15 years in the future great for you…..
Karni, admit what?…. EWer’s were screaming gold to $200 in 2001 @ $255. For EVERY bearish count there’s one bullish count, in everything, which is why I give EW about ZERO attention.
Outside of USA, gold miners have done exceedingly well. So once again a person attempting to tell somebody how to manage money based upon a totally US based approach.
It is a bear market and it has one more year to go… just accept it and let go.
I will load with both hands too, but when the moment has come.
The same like stock bears…. why just do not wait until the patterns are finished… sorry but trading bias is bullshit.
“It is a bear market and it has one more year to go… just accept it and let go”
That’s a pretty arrogant comment.
May be arrogant, but at least not delusional and afraid to call it as it is.
It is the most severe miners bear market and this will not change because you are afraid to say the words “bear market” and some “who cares” stock in Australia.
“and some “who cares” stock in Australia”
You just proved yourself to be an ‘A’ grade ………!
To Allan, the 8 year cycle gold ismone of the most reliable I have ever seen. Itmis due to bottom in late 2016.
This one at the Alhambra site is worth a read for both Bulls and Bears.
http://www.alhambrapartners.com/2015/07/19/rose-colored-glasses/
Help requested from all those who read the Martin Armstrong blog:
I had always interpreted the term ‘Phase Transition’ that he uses as meaning a ‘Change in Trend’. However lately I’m beginning to doubt my interpretation.
Anyone able to clarify please?
I understand it as a move to a new level in the same direction, so the bubble just gets even bigger.
Thx GM, clearly I’ve been misinterpreting his work. That is worse than the complete opposite of my interpretation. Lol!!
When US QE was first unleashed the bull case
for gold was predicated on an ultimate significant
increase in general inflation and a weakening $.
Well we certainly got asset price inflation but without
general inflation and the value of the $ has not
been decimated.
You are correct Phil.
In fact though, the bull case for gold comes from economic contraction, with accompanied deflation, followed by lack of confidence in policy-makers to do much about it.
Once the global recession takes hold and policy makers are seen to be impotent, that’s when gold will fly. Old-fashioned inflation in prices may re-appear, due to currency collapses.
The dollar will be the last to collapse, seems 2034 is a good bet for that. Japan and the UK in the ‘Sinking 20s’.
How many investors are waiting on gold to crash under $1k?……..does anyone really think that markets are that accommodating??
The manipulators though Allan…… 😉
GM large Commercials are reversing their shorts as we post. Wash rinse repeat.
It is as I have sad all along. Paper markets dwarf physical markets. Why in do people think many miners are underwater. It is why I only invest in miners that I know can endure the hardship amd see it through.
There are bargains out there and many bottomed late 2014. You just have to know where to look.
Something Nicolas and others here are incapable of seeing.
Hi all ! I repeat: please get out of all gold miners, especially ABX which has a good chance of going bankrupt. I remind you that ABX has 13 billion in debt with a market cap of 9B. This is unsustainable.
Otherwise, keep adding to your AAPL, IBB, QQQ etc…
I was thinking about adding NFLX to my portfolio. I would begin with a small position.
Allan, how’s your australian gold stock doing today ?
Why thank you very much. You are free money.
purvez, I don’t think Nic read Jeff Snyder’s post you linked, these comments will be above Nic’s head of course:
‘As for Netflix, with its 300 forward P/E, the only metric I could find in the report that was also triple digits was their cash flow. Unfortunately, it is negative and grew more so by a factor of 3. Yeah, yeah, I know. I’m old and don’t get it, yada, yada, yada, it’s different this time, yada, yada, yada.’
hahahahahahaha
imho
J
???
I think j is rightly mocking Nic’s over-confident ‘advice’.
I wanted to write something, but I think this is the best answer :)))))))
Well yeah, the top is near etc. But I don’t care to pick the top. I care about the best reward-risk, i.e. Sharpe ratio, and then leveraging up the best bets.
well, you shouldn’t laugh. I’m sure there are people listening to John and a few posters here. And they are losing a lot of real money.
I cannot be more clear: stop listening to the bears and avoid gold stocks here.
best regards
Nah, I’m going to buy some tomorrow Nic, there’s blood in the water.
I thought it was supposed to be blood in the streets. That’s where I’ve been looking. Where did this ‘blood in the water’ thing turn up.
You guys need to respect my 2 Brain cells here PULEEEZE!! This is ALL VERY confusing.. (Caps probably in the wrong place as usual).
Yes, you are right, but I was thinking of the surfer attacked by a shark recently.
http://edition.cnn.com/videos/world/2015/07/19/surfer-mick-fanning-shark.wsl
A trend is a trend until it is time to become contrarian… this time has arrived for gold miners.
And for stocks you can enjoy another two months.
I have a question please:
With the S&P within 7-10 points of the ATH, who here believes that we WON’T cross that line?
Nic you are not allowed to vote. LOL!!
This canny trader says a new ATH will be made:
Me, I don’t know.
no, gold stocks will keep dropping, many of them will go bankrupt. The time to buy will be after a long base is built, measured in years.
No, gold stocks will rally for 2-3 months, extremes are followed by mean reversion….always.
For years… hmmmm the miners are correcting for 7 years since 2008 and stocks are up for 7 years.
Stocks will go up and miners lower for years to come… good luck with that.
” gold stocks will rally for 2-3 months, extremes are followed by mean reversion”
Many, and I mean “many” have already rallied. Yoy just weren’t looking!
I agree with you on that. There is chance that what we just witnessed important bottom in gold. Initially I thought it would find bottom at 1130 and form the triangle to 1250 or so but now I am more inclined to C-wave scenario which means even 1450 in just 2-3 months. USD should correct, for now there is not enough momentum in USD to support ongoing rally. Clearly, sentiment in gold is awful enough to support major rally. However If gold breaks under 1070-1080 and USD index travels north of 100 then it means gold crash now.
This observation is quite logical. It is now apparently obvious that stocks and gold miners are mapping out inverse extremes, just like during the 1998-2000 period.
If the analogy mirrors the last cycle then gold miners should stop dropping to lower lows by Q4-2015 and then probably trade sideways in the early beginning of a “stealth bull market” during 2016, similar to 1999.
When stocks peak after the bubble forms in a 2017 climax, then you will see big money flow out of stocks and back into gold miners again to push them up to higher levels.
But it is all a process …
Very interesting…. I am expecting a lower low Q1-2016 after a sharp rally in Q3-2015
Your observation only confirms my analysis:) Thanks!
http://stockcharts.com/h-sc/ui?s=%24XAU&p=W&st=1984-07-20&en=22222-09-09&id=p05130520134
Simo, I’d ditch the XAU chart, gold & silver are going their separate ways, one is industrial, one is not.
I’m almost speechless by the carnage in the mining stocks. I really made a mistake when I bought RIO a few weeks ago. Fortunately, I sold at a small loss.
I honestly never thought GDX and GDXJ would go this low, but with the threat of bankrupcies I am confident they will go lower. As I said, ABX and to a lesser extent NEM have huge debts and will go under if gold stays at these prices. This is a fact.
Allan, did your australian gold stock close up today ?
‘I’m almost speechless’
How can we get you all the way there Nic?
LOLOLOL That was priceless !!!!
Nicolas if I had listened to the likes of you and Martin Armstrong and all the other naysayers I wouldn’t have picked up the bargains that I dd in late 2014 that are now well above their lows.
Nothing goes up in a straight line and a correction here after, in one case, a 750% gain since November last year is nothing.
Doing absolutely fine thank you Nic.
GM
hahahaha……yes, how indeed?
J
recurring animosity towards Nicolas here. My two cents: Don’t kill the messenger.
The participants in the comments section are heavily bearish. If you like that and think that that helps your trading and improves your bottom line, then by all means run the bulls off. But if you want a more balanced forum, then let bulls and bears alike share their views without subjecting them to a verbal thrashing.
You should make difference between bullish and bullshit.
I was arguing for example that European stocks will go higher and now the DAX is 1100 points or 10% higher and it has more to go.
But saying buy IBB when it is in wave 5/5/5 from the 2009 low (there is more upside in the next 1-2 months to finish th e pattern) bearish patterns and distribution in the last year (SPX/NYSE gain top is not in) 9 years cycle top and 20%+ correction expected it is not bullish is just bullshit.
I will not start with how many companies have earnings at all and triple digit PEs.
I will say it again Nicolas looks like a genius because the bears on this board do not have the patience to wait until the patterns are finished. In fact he is clueless and anyone who follows his advice at this stage will end holding the bag.(unless you are a swing trader there is more upside in the next 1-2 months)
‘JUST’ to put the cat among the pigeons….(I’m in that mood, SORRY). Karni, who’s to say that Nic is not a better waver than most of us and that as SOON as he sees the 5/5/5 coming to an end he will change tack?
Admittedly he has never mentioned waves as the reason for his calls but surely he must have some secondary ‘evidence’ to go on aside from his CB friends? No?
Possible.. but I doubt it.
In a few months we will know:)
It’s not because he’s a bull pima, it’s because he’s a troll.
Classic troll style, have you never seen a troll in action before?
I’ll continue to mock him though, just for giggles.
Gold stock ETF’s have in recent years enabled investor perceptions to become distorted.
Unfortunately it has perpetuated a, “can’t see the trees, for the forest” mentallity and made investors EXTREMELY lazy and inept at investing.
This goes for all ETF’s btw. Good investors now are few and far between.
Market looks like an F flag building. So we might get a sell off later in the week. ?
What about yesterday, GOOGLE had the biggest 1 day up in history. HOLY MOLEY! 🙂
http://bit.ly/1CSC7Rq
Does this remind anyone of the tech boom back in 1999 – 2000? hmmmm?
pimacanyon
The animosity is not at Nicolas’ view – most people are both bulls and bears simultaneously. The animosity is directed at his reckless, naive and smug postings. The limited value of buying because CB’s are supporting themarket, and having an exit strategy which involves selling when CB’s announce they are no longer buying equities is astounding….
Hope that clears things up.
J
Well his views continue to be discussed
by posters who say time and time again that
they will no longer comment or refer to them.
You cannot debate with an absolute –
very simple concept to understand surely.
Phil, only jeger has said he will ignore Nic, and he has done so. He’s allowed to comment on the issue surely?
No one else has said they’ll ignore him (not once, nor time and again), as usual, you are arguing with a straw man you made up.
So weird why you do this.
Hi, everyone. Only to say that Major Market Reversals are imminent. It´s a matter of time and we might see marginal new highs but is very closer, best case for bearish, days, worst weeks.
All my indicators are pointing out a severe plunge between 2nd half15 and bottoming 2016
Regards, John.
@apanalis
EWers – have you had a look at the short term waveform of the RUT down from the high? Very promising. Weak as the brown stuff last couple of TDs compared to the big caps also. We were very close to a weekly sell signal yesterday: http://schrts.co/SHnlt7
Ironically, much as happened with the monthly sell signal earlier, this is often the sign to be on alert for a counter move.
Nevertheless, watching the short-term action here with a view to initiating a short position.
The intermediate term pattern looks ugly, I have no idea what it is from the October low…. Best guess in the middle of iii/5 ED. Some one? ideas?
Short term from the low I see impulse… SPX,DAX still not finished to the upside but correction expected I think this should be just “a” from a-b-c….
Personally I would not hurry with shorts.
The beauty of EW – it’s all up for discussion, all the time. Not my primary (or even secondary) trading tool; I do however take note when I see a perfect 5 down, 3 up, especially from a significant high, where there is other strong corroboration.
Small short.
Karni, are you referring to the chart that Ultra posted or some other index?
Ultra’s chart, to me, shows a clear ED up since Oct low and the subsequent breakdown.
I will be very interested to see the COT for gold next week. I would suggest with this weeks flushout that Commercials will be net long come Friday.
I still believe that the potential was that Monday’s asian low was a very significant bottom.
Many Aussie and Canadian gold stocks bottomed late last year.and are diveging with lower lows in the USD gold price. I have always expected that gold stocks would put in their major bottoms well ahead of gold.
Finally, ETF’s now distort moves to a greater degree. ETF’s have swollen in size in the last few years. Comparing moves now to even hlalf a decade ago is very difficult. The majority of investors now have a huge lack of ability to syphon through stocks in a sector to find potential outperformers.
The reasons for this huge bull market are also the reasons why it is going to end in catastrophy. An inability of investors to quantify and correctly price risk and the huge explosion in ETF’s.
And today this Frankenstein market went full retard. FB now exceeds GE in terms of market cap despite forward earnings of FB being less than one qtr of GE and in existence for a fraction of the time.
This market is every bit as absurd as the dot com bubble and probably more so.
And to those pundits expecting new ATH’s, Houston we have a major problem:
http://stockcharts.com/h-sc/ui?s=%24TRAN&p=D&b=5&g=0&id=p91057155625
Is today the start of the much awaited crash or will the Bears be dissappointed yet again if we recover the losses by end of this week?
Would that be a rhetorical question, Karni? In which case please do tell. Ta.
Patience, this is only week 2 from the new 40 weeks cycle.
SPX the price is above MA50 on the hourly chart and I expect a touch and move higher… nothing interesting for the week.
The price likes to “dance” with MA50:)
Thx for your response Karni. Much appreciated.
The DJIA is down about 200 points but the S&P is down only 12. I would have expected the latter to be down about 20. Anyone got any technical comment on whether I should be reading anything into this discrepancy? Thx in advance.
Hi Purvez ! A good portion of the dow jones drop is due to IBM today, which is down sharply. That’s the reason it’s a bigger drop in % terms.
You actually seem to know quite a bit about the markets, despite your one-way views.
Thx for the explanation Nicolas. Good to know you are on the ball.
You ‘WILL’ let us know when you turn bearish….won’t you? I’m looking forward to taking that trade with you. Can’t say I want to join you on the ‘up side’ at this stage.
That and United Technologies, Nic.
good opportunity to sell/short GDX and GDXJ today. Today is a small respite, before a continuation of the bear market tomorrow.
Armstrong seems to be convinced that there is downside movement for gold down to 600-700. That the bond markets will be in trouble in Oct and this will drive capital flows into stocks and equities causing an eventual blowoff top in stocks. What do you guys think about this? http://www.armstrongeconomics.com/archives/35149
Also, GM I would like to hear about your thoughts on silver?
Biego, I view silver and platinum and palladium as industrial metals, tied to the economic cycle.
I don’t think the prices of any of those three will shine for many years, whilst gold moves up by thousands of percent. Many retail metal bugs are holding silver, but no one else wants the stuff. I only own gold.
I have another question please:
Since when does the market go down BEFORE APPL’s announcement?
All this is very weird. Anyone got any thoughts here, please?
I find it weirder that the market is not down more.
QQQ -8bps as of right now.
Since July 8th, QQQ:SPY is up 5%…quite a big outperformance…AAPL is a big component in QQQ.
Yes John Li, something doesn’t add up. I want to be short but who in their right minds would do that before Apple’s announcement? However I suspect this market is ‘telling’ us something. Not sure I understand the language though.
Perhaps they are just drawing in more bears? Would that be it?
This is the 8th day of outperformance in a row.
Just to illustrate:
http://stockcharts.com/h-sc/ui?s=QQQ%3ASPY&p=D&b=1&g=0&id=p79375293997
The market is telling us to go all-in the new-economy, and ignore the real stuff like gold, oil, food…you know the things that we live on.
Can’t speak for others, but I capitulated on GDX at $17, and I am not being drawn in. I am sure at some point it will rally from $14 to $17, and I will miss that rally, but then I will be getting back in where I left off.
John Li, thanks very much for that chart. All I can say is that whenever something goes ‘that’ Vertical then the outcome is to reverse violently as well. As always timing that reversal is a bummer.
The market is psychic. Either that or the news leak 😉
Oil is bottom
Explain yourself
Oil is not bottom today. 😉
Time will tell
Time has told, it dropped 2% the day after you called ‘bottom’.
Doh.
It not day or two
If I know exactly, I,m rich
Market will make new high soon
Target spx 2150-60 next 2 week
I bought erx yesterday 43.20
Wait for 3,4 months 65-70
Oil still no bottom.
Good sign hold $48
Oil rebounds, long term make money than short terms
Market will pull back
I just bought uvxy
Hmmm….so Apple is like all others. Susceptible to a ‘down draft’. Who’d have THUNK it?
Apple, Greece, China, Iran, the weather: there’s always a time when the market has too few buyers to go up, and a few sellers will knock it down, whatever the supposed reason.
Whatever Apple reported today, it was just *time* again for a turn down. The topping process is dragging on, as befits such an enormous bubble, but the clock is ticking.
Meanwhile, I am ordering some nice shiny gold Lunar coins tomorrow, only £730 an ounce, and no CGT as coin of the realm. Mmmmmm.
Hope you shorted and made a ton
slater9, I can only assume, has been riding IWM short from 126.7 via his .886 algo setup that he has demonstrated here many times – chapeau, monsieur!
http://stockcharts.com/h-sc/ui?s=IWM&p=5&b=2&g=1&id=t12896623000&a=417024229&r=1437512620441&cmd=print
I really must figure out a way to program median line sets…
Agreed, ultra909
Ultra, please may I ask what the .886 algo means? I’ve never been able to understand slater9’s charts sadly.
One can tell that he clearly DOES know his ‘system’ but I couldn’t make out what that ‘system’ was from his explanations.
I looked at the chart that you posted above but couldn’t see the .886 algo on it either.
.886 algo…
– 5 min chart
– one of the ETFs e.g. SPY, DIA, QQQ, IWM, FAZ etc.
– gap open
– enter upon an 88.6% retrace that intersects a median line set
As you can see, the above chart is a clear example. The beauty of this setup is that you get in very close to the high with an incredibly tight stop => maximum position bang for buck risked.
As I recall, when this setup fails (i.e. the up move is not over), most likely the down move stalls and morphs into an a-b-c / 3 spike correction.
Total dynamite.
Ultra thanks for the explanation. It would help me a lot if you could annotate where the ‘gap open’ was and what was the 88.6% retracement on your chart. Thx in advance.
You don’t have a StockCharts subscription, I am guessing. Chart is seemingly garbage if you don’t. I will post a screenshot later..
Screenshot: http://postimg.org/image/aiwzpgq9f/
Ultra thanks very much for the image. It did help a lot. I have one question. How did you arrive at the 126.74 Pivot High point. On the chart it doesn’t look like IWM got that high.
Sorry to keep asking but I am keen to understand this because I’m sure I could use it once I do. Thx in advance.
Sorry, don’t follow you. 126.74 was the HOD, as clearly shown on the chart.
Lunar Tuner:
Phase: – effect all week
Distance: – effect M T W Th
Declination: – Th F
Seasonals: – all week
Planets: – – all week (double negative)
Summary: Shorted sp500 last Friday, so far so good. This “could” be a nice down move lasting a few days. Happy shorting!
Well done, Valley.
I’m no trader, but it seems the Dax has 4-5 days where it runs out of steam, and then the next leg down begins. Ripe for a short now again IMHO, down to 10k this time?
http://screencast.com/t/Fon2hDSmw9N
I disagree massively. The drop yesterday was due to the strengthening euro. I’m still expecting euro dollar parity and a massive rise in the DAX as a result. I did manage to get short the Dow though and made back most of my earlier DOW losses. Thank you IBM! Looking to add to DAX longs over the coming weeks if there is continued weakness.
Well, that’s the first ‘gap up’ filled on the way back down.
You may be right krish if the euro collapses some more (BIG if though), but in the short term, there would appear to be good money to be made on the short side as those gaps are filled.
Krish, interestingly today the Dax and the euro are down.
Yes it is interesting. I still have my DAX long but havent added to it yet. Today was a follow through from yesterdays panic sell. Lets see how the next few days pan out.
You’re not getting any sense of deja vue yet then? I know I am, this will be the 3rd time around.
JH,
This might be the top, but not yet the waterfall. Here are my counterpoints.
1) margin debt to gdp is at the high. (And let’s say it doesn’t go higher) Like 11/1972 or 11/1980 or 3/2000. These markets continue to frustrate put buyers for 6-12 months before the waterfall which is closer to 1974, 1981 and 2001. In other cases, margin debt peaked before the market, like in 1987, granted 1990 was in Japan.
2) this is year 3 of the presidential cycle, which has supported stocks. Not a stretch to think we have peaked but can whipsaw for the next 5 months, then dive in Y4.
3) At SPX -20%, like 1/2008, the fed will say or do something. We didn’t hit there, and so I think it is hard to call this rally a second chance.
Conservative bears will win. History will still see 2015 as the peak. But splitting hairs over your “on the attack” strategy. I am thinking up and down frustration like in early 1973, 1981 or 3-9/2000.
China is a different story. I assume it is so levered that waterfall and margin peak can happen at the same time.
Your comments are very welcome.
APPL I would discount, the SP % increase YTD and
over 1,2 and 5 years makes any one day move
almost inconsequential.
The post results move in IBM was more interesting,
although it did run up a little pre results – helped by
the market rebound.
John Li,
Good post.
I wish there was more of that type of comment here,
from a bearish/cautious perspective with may be a slightly
different take on how/when this develops.
Thanks Phil. This is not meant to critique JH, but rather myself. I keep looking at those IBB puts, and I remind myself that I could get the top, but still not make money.
I have sold my position in the SP500 this morning at 2118.
i will review whether to repurchase it on the 9th Aug.
Will
Will,
I was hoping you might elaborate on the Year 3/Year 7 historical blackout period you mentioned in your last post. Would like to know more, thanks.
13.22 BST…bought xx Gold lunar 1oz coins @£717 each.
Re-test of the plunge bottom.
We might see lower gold prices yet, but on a 3-20 year horizon, I’m happy with these prices.
The UKX once again gets battered on any risk off
sentiment, with commodities having such a large weighting.
Gold, not much you can say except this is not
acting as many would have expected.
yes, most have been expecting something completely different for gold for that last 4 years! Rambus continues to nail this long decline. He now has a target of 850.
Why would you expect gold to be anything other than weak (ending its bear market) whilst the risk markets are topping out?
Serious question?
Come on Phil & pima, it’s good to chat, any thoughts on my question?
wonder if I might ask, not being a subscriber, what are Rambus’ targets for SPX?
7/22 9:07 Spiral update – Lab 7442 forecasting a Spiral radius of 1995 near August 9
1995??
Spiral update 7/23 10:20 First price target 2052
It would be nice for my SPX puts tbh…:D
J
There is chance for gold bottoming here if it does not break Monday lows, also crude may correct sharply. Too many betting on USD
I think this guy may be spot on:
http://elliottwave5pointzeroreboot.blogspot.co.uk/2015/07/us-dollar-intraday-review.html
I’m expecting the dollar to continue to strengthen (safe haven perceptions and money flows, but also *dollar* shortages globally). At some point, gold will be rising in all currencies, including the dollar. Quite soon I think. Industrial commodities will tumble further, as global trade contracts.
An in depth analysis of the cabbages on the famous Walrus website reveals that the time has come, despite nothing said.
Peter, I follow and appreciate your website, and that is very straight-forward…
That said, I have nooooo idea what you’re saying here…. ???
Peter_ are you one of the authors of the Time’s Cryptic Crossword?
Have nephew MSc IT GCHQ MI6 trying to keep it away from the snotty spotty spying snitch dept soasto befuddle intervention intelligence.
Haha. Don’t know about the spying snitch dept but you sure are befuddling me!! 🙂
That said, continuing to watch the erosion in the HY market, and even though a bit disappointed we haven’t seen more of a sell-off in the general SM today, feel good about where we are HY-wise….
Still 100% short in my SM trading system, and very short the SM myself….
Been a trying couple of weeks, these past days, but as I said, watching HY continue moving lower is indicating where the SM is going, I believe….
Yes, Barry, not many have been paying attention but HY has been quite weak of late.
Here’s another one for the Bears to drool over:
http://rightsideofthechart.com/us-equity-market-overview-video-static-charts/
Looking like march-april 2014, made a big move off the lows, traded sideways for a couple of weeks, then moved +6.5% from may into july
Daily indicators rolling over from highs, swing trend indicator on full sell. Cautiously bearish since 2110 (25%) 2120 (25%) and 2125 (Friday deployed remaining 50%)
Oh and I shorted Nic’s IBB @ 396 and change. I’ll hold that short.
I’m sure JH knows divergences can take months to play out.
And I bought 2055 (25%) 2045 (25%) and 2073 (50%) so had a nice bull move.
Good trading, Geno! Congratulations.
Valley,
Whats your system saying after this week, when is your system switching to long..after aug 7th ??
bill
The decision to long/short US equities is based upon several factors, combined with looking at the chart. Say if all of factors negative (like now) but price has already sold off, better to remain in cash and not short. Or conversely if all factors positive but price has already ramped up, better to remain in cash and not go long. I am personally short at moment and will remain so until stopped out until at least Friday morning. Beyond that mixed bag, not a clearly bearish as right now.
No hindsight trading please:D
J
The past informs the present which becomes the future.
If you’re referring to my trading, I posted on this board to get long when the SP-500 was trading at 2045. Then last week I posted I was getting short, again on this board.
I also posted this chart
Did anyone else buy gold (paper or physical) or the gold miners in the past 2 days?
(Sentiment survey).
Don’t know enough about it to put any money in it…but the EW perspective is that we should soon be heading upwards towards the high 1300s, FWIW.
It’s nice yellow shiny metal thing p. 😉
GM, hehehehe!! Yes that’s what my better half keeps telling me, and I keep asking her what the ‘investment’ angle is? She say’s it looks very nice on her. Is that a good basis?
purvez, if you click on my GM, please send me a mail via the contact form. I have a suggestion for you.
I entered long position in futures yesterday, tight stop at 1080
I have been accumulating miners the past few days. Buying in small tranches with tight stop. I am hoping for a strong bounce, before the final washout in the fall.
Hi GM
Yes, upped exposure to gold miners in long term investments over the last 2 days. I am not *trading* miners or gold though.
J
am starting to think that I may start some exposure to oil equities again soon. The oil price outlook is not too rosy but they have been hammered over the past year.
I’m sure long term those miners wlll be a great buy j.
Not so sure about oil, I think it’s headed into the $30s myself.
Yep, certainly if you look at Cushing and the lack of supply fall-off I wouldn’t be too surprised, however I am talking about oil *equities* – who are collectively almost 45% down from high last summer in a lot of cases. Also for a longer term holding. Might start to build a position soon.
imho
J
If my long-term predictions are correct, oil will be low (priced in Euros) for many decades, but there’s a good few years before that arrives. I wonder if oil equities could lose another 30-50% in the next couple of years though, as recession bites.
I was wrong about rambus. His price objective for gold is 750. Silver: 6.25 – 8.50.
http://rambus1.com/?p=41180
Hi Purvez and all ! I reiterate that you should avoid the weak sectors like gold and gold stocks, and focus on the strong one like IBB and QQQ (which are near the highs again).
Excellent earnings by AAPL yesterday, i don’t know why the stock was down, i have no idea but it should last too long. I hope you’ve loaded up on AAPL yesterday.
Nic, you have no idea why the stock was down but are confident it shouldn’t last too long? How can you not know something but then know that that something, whatever it is, won’t last?
That’s nonsensical – your logic professor would fail you, I’m afraid.
At what price would you buy GDX?
I’m close to buying Gold and the miners
“I have no idea”
Finally we agree on something.
J
Made me chuckle… 🙂
Two levels to watch today/tomorrow
GM – Yes… SLW (for LT), and JNUG (for ST) earlier this AM…
I’m sick about the miners/metals, so past history tells me we’re around the bottom ~somewhere~ in here…
Should we tell that Bodkin bloke? http://barestbodkins.blogspot.com/
Peter_ given your communication prowess I would have thought that you’d told that ‘bloke’ already. In fact he would be MOST UPSET to hear it second hand.
Gone long Dow at 17720. The next leg up I think will get to 18150.
You are a brave man !
Stop loss at breakeven. Now running with zero risk. I’m pretty neutral about the success of this trade so lets see how it plays out!
Hi ! I’m ready for AMZN earnings, the stock should jump after hours. I didn’t understand the market reaction after earnings which were excellent. It didn’t seem rational to me, so I viewed it as a buying opportunity.
I see that GDX and GDXJ are making new lows today, as expected. There’s still a long way to go in this bear market.
regards
yes but first it will jump 40%-50% for 3-4 month to crush bears like you who think that are very smart….
You said it best karni. Yes, the rally shall produce at least 40%-50% before gold takes a final trip to below $1000.
After that… the moon is where gold will be.
erick, I don’t normally even try to understand Armstrong’s arrays, but this image has some clues, looks like a 2nd ‘square’ early in 2016, targetting around $1,000. Any thoughts?
http://www.screencast.com/users/Gary_UK/folders/Jing/media/5065795a-3747-4dda-88c8-0b07f99576dd
I meant: i didn’t understand the market reaction after AAPL earnings….
simple smart money is taking profits and hand over the bag to the bag holders:)
we won’t know who’s the bag holder until we see AAPL’s price 6 months from now, or a year from now, will we. Below 100, yeah the bag holders will have been fleeced. But what will you say if AAPL is trading at 160 or 200?
I will say I was dead wrong. I have no problems with my ego:)
But I am a trader not a long term investor so I can change my mind any moment when I see something going wrong.
GDX only down 4% today. That’s a good day for GDX….
Allan, what’s your gold stock portfolio doing today ?
Scalped SPY long @ 209.80 looking for a pop up to 211.50 or so before we sell off again.
Amzn up 10% after close on earnings.
Yeah, I think I’m fading the pop in AMZN tomorrow.
OK, AMZN totally exploding after hours, as predicted again. People on this board were mocking me when I decided to buy at 448$.
I don’t want to brag but it’s honestly so easy to make money in this market.
I believe Amazon actually turned a profit, fancy that.
Don’t forget Nic, it ain’t money made until you’ve sold and banked it.
I continue to be amazed.
BIIB down -20%+ in the premarket. Thanks, Nic, for the buy recommendation on the biotechs.
Dragging Nic’s IBB down 1.7% premarket. Remember I shorted Nic’s IBB @ 396 and change.
John Li. As regard to GDX, my 2 cents is that $13.50 is a support I want to see in order to view today as a completion of wave v of 3. (I’ve been averaging down, buying since $14 ish). The intermediate bottom is very very close imho.
If the rally lasts about 5-7 weeks, then that would be a solid confirmation that this count is correct.
http://www.armstrongeconomics.com/archives/35296
Armstrong makes me laugh. He always publishes the fan mail, but I emailed him recently pointing out some of his contradictory views, and that I haven’t lost my shirt, house or dog being in unleveraged physical gold, as I can just sit (and buy) through the dip. He won’t publish any of my email, even though I dared him to.
He’s anti government an anti-socialism, but moans that savers will lose their *money* (as in Cyprus) when banks fail, and claims that as robbery. Well, Marty, you can’t have it both ways old chap. If banks fail, their creditors must suffer the losses, or those losses will be socialised.
GM, mate I gave up on MA ages ago.. Yes his ECM has merit, but as you point out he covers up his mistakes. And there are PLENTY!
I have also emailed him to ask questions about his past grossly incorrect predictions, like back in 2011 on gold going parabolic to 5k, interest rates rising from 2012 onwards, to name but two…..no reply 😉
Funny how he now castigates gold but back in 2011 he was talking 5k gold. How many investors did he push into gold on that talk?…..only to do a 180 degree about face???
In a world of muppets, idiots and motherfuckers let’s do what people like Nicholas do.
Just let us know when you sell, not after….
J
It’s not like AMZN’s share price has factored in future growth or anythig is it?…..
LMAO…….muppets to the front of the line!
19c for the qtr. It could be 10x that and it’s still grossly overvalued……..Deja vu 2001
Yep everything is just hunky dory in fantasy land…..NOT!
http://stockcharts.com/h-sc/ui?s=CAT&p=W&yr=5&mn=0&dy=0&id=p81698410812
http://stockcharts.com/h-sc/ui?s=%24COPPER&p=W&yr=5&mn=0&dy=0&id=p69802207411
Copper taking out 2.4 yesterday was very significant. Key support level gone. Deflation is in the air.
This gold move is stunning.
So much for equities selling off hard
while gold appreciates in value.
This must give JH pause for thought, surely.
I am back to looking for a mid-October high in stocks and low in Gold.
Yes Phil stunning but not as bad many think depending on where you look at it from.
Most of my ASX Aussie stocks have weathered the fall very well, especially given that many have been up very strongly since last year.
Will add very soon.
What is most interesting is the premuims on physical in Oz atm and I ssume elsewhere.
That is what is so distorted about this whole Au/Ag market. Try and buy physical in any quantity anywhere near spot.
I’m not sure I’d class a 7% price drop stunning Phil.
If it had fallen 20%+ I would do.
Washout falls tend to happen at the bottom of a bear don’t they?
Hi GM, I don’t know how to interpret MA’s computer forecasting array. However, he’s been on the record saying gold dropping below $1000 during the fall or early 2016 which I tend to agree with. The sell-off in gold so far is playing out the scenario that MA computer had predicted in June. Perhaps the 2nd square refers to the gold bottom around $950 in early 2016?
On another note, gold undercut low action tonight makes it fall very close to the 3 year support level of 1030, where I expect heavy buying by institutions may rally gold backup overnight. The sentiment is super bearish right now, hence the bounce is imminent in order to reset sentiment, and prepare the market for the epic fall of stocks and commodities later in the year. This no doubt will present us with an once in a lifetime opportunity imho.
Well over three quarters of the worlds producers underwater?
That is why COMEX trading in PM’s should be abandoned. Futures were originally setup to hedge risk not to allow abuse. They no longer serve the purpose and have become nothing near to what they are meant to do.
It is a scam and yet allowed to carry on unabated, in fact quite the opposite, assisted by a totally corrupt establishment.
This has NOTHING at all in common with supply demand…..nothing.
Banksters have ruled for so long it can only change if they are successful in destroying each other. But first the people along with their economies and the last standing will undoubtedly be a giant whale leech bankster.
Some analysis of ‘manipulation’ here Allan:
http://kiddynamitesworld.com/gold-manipulation-continues-unabated/
Once you’ve read this Allan, you’ll surely agree the hype re Comex is just that:
http://kiddynamitesworld.com/precious-metals-charlatans-freaks-of-the-industry/
They had a chance to sell future production at higher prices. That is hedging. Whether they did it or not is their problem.
Maybe erick.
Perhaps early 2016 will coincide with the 2nd chance rally for the broad markets?
My hope is that gold continues to drop to 1030 … get it over with, then bounce violently back to 1300 within a few weeks. If gold bounces now, all we get might be just dead cat bounce to 1140, then continues sell off to 1030. imv.
From Bloomberg News:
The worst commodities slump in 13 years is wreaking havoc for investors seeking to profit from companies in distress. Distressed bonds have lost 8.2 percent this month as oil and coal prices slid, bringing this year’s loss to 12.2 percent, according to a Bank of America Merrill Lynch index that tracks the debt. The securities are on pace to lose more than 20 percent for the second straight year, the worst performance since 2008.
Just a FWIW comment. Someone pointed out to me years ago (on the way up to the August, 2011 highs) that the entire extended move in gold during that time began with a gap at 1073. In these markets that probably doesn’t mean very much but an interesting trivia observation that according to Elliot this would be an area of support.
That is great observation and adds to bullish case in gold
The Gold Miners Bullish Percentage Index has hit 0% bullish. This has happened only twice before. The first time the Miners rallied for over 24 %. The second time they rallied for over 36%.
https://likesmoneycycletrading.wordpress.com/author/likesmoneystudies/
Can the bullish percentage go negative after today? 😉
Bargain time.
‘Even its role as an asset is in question, says Macquarie’
Great quote from a bank ‘analyst’ on gold.
Too funny.
I’d be interested to see valley’s lunar chord predictions for next week.
As I type (14.25BST), just ahead of the US open, I see those ‘heavy’ candles in many markets: Dax, silver, copper, and gilts and USTs are being bid well.
No ‘news’ driving any of this (no Greek or China nonsense), so it looks as though the buyers of risk are getting out of dodge fast. Could be a worrying weekend.
Oh look, as they’re speeding out of dodge city, they’re waving out of their car windows? I can see someone in the distance waving back, he wants them to stop….I think it’s our Nic, left behind by his casino friends. Bummer.
There was some news out of China:
China’s manufacturing activities are at 15-month-low. Markit’s flash manufacturing PMI fell to 48.2 in July, down from 49.4 in June and weaker than 49.7 expected by the street. A reading below 50 signals contraction.
I have next week as weak. Sell rallies.
Dax about to fill a 100+ point gap, easy short money. (I should be trading these).
15.22BST.
Valey,
please update your thoughts for next..awesome insights for last two weeks..you are spot on..please share…
A great quote from Bob Hoye for those who think CB rate decisions matter at all:
‘The other distraction has been about when the Fed will raise rates. The event and all of the discussions about it just doesn’t matter. In the culmination of financial manias, the senior central bank has been months behind the changes in market rates of interest. That includes 2007, 1929 and 1873. Also when credit markets become fully stretched, they have had no influence upon the action in spreads or the curve.’
*No influence*.
Hey, i’m still waiting for the congratulations for my AMZN trade, and my predictions on gold and gold stocks.
Everything’s going smoothly. We might have a respite soon on gold, but the bear is just beginning.
regards.
AMZN pulling a reverse CMG – Buy puts. I got the Aug. 580 for for 28ish
Nice “trade” though.
The bear is just beginning in gold?? Nic, I’m worried for you, mate. You do seem to be a bit removed from reality.
Stocks down and gold down. Maybe they are positively correlated now! My dow long was stopped but started buying the dax again today. I believe I will hugely rewarded by year end. Just a repeat bear trap like the greek situation.
My scalp long is a loser. Still 100% short dropped SL to 210.23 on SPY
Do you not look at the Dax chart Krish? Or credit, or commodities?
I hope you have very wide stops!!
Good luck.
1070-1080 seems to be important support for gold and there are sign base is building for significant advance. Same for crude and Euro
I am and longer term the picture is still bullish.Today is just one of those intra-day swings. A lot of money has been taken off the market lately and there will be a wave of buying as investors look for the value in europe. I am not worried.
well as I said many times before, please use guaranteed stop losses. It feels like one of those change of sentiment times where we are potentially in no man’s land. SPX puts looking good so far though.
J
Breakaway gap to the downside on Monday? Throughout this bull phase, down Fridays have always threatened but never followed through.
Nic, is this time different?
Hi Gary ! I’m still bullish, although there are some signs of stress. High yield is really dreadful, terrible performance lately. Oil is also problematic here, if there’s another leg down in the oil price, oil stocks will crumble.
So, i would still be long IBB, AAPL, QQQ etc… and short oil and gold as a hedge.
(although the gold sector could have a small dead cat bounce soon)
Fair enough, I appreciate the straightforwardness of your reply. So no breakaway gap on Monday – in fact, it’s another BTFD opportunity.
Ok, let’s see how this plays out – you’ve been right more often than wrong playing the momentum game. But maybe it’s time for a little mean reversion 🙂
Hi Nicholas.. wow the move in IBB last week & especially on Friday was incredible, it has retraced 618% of the move up since july-8th (which was one crazy run-up.
BIIB got hammered last week,down 22% on Friday and down $112 since Tuesday and has erased ALL GAINS since nov-2014. REGN CELG & GILD all got hit badly.
i was shorting IBB for last few weeks and decided to cover on friday, as my gut feel is that TPTB won’t let IBB fall just yet. so i decided to buy the dip.
NOTE: there was a huge BUYING ON WEAKNESS friday 1.08 billion and 491 million on Thursday and 126 million on wed – usually after such a large print the market rally’s the next day.
my indicators show that the big boys have been buying, and they’ll want to make profits on those stocks,
i read several blogs, and it seems to me, that indicators or timing cycles just aren’t working lately, just about everyone i follow was wrong last week on ALL days. and then NEWS well IMO no indicators work based on NEWS. and we had lots of news the last few weeks, including friday LEAKED FED SPEAK.
Lunar Tuner Next Week:
Phase: – all week
Declination: – M, + T to Fr.
Distance: + all week
Seasonals: + M to Th, – Fr
Planets: — all week (double negative due to Venus Inferior Conjunction 8/15).
Summary: Will carry short into Monday morning. Next week mixed bag so no clear trade until Monday prices start to print. Good golf, tennis, or whatever makes you happy!
Your short trade this week hit it out of the park, Valley. Very well done…and could Peggy be right? Is 1995 in the cards??
Every time we get to this point, markets have reversed.
Monday should be down based upon Lunar Tuner and today’s sell off. Beyond Monday, bullish rest of week altho’ Venus conjunction is wild card cause it is a price magnet down until 8/15.
By the way, ~1995 represents the major uptrend line from the 2011 low.
Congrats on your trade Valley. Well DONE!!
In cash not short, waiting for Monday open to decide.
From TradeTrekker.com –
A ‘perfected’ DeMark 9 count TD Buy Setup should complete in the first half of the session today. With the deep retracement from last week, the strategy of following price flips is back in play.
The U.S. has looked weak all day long so will need to see how next week goes. Investors are most likely booking profits rather than anything else. Was just reading some articles and saw citigroups prediction of 7700 this year for the ftse. Funny how badly wrong these are sometimes!
The action in the DJIA, at least, since the beginning of this week looks quite ‘water fallish’.
Took the full moon train @ 2125 SPX headed for next new moon inversion.
Accumulating physical PM;s Gonna blame Bodkin if it don’t work out.
Peter_ do you have a destination target for the new moon train?
Mustn’t blame anyone other than yourself. Rule No1 of life my mother said.
My interim targets are initially to be without loss and further to follow the chart until it weighs in against the trade. Counting this down move as commence of a 5 leg C that could stand alone or become the A of a larger pattern. From the ATH this is either P4 or what John has been expecting. I see the P4 take falling by the wayside below SPX 1820 but the P4 take only needs a new ATH to evaporate.
purvez, I replied to your message by email, if you haven’t got it, check the spam folder, or let me know please.
GM, Sorry can’t see it. Did you send it to my free-online account?
Peter_ thanks very much for your explanation. Understood ALL of it. Either I’m getting better or you’re slipping 🙂
Yes purvez, to the email you used. I’ll send it again.
7/24 14:37 Spiral update – adding a price target 1949
Hi Peggy
Is Spiral expecting a move straight down to 1949 level or could we see a possible move up during Fed meeting result on Wednesday next week?
Thanks
Kurt
1st target 2052 (sept futures)
October blow off Top:
http://finance.yahoo.com/news/tom-lee-stocks-just-did-124815486.html
Richard, we are to attribute significance to an event that last occurred in 1904? The statistical significance of this is what??
Frankly, I’m embarrassed for Tom, assuming the author quoted him in context.
A gap down on this on Monday would be about as bearish a reversal possible. An “exhaustion gap” with a “island teversal”…..let’s see?……….of course Nic sold no doubt 😉
http://stockcharts.com/h-sc/ui?s=AMZN&p=D&b=5&g=0&id=p48900623476
The contrarian in me is salivating. Keep whacking it boys and girls so I can load as much as I can!
http://www.bloomberg.com/news/articles/2015-07-24/hedge-funds-hold-first-ever-net-short-position-in-gold
COT Report… Wow.. Sorry Nic.
Commercial short-long is probably the lowest I’ve seen in years. Only 22K or 5% of open interest. Major bottoms typically form within the 6-10%..
http://news.goldseek.com/COT/1437766313.php
“Was just reading some articles and saw citigroups prediction of 7700 this year for the ftse. Funny how badly wrong these are sometimes!”
WTF? 5 months left……??
The moon was shining sulkily,
Because she thought the sun
Had got no business to be there
After the day was done–
“It’s very rude of him,” she said,
“To come and spoil the fun!”
the tools I use are old school ,simple and repetitive
the key to their use in trading the indexes and index etf’s
is the knowledge that the computers that run the markets
rotate the BEST SIGNAL through the the indexes… at the June high
I showed the SPX triggering a test and retest sell
at the early July low I showed the QQQ trade to target line then trigger
test and retest buy
at the recent high it was the TNA’s turn
price traded to target line the triggered test and retest sell.
http://stockcharts.com/h-sc/ui?s=TNA&p=60&yr=0&mn=3&dy=0&id=p51017820247&a=331801219&r=1437869675237&cmd=print
there was more
have stated in the past that my best trade setup entry
is an abcd into 382/’447 box at line
the computers triggered the setup back to back so that their intent
for price was unequivocal.
http://stockcharts.com/h-sc/ui?s=TNA&p=15&yr=0&mn=0&dy=8&id=p40514050684&a=399041325&r=1437870721671&cmd=print
Puetz has said the negative phase of the crash Cycle starts Aug 14. The preponderance of crashes (2nd chance top) start on the lunar eclipse, Sep 28th. However, the lunar eclipse marked the low in 1929. Another thing to look for is a 6 week topping pattern. Out of 15 crashes, 8 had 6 week topping pattern, 3 had 10 weeks and 3 were 0.
Notwithstanding all that, the market has two Elliot Wave 1-2’s which would mean we are on a 3 of 3 down. The sharp sell off fits that scenario. However, this is the fifth sharp sell off in the last year.
Doom list update:
#1 Price Action
#2 Planetary alignment
#3 Natural disaster – asteriods; mini-ice age etc.
#4 Biblical
#5 Pensions
#6 Jim Carrey’s Dumb and Dumber III gets financing.
#7 Puetz crash window – oh dear – wish I hadn’t read that one.
Nicolas changes his investment thesis to Gold.
to correlate just chew harder…
http://www.zerohedge.com/news/2015-07-26/big-bad-bear-case
Mental mastication leads to rapid exasperation,
better follow the lunar tuner it will guide you to profits sooner.
Like zen monk no preferences required,
Just determine the direction and the equity moves higher.
Eliot Wave worked B.C.E. (before computers engineering)
Lunar seasonals work A.D. (after deduction).
Join the Lunar Tuner wave,
To technical mumbo jumbo you no longer slave.
Nice little poem.
Let me try one….roses are red, violets are blue, some poems rhyme, but this one…doesn’t.
Bugger.
This outbreak of poetry on the blog is a very welcome divergence imo.
andre (back in early February):
‘I have 2 critical dates : may 16th and july 31st.’
Next Friday…..?
TNX again SLATER
Again it is key to know the rotational process
THIS HAS EVOLVED OVER RECENT YEARS//
it used to be 7 years ago that they would all set up together
Shaighai Comp in freefall again dropping out of the bearish wedge formed the last two weeks.
Just shows that once it starts it’s impossible to stop even if you ban selling. Martin Armstrong btw said two weeks ago that China was NOT having a US 1929 style collapse…….we’ll see if he got this totally wrong too.
http://stockcharts.com/h-sc/ui?s=%24SSEC&p=D&b=5&g=0&id=p87177873661
And bond king Jeffrey Gundlach has often parroted the meme the Shanghai is an excellent leading indicator for the S&P 500 —
http://www.forbes.com/sites/antoinegara/2015/07/08/jeff-gundlach-says-chinese-stock-bubble-aftermath-will-last-for-years/
Good retrace from the recent move up in the dax. Have started layering in long positions here as there will be good buying support coming in. As I’ve mentioned before the DAX is very undervalued and it’s only a matter of time before it hits 12k again.
Krish, if you have a look at a multi-year chart of the Dax, it’s blindingly obvious that the past year or so has been a parabolic blow-off, with the first serious support at 10k. I’m not trying to score points, I just hope you are very careful here.
http://screencast.com/t/dSSp6IJ0B7F
if we see a bounce now and one more lower low switch to the bearish scenario

Krish
Looking at that chart, I wouldn’t know where I would want to place stops? Are you still holding DAX longs from 24th as well? Just be careful.
J
I’ve closed my longs on the break of 11100. Will re-enter on a more positive candle. Its starting to look oversold now so expecting a rebound even if it does eventually go lower. Maybe the stock market may fall to pieces about 1 year earlier than I expect so yes I am being cautious. The euro strength isn’t helping either. Great day for the bears though…I clearly got my call for 12,000 soon wrong!
traders waiting patiently for the computers to show their
hand in GDX were rewarded on Friday with the triggering of the 886 algo with a
5 cent stop.
http://stockcharts.com/h-sc/ui?s=GDX&p=15&yr=0&mn=0&dy=3&id=t69351394690&a=338882671&r=1437984262026&cmd=print
The possibility of a super strong El Nino and higher food prices hasn’t entered the investor consciousness yet – but John has often talked about food prices and their effect on markets:
http://www.bloomberg.com/news/videos/2015-07-27/this-el-nino-will-last-even-longer-incalcaterra
@tonynguyen1969
Bad sign, oil couldn’t hold $48.
Long way down yet, copper also.
Oil = China
Gold = China
Commodities = China
China Economy = US Consumer Demand
US Consumer Demand = ???
Summer Doldrums? September 1929 coming ?
wxguru, very succinct and intuitive!! Love it.
Oil USA. The huge dollar outflows to the rest of the world due to trade deficits, primarily oil imports, greased world trade for decades. Those dollars are not nearly so plentiful as in the past, due to the US oil and natural gas boom. Unfortunately, the rest of the world borrowed $ heavily assuming the $ would stay weak forever, the proverbial sure thing. There will be a continual scramble for $ to service debts. It looks like a self perpetuating cycle has taken hold. Sell commodities to service debt. Commodity prices therefore go down, forcing prices to drop even further and so on. Of course, buying $ to pay debt service pushes it higher and so on. I call it the spread eagle, both sides going against you.
Make it worth less in fiat is easier to service debt.
Triffin dilemma is worth reading and Oil has nothing to do with it…UNLESS you look at Oil consumption per unit of exported goods to USA. Oil imports to China are used to manufacture and power demand from countries importing their junk like deadly dog food or contaminated toys.
On the DJIA from the ATH to the 9th June low is almost exactly equal to the drop from 16th July to today including out of hours. That whole move looks like a zig-zag and may well be the ‘A’ that Peter_ mentioned of a larger ABC for W4.
IF that is the case then we are due one heck of a rebound for B.
Of course it could be the 3rd of a 3rd as well in which case it will just continue heading south. We’ll know soon enough.
From an Elliott Wave perspective, the top of the recent 2 week rally in the SSEC looks like a second chance top. According to the US 18 year real estate cycle, first RE tops (2006), then the stock mkt (2007), and then the depression, 2008-9. Using that template, since Chinese RE peaked in Jun 2014, I expected the stk mkt to top this year and the depression by the end of 2016. So far so good.
7/27 9:44 first price target 2052 nearby!
For the bulls, there’s this:
http://quantifiableedges.com/updating-the-bullish-intermediate-term-tendency-following-high-cbi-readings/
It’s instructive to review how the CBI performed in 2008 – there were five separate instances the indicator was greater than 11, and all produced a profit 20 days later. At the same time, as we all know the index was down ~-39% over the course of the entire year so one had to be extremely nimble to benefit.
What Jason terms intermediate bottoms, I’d classify as short-term.
Hi Peggy,
Is a bounce possible from the 2050ish level as we approach the Fed meeting?
Thanks in advance.
yes
Is there a target for the expected bounce?
so far that target is 2071-74 for the bounce but can’t confirm that yet
Great going peggy and thanks for all updates. Can I ask you to always write timeframe with your price target? I am confused what to expect first 1949 or 2132?
OR you meant 1949 around Aug 9 and then 2132 around Sep 19?
ok will do. after a bounce at 2052ish, next price target is 1995 by Aug 9. then another wave up (probably corrective) and another low in October – likely 1949. I will update as the 7442 Spiral rotates. 🙂
OK, thanks and I look forward to the confirmation. Spiral has been spot with the recent targets.
7/27 10:37 Price targets for this bounce 2083, 2086, 2092
There were 2 targets for the Expansion high – 2122 and 2132. 2132 was not reached because Expansion (max Spiral radius) occurred during the weekend. The 7442 Spiral is still expecting higher highs after the low is in.
http://www.ustream.tv/channel/7442-analytics
Hello Peggy,
Thanks for the updates they are a good support for me here in Europe
The 7442 Spiral is still expecting higher highs after the low is in.?
Do you mean after the oktober bottom after 1945?
Thanks..
7/27 10:55 remember 2052 still possible. Make your own trading decisions.
yes John. Higher highs are likely after the low is in. I’ll continue to update but Sean is the Spiral guru.
http://www.ustream.tv/channel/7442-analytics
Do you use his software Peggy or do you just follow him on ustream.tv?
Slater please repost GDX ty
valey,..well played
please let us know your thoughts and strategy for next few days
Lunar Tuner This Week:
Phase: – all week
Declination: – M, + T to Fr.
Distance: + all week
Seasonals: + M to Th, – Fr
Planets: — all week (double negative due to Venus Inferior Conjunction 8/15).
Summary: Huge sell off this morning and I was in cash (not short). I am not yet sure how to play this, but “probably” will go long into Thursday’s open.
Valley you got the MAJORITY of the move since Monday last. You’ve got to leave some for us stragglers!! (Actually I didn’t get the last down move either LOL).
Overall a very very good call. Congrats.
Haiku for You
Markets move in ways,
That confound imagination.
Rising falling thus.
It may stop you out,
Or make you richer also,
Moves not randomly.
Valley, are you Polynesian? That is very good Haiku….from an unacknowledged expert. Hehehe.
Thank you dear Purvez,
For your kindly words of praise.
Haiku’s universal.
Lunar Tuner says
Watch for higher prices soon
Won’t last past Friday.
Went long mid afternoon US equities, Fed Meeting acts as a normalizer and should attract higher prices into Friday. In addition, price tends to rise into the Full Moon open (Thursday).
Right now on the 5min DJIA it looks like it’s trying to work out a triangle. So IF that’s correct then we’ll have a brief ‘forceful draft’ down and then a complete reversal. (Top of triangle is around 17490)
How far the reversal? Good question. Please post answers. Thx.
Three things…
1) Making a post just to test if this thing is broken…
Not one post since this morning…. :-O
2) Just an observation, the SPX/HYG ratio, while off it’s absolute peak of last week, is ~still~ very extended, even after the past week’s activity….
3) And chart-wise and indicator-wise, nothing to indicate to me that this move down is over with…. Any ST bounces notwithstanding, still holding shorts and looking for lower prices….
New post